This document analyzes Wells Fargo & Company and recommends buying its stock. It summarizes that Wells Fargo had a 16% increase in net income in 2013 and is expected to continue growing. It also discusses positive economic factors like increasing GDP and consumer confidence that will benefit Wells Fargo's loan business. The analysis concludes that Wells Fargo is well positioned for future growth with a diversified business model and a strong performance in the most recent bank stress tests.
The SVB Asset Management Economic Report, Q1 2017, is a review of and outlook on economic and market factors that impact global markets and business health.
In this edition, the team discusses the Fed's recent activity and its intentions to raise benchmark interest rates three times in 2017. The report also focuses on how the new U.S. administration will impact domestic and global economies.
MTBiz is for you if you are looking for contemporary information on business, economy and especially on banking industry of Bangladesh. You would also find periodical information on Global Economy and Commodity Markets.
Factsheet for Birla Sun Life Mutual Fund- WishfinAnvi Sharma
The scheme aims to maximize long term capital appreciation by investing primarily in equity & equity related securities of companies engaged in banking & financial services. The scheme would invest in banks as well as NBFC's, insurance companies, rating agencies, broking companies, etc.
MTBiz is for you if you are looking for contemporary information on business, economy and especially on banking industry of Bangladesh. You would also find periodical information on Global Economy and Commodity Markets.
U.S. economy struggles to emerge from deep freeze. As 2014 began, the foundation was in place for better economic growth as the drags on the U.S. economy in 2013 were poised to reverse. But Mother Nature had other ideas, and severe winter weather caused significant disruptions to the U.S. economy. However, signs have emerged in recent weeks that the economy has made some progress underneath all that snow and ice. Underlying fundamentals in the labor market suggest that the job market may be thawing, and businesses are beginning to invest more in future growth through capital spending.
Borrowing costs for middle-market debt issuers generally declined during the third quarter, despite a modest increase in leverage levels and little change in benchmark rates. The Fed, as expected, left benchmark interest rates unchanged in the third quarter, but did announce a program to gradually reduce its balance sheet from $4.5 trillion (a result of recessionary quantitative easing) to $3 trillion over the next three years. Thus, the prevailing combination of low borrowing costs, high leveragability and a generally benign default rate outlook, presents an attractive backdrop for issuance. This "perfect storm" of market conditions provides a compelling (albeit narrowing) window for middle-market issuers.
MTBiz is for you if you are looking for contemporary information on business, economy and especially on banking industry of Bangladesh. You would also find periodical information on Global Economy and Commodity Markets.
Signature content of MTBiz is its Article of the Month (AoM), as depicted on Cover Page of each issue, with featured focus on different issues that fall into the wide definition of Market, Business, Organization and Leadership. The AoM also covers areas on Innovation, Central Banking, Monetary Policy, National Budget, Economic Depression or Growth and Capital Market. Scale of coverage of the AoM both, global and local subject to each issue.
MTBiz is a monthly Market Review produced and distributed by Group R&D, MTB since 2009.
2014 Economic Outlook (Michael Brown, Wells Fargo)PublicFinanceTV
"Economic Outlook for 2014 and Beyond" presented by Michael Brown, Economist with Wells Fargo Securities, on December 13, 2013, at the Winter 2013 NCLGBA Conference, Asheville, NC.
As Fed tapering unfolds, we expect to see stronger growth from developed markets, while emerging markets in aggregate may experience further currency and capital market weakness. In the United States, declining labor participation continues to drive falling unemployment figures, and may harbor the beginning of a wage inflation surprise.
• We expect credit, liquidity, and prepayment risks will continue to
be rewarded by the market in the months ahead, while interestrate
risk remains unattractive due to its asymmetric risk profile.
1Introduction My name is Yinan Hong. I am your port.docxaryan532920
1
Introduction
My name is Yinan Hong. I am your portfolio manager from Trailblazer
Investment Advisors. I am a CFA charter holder, equipped with sufficient financial
knowledge. I will help my customers manage their wealth and try my best to gain??
as much as possible. There are three objectives for my clients, Sam and Amy
Kratchman who have recently inherited … and have current savingswith
$1,100,000(on an after-tax basis) inheritance. The first one is having enough money
for their life after retirement at age 65. The second objective is raising college tuition
for their two children. The last one is to buy a beach house with newfound inheritance.
Ending summary
Economic Analysis
2014
GDP Growth
The economic recovery of United States in 2014 became a light brightspot in
global economy after the 2009 recession. The low price level do you mean low infl?
If so that isn’t really a great thing at the current time, decreasing unemployment rate,
better development of the what is the estate?estate and manufacturing industry made
the economy continuously recover although at a much lower rate than prev recoveries.
However, some important indexes like the investment of the real estate, income of
amy kratchman � 2016/10/16 12:32 PM
已设置格式: ⾏行行距: 1.5 倍⾏行行距
2
residents residents?, manufacturing have not reached to the same level as it performed
before the recession in 2014 – true – but RE was performing very well and is a strong
area of growth in 14. The percentage change in Real Gross Domestic Product in 2014
increased in the former three quarters and then decrease in the Q4.not true
In the first quarter, the change of GDP was 2.1% not correctnegative growth1.
The most important factor was the abominable weather. The personal consumption
expenditures for nondurable goods decreased because 1what is this? the inconvenient
of buying your table (footnoted) does not imply a decrease. The Gross private
domestic investment decreased 6.6% because of the huge lower equipment
investment1. The exports decreased extremely and the imports increased. They all led
to the negative growth.
Figure12 : CCI Index in 2014
The GDP growth reached to 4.0% in the second quarter. By analyzing the
components that affected overall GDP growth, personal consumption expenditures
1http://bea.gov/iTable/iTable.cfm?ReqID=9&step=1#reqid=9&step=3&isuri=1&904=2013&903=1&9
06=q&905=2016&910=x&911=0
2 FactSet
3
and gross private domestic investment played an important role in this significant
growth. Consumption contributed 2.56% change in GDP. After the severe weather,
the private inventory investment, exports, fixed investment, and non-federal
government spending increased.this is a rebound in pretty much all areas However, 5%
more imports negatively impact GDP and offset those positive contributors.
Purchasing Managers’ Index (PMI) also ...
Mercer Capital's Value Focus: Auto Dealer Industry | Mid-Year 2014Mercer Capital
Mercer Capital's Auto Dealer Industry newsletter provides perspective on valuation issues. Each newsletter also includes a macroeconomic trends, industry trends, and guideline public company metrics.
Mercer Capital's Value Focus: Auto Dealer Industry | Year-End 2014Mercer Capital
Mercer Capital's Auto Dealer Industry newsletter provides perspective on valuation issues. Each newsletter also includes a macroeconomic trends, industry trends, and guideline public company metrics.
Our lead Newsletter Article, “Will 2014 Be a Happy New Year?” discusses retiring Fed Chair Bernanke’s prediction, and consensus economists’ belief, that we will have a strong recovery in 2014. The Wise Old Owl talks about what your business should do to have a strong 2014.
Outlook 2015 - Making Sense Of The MarketsPhil Caulfield
As we approach year end, you may be wondering:
What can we expect to happen in the US Markets and the economy and how will that affect rates and house prices?
At Opes Advisors, our CEO Susan McHan has been working with our Chief Investment Officer, Mark Duvall, CFA® to help answer that question and we’ve just completed our “Outlook 2015: Making Sense of the Economy and the Current Markets.” I thought it would be beneficial to you to hear some of our current perspective.
________________________________________
Our Outlook for Interest Rates
As the graph below indicates, we have been experiencing a long term downtrend in interest rates since 1982. The rise in rates in 2013 followed by the drop in 2014 is consistent with a sideways trending market. We believe that short-term interest rates will rise slowly while longer-term interest rates will remain in a tight range below 3.2%. We expect the Fed to raise short-term rates in the first half of 2015 and longer-term rates to rise gradually.
Rates today are still low relative to long-term historical levels and within the average range of the past 3-4 years. This is important, as interest rates are a significant factor in determining home affordability. With interest rates remaining low, national and regional home affordability remains high.
Our Overall Outlook
Beyond interest rates, “Outlook 2015” captures our perspective on the following topics:
• What is our Economic Outlook for 2015 and beyond? What factors do we watch to inform our perspective?
• What factors informed our Interest rate Outlook and what factors determine whether they will rise or fall in the future?
• And importantly, how will the economy and interest rates impact our real estate markets, your business and your clients as we move into 2015 and beyond?
I would welcome the opportunity to share our complete Outlook with you. Please call me if you’d be interested in learning more about our Outlook and hearing a full presentation.
If U.S. politics do not derail the recovery, pent-up demand can drive faster economic growth. Fixed-income outflows appear likely to continue, pushing rates higher.
This Month in Real Estate PowerPoint for U.S. Market - September 2010
WFC Applied Equity Valuation Report
1. Krause Fund Research
Financials
Banking
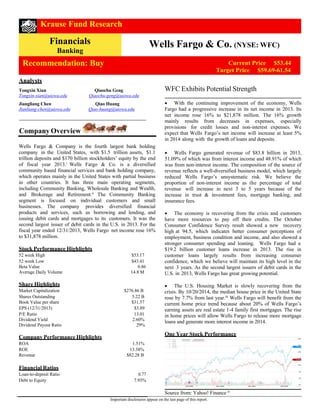
Recommendation: Buy
Analysts
Tongxin Xian Qiaochu Geng
Tongxin-xian@uiowa.edu Qiaochu-geng@uiowa.edu
Jiangliang Chen Qiao Huang
Jianliang-chen@uiowa.edu Qiao-huang@uiowa.edu
Wells Fargo & Company is the fourth largest bank holding
company in the United States, with $1.5 trillion assets, $1.1
trillion deposits and $170 billion stockholders’ equity by the end
of fiscal year 2013.i Wells Fargo & Co. is a diversified
community based financial services and bank holding company,
which operates mainly in the United States with partial business
in other countries. It has three main operating segments,
including Community Banking, Wholesale Banking and Wealth,
and Brokerage and Retirement.ii The Community Banking
segment is focused on individual customers and small
businesses. The company provides diversified financial
products and services, such as borrowing and lending, and
issuing debit cards and mortgages to its customers. It was the
second largest issuer of debit cards in the U.S. in 2013. For the
fiscal year ended 12/31/2013, Wells Fargo net income rose 16%
to $31,878 million.
Stock Performance Highlights
52 week High $53.17
52 week Low $43.41
Beta Value 0.86
Average Daily Volume 14.8 M
Share Highlights
Market Capitalization $276.86 B
Shares Outstanding 5.22 B
Book Value per share $31.57
EPS (12/31/2013) $3.89
P/E Ratio 13.01
Dividend Yield 2.60%
Dividend Payout Ratio 29%
Company Performance Highlights
ROA 1.51%
ROE 13.38%
Revenue $82.28 B
WFC Exhibits Potential Strength
With the continuing improvement of the economy, Wells
Fargo had a progressive increase in its net income in 2013. Its
net income rose 16% to $21,878 million. The 16% growth
mainly results from decreases in expenses, especially
provisions for credit losses and non-interest expenses. We
expect that Wells Fargo’s net income will increase at least 5%
in 2014 along with the growth of loans and deposits.
Wells Fargo generated revenue of $83.8 billion in 2013,
51.09% of which was from interest income and 48.91% of which
was from non-interest income. The composition of the source of
revenue reflects a well-diversified business model, which largely
reduced Wells Fargo’s unsystematic risk. We believe the
proportion of non-interest income as the percentage of total
revenue will increase in next 3 to 5 years because of the
increase in trust & investment fees, mortgage banking, and
insurance fees.
The economy is recovering from the crisis and customers
have more resources to pay off their credits. The October
Consumer Confidence Survey result showed a new recovery
high at 94.5, which indicates better consumer perceptions of
employment, business condition and income, and also showed a
stronger consumer spending and loaning. Wells Fargo had a
$19.2 billion customer loans increase in 2013. The rise in
customer loans largely results from increasing consumer
confidence, which we believe will maintain its high level in the
next 3 years. As the second largest issuers of debit cards in the
U.S. in 2013, Wells Fargo has great growing potential.
The U.S. Housing Market is slowly recovering from the
crisis. By 10/20/2014, the median house price in the United State
rose by 7.7% from last year.iii Wells Fargo will benefit from the
current home price trend because about 20% of Wells Fargo’s
earning assets are real estate 1-4 family first mortgages. The rise
in home prices will allow Wells Fargo to release more mortgage
loans and generate more interest income in 2014.
One Year Stock Performance
Financial Ratios
Loan-to-deposit Ratio 0.77
Debt to Equity 7.93%
Important disclosures appear on the last page of this report.
Company Overview
Wells Fargo&Co. (NYSE: WFC)
Current Price $53.44
Target Price $59.69-61.54
Source from: Yahoo! Finance iv
2. Page 2
Executive Summary
We recommend to buy Wells Fargo & Company at this time
based on our economic, industry, and company analysis. We
predict the GDP will continue to increase in 2015 and the
unemployment rate will decrease. Based on our prediction
and analysis, these factors influence the consumer
confidence to increase. With a consumer purchasing power
increase, people will borrow more money from banks in
order to spend more. As the world’s biggest bank and
number one lender to small business in the U.S., Wells
Fargo’s loan business will continue growing. Our analysis
shows the interest rate will increase in 2015, which will help
Wells Fargo grow its profit as more loans are given out.
Economic Analysis
Gross Domestic Product
Real Gross Domestic Product, GDP, is one of the most
important economic factors to measure the well-being of an
economy. GDP defined as the output of goods and services
produced by the labor and property located in the Unites
States within a specific time period. V Many analysts and
economists use it as an indicator to gauge a nation’s
standard of living because it represents the size of the
nation’s economy. We think GDP is a very essential
economic factor for the finance sector because the
Federal Reserve often uses GDP as a benchmark to
adjust its monetary policy, which will have a huge
impact on the financial services industry.
According to the Federal Reserve’s projection, the GDP will
increase around 3.0%-3.2% in 2015. Historically, GDP
gradually recovered from the recession with 2.5% increases.
Also, GDP continued growing during the first three quarters
of 2014. From our opinion, we partially agree with the
Federal Reserve’s projection. We believe it will increase
3.0% in the future six months, slightly decreased from
the actual GDP in third quarter 3.5%. We predict that GDP
will increase around 2.7%-3.0% in the future 2-3 years.
Continue growing GDP will have positive impacts on the
financial service sector. As the big economic environment is
turning into a better situation, the consumer’s purchasing
power will increase and consumer confidence will increase
at the same time. With the increase of consumer spending,
people tend to borrow more money from banks and credit
companies, which speed up the development of the financial
industry.
Source from: Federal Reserve vi
Source from: Federal Reserve vii
Unemployment Rate
Unemployment rate is the earliest indicator of economic
trends released each month. We think unemployment rate is
very important because a high unemployment rate will
lower the development speed of the country and lower the
nation’s spending power, which will prevent people from
borrowing money from banks.
Based on the data from the Bureau of Labor Statistics, the
number of unemployment rate has been volatile during the
years. Since 2009, the unemployment rate showed a
downtrend and decreased by nearly 1.0% each year.
According to the Federal Reserve, the unemployment rate
will stay around 5.4%-5.7% in 2015 and keep from 5.2% to
5.5% in the long run. We partially agree with the forecast
given by the Federal Reserve. We predicted that the
unemployment rate will keep around 5.8% in the future six
month and decrease to 5.6%-5.8% in the future 2-3 years.
We believe a lower unemployment rate will be beneficial to
the financial service sector because people tend to spend
more money when they have a job. The consumer spending
will increase when the unemployment rate decreases.
Strong purchasing power will lead to more loans and
money borrowing that will increase the business of banks
and credit companies.
Source from: Bureau of Labor Statisticsviii
3. Source from: Bureau of Labor Statistics ix
Consumer Confidence Index
The consumer confidence index is based on a random consumer
confidence survey provided by The Conference Board. The
index that has base year 1985 equal to 100 point and measures
U.S. consumers’ optimism and sentiment. Consumer Confidence
Index (CCI) increased from last year’s range 58.43 to 82.13 to
current year’s 78.3 to 94.48 after adjusting the seasonal effect,
even reached the highest point at October as 94.48 after
economic crisis of 2008.x Financial sector, the uptrend of CCI is
benefiting the financial sector, especially for the consumer
finance industry.
Sources from: Factset dataxi
The table above shows the CCI data from 2007 to September,
2014. As higher consumption optimism which dramatically
increased from the depression, we expect that the consumer
confidence will continue being optimistic and reach 100 to 110
that is similar to the point before crisis. Also, the uphill data,
which means higher consumer expenditures, gives the consumer
finance industry a positive effect.
New Housing Starts and Mortgage Rates
New housing starts is a very important factor because the
housing market controls 4% of GDP that indicates
consumer’s house purchasing power. More new housing
starts represent higher consumer spending and confidence to
the market.
30-year fixed mortgages rate is the most important driver of
the new housing starts. From the historical price, the
mortgage rate had a downtrend from 1990 and fluctuated a
little during the years. The mortgage rate increased 15%
since 2012 and stayed at 4.211% in 2014. The rebound of
the mortgage rate in 2012 cause housing price to go
increase. In 2015, we predict the mortgage rate will stay
around 4.5%-4.75%. In the future 2-3 years, we expect
the mortgage to increase to 5.5%-6.0%. Lower mortgage
rate will
stimulate consumers to purchase more houses and spend
more money, which would increase the loan business of
banks and credit companies.
Source from: Freddiemac xii
Industry Analysis
Market and Competition
Since the 2008 financial crisis, the diversified financial
services industry recovered well with the huge support from
the government and market development. A low
unemployment rate, a low interest rate and increasing
GDP have positive impacts on the market and they speed
up the industry growth. To be general, borrowing and
lending, the debit card issue and loan mortgage for
customers contribute to the whole market most.
The diversified financial services industry is highly
competitive and intense. Based on Porter’s five forces we
conclude three main reasons to explain the current situation
in the industry: the bargaining power of suppliers and
buyers, threat of substitutes and entrants, and rivalry of
competition. The diversified financial services industry is
one of the most important industries in the financial
services sector because it covers business from personal
level to institution level of lending-based services. The
power of the diversified financial services industry as a
supplier is very strong because it mainly provides
financial services, does conventional banking operations
and offer loans to small or medium corporations. Also, as
a buyer, the diversified financial services industry plays an
important role due to its strong purchasing power.
The threat from substitutes and new entrants is very
obvious. Many companies outside the industry are trying to
get in and share wealth. For example, an insurance
company can easily start its loan business and take away
some market share that belongs to original loan banks. Also,
companies like Google and Apple have started to introduce
their own electronic wallets that will take away from the
financial services market. However, with strict regulation
and capital requirement, new entrants cannot easily survive.
Customers value companies’ name and prefer old banks that
provide wide range of services.
Page 3
4. Page 4
For rivalry of competitions, the competition within the
industry is very intense. Companies try to introduce new
services and provide better products that fit customers’
demand. At the same time companies in the industry are
trying to form into a group while works against the pressure
from the government and competitors outside of the
industry.
Industry Trends and Recent Development
Federal Reserve Polices
The current situation of Federal Reserve policy is
complicated and changes during time. It is very hard for
investors to predict what the Fed is going to do next and
make rational investment decisions. However, with the
historically low interest rates, banks and other financial
service-related companies still generate revenue and move
the market.
According to the newest report released by the Federal
Reserve in November, all depository institutions must hold
a percentage of certain types of deposits in a Federal
Reserve Bank as vault cash.xiii Also, depository institutions
must report to Feds regularly about their deposits and other
reservable liabilities situations.xiv For the deposits, the
Federal Reserve will pay a certain amount of interest rate to
the banks. This action keeps part of the bank assets liquid
so they can be used in case of emergencies.
Along with keeping the cash liquid, the Federal Reserve
decided to still keep low interest rates in 2015 around 0-
0.25%.xv The Federal Reserve is trying to use low interest
rates to maximize employment and keep the market stable.
In the long run, the Federal Reserve decided to slowly rise
the interest rate, which is a good sign for Wells Fargo. With
the rising of the interest rate, Wells Fargo’s banking
business will increase and its profit margin will increase
as well. Also, Federal Reserve purchased a large number
of long-term Treasury securities to make the financial
market move and grow in a stable pace.
Stress test
In March, a stress test revealed the newest test results. In the
report, Federal Reserve tested 30 total financial companies
and only one company, Zions Bancorp, failed to meet the
5% top-tier capital threshold. The stress test examined the
banks anti-pressure liability under a big financial crisis. The
test scenario included the real GDP becoming -4.6%,
unemployment rate turn to peak level at 11.3%, home prices
reach -26% and 10-year treasury yield reach 1.6%. xvi The
annual stress test helped the Federal Reserve to make sure
big banks have enough assets to deal with crisis. Also, it
makes sure the financial industry is able move the market
when the crisis is coming.
Based on the test results, we have a strong belief the
financial industry will perform well if there is an economic
downturn. The best performers in the test include Bank of
New York Mellon and State Street Corporation. The lowest
performers included Bank of American and JPMorgan
Chase. xviiThe results showed Wells Fargo performed well
under the hypothetical scenario because it hits 8.2% tier 1
common ratio. It means wells Fargo will still have the
ability to repurchase and pay dividends during an economic
downturn.
Before the Stress test, the Federal Reserve rejected five
banks’ capital plan including Citigroup. The Fed said
Citigroup’s plan did not provide the accurate number that
how much it will lose in a severe economic downturn. xviii
In addition, the Feds is not satisfied with the capital plan
submit by Bank of America and Goldman Sachs and asked
these two banks resubmit their plans. Wells Fargo’s
performance is highly rated by Feds because the company is
working its best to adjust new regulation and maximize
shareholder’s equity. Wells Fargo’s capital plan shows the
company is going to pay its dividends to 0.35 per share and
repurchase additional 350 million shares in the next year.
The figure shows the tier 1 common ratio results of the
stress tests:
Source from: Forbesxix
Peer competition
As Warren Buffet’s favorite bank and Berkshire Hathaway’s
largest equity holding stock, Wells Fargo occupies a
competitive position in the industry. According to the
newest report released this May, Wells Fargo is the only
bank that had positive shares that grow by 8% among its
peers. Other big banks like JPMorgan Chase decreased
8% of its share, Citigroup decreased 11% of its share and
Bank of America decreased 7%.Xx That main reason of
Wells Fargo’s success is its old fashioned operation
method, which includes mortgage lending, credit cards,
debits cards, deposits and loans business. These traditional
banking businesses helped Wells Fargo generate a large
amount of profits.
5. Page 5
Source from: our own valuation and Buzz.Moneyxxi
Company Analysis
Company Business Description
Wells Fargo & Company was founded in 1956 in San Francisco,
California. The company is the fourth largest bank holding
company in the United States, with $1.5 trillion in assets, $1.1
trillion in deposits and $170 billion stockholders’ equity by the
end of fiscal year 2013.xxii Wells Fargo & Co is a diversified
community based financial services and bank holding company,
which operates mainly in the United States with partial business
in other countries. It has three main operating segments,
including Community Banking, Wholesale Banking, and
Wealth, Brokerage and Retirement.xxiii Community Banking
focuses on individual customers and small businesses. The
company provides diversified financial products and services,
such as borrowing and lending, and issuing debit cards and
mortgages to its customers. It was the second largest issuer of
debit cards in the U.S. in 2013.
Source from: Nilson Report xxiv
As its name reflects, the Wholesale Banking segment deals with
larger institutional customers across the country. The Wealth,
Brokerage and Retirement segment focuses more on financial
services such as investment advisory. Community banking
consists of nearly 60% of Wells Fargo & Company’s total
revenue.xxv
Corporate Strategy
All the business strategies that Wells Fargo has are in order to
achieve its core vision, which is to satisfy all of its customers’
financial needs, help customers succeed financially, and be
recognized as the premier financial services company in its
market.xxvi The primary business strategy that Wells Fargo has
is increasing the number of its financial products and providing
high-quality financial products and services to satisfy its
customers’ needs.xxvii
Cross-selling enables Wells Fargo to maximize the
profit from each customer and increases its customer
loyalty through offering customers the products and
services they need, when they need them, to help them
succeed financially.
Wells Fargo use technology to personalize service to
customers.
Wells Fargo has a Customer-Centric business strategy-
“We start with what the customer needs, not with what
we want to sell.”xxviii
Financial Summary
Along with the thriving of the whole economy and the financial
industry, Wells Fargo had a strong year with a 16 percent
increase in its net income, reaching $21.9 billion. It generated
$83.3 billion in revenue in fiscal year 2013 and increased its
diluted earnings per common share by 16 percent to $3.89.
Wells Fargo increased its loans and deposits in 2013. The total
loans at the end of 2013 were $825.8 billion and the total
deposits reached a record of $1.1 trillion. Wells Fargo divides its
loans into a commercial segment and a customer segment. In
2013, the commercial segment loans had a $20.7 billion increase
and customer loans had a $19.2 billion increase. xxix The strong
financial performance in 2013 made Wells Fargo the most
profitable U.S. bank and it ranked as the world’s most valuable
bank by market capitalization. xxx
Products and Services
Community Banking
Community banking offers consumers and small businesses with
diversified financial products and services, such as investment,
insurance, mortgage and home equity loans, and trust services.
The community banking segment includes retail banking, small
business banking, regional banking, and Wells Fargo Home
Lending business units. xxxi
The community banking segment generated $12.7 billion in net
income in 2013, increased 21% compared to 2012. However, its
revenue decreased $3.1 billion by 6 percent compared with
$53.4 billion in 2012. The increase in net income mainly results
from the decrease in provision of credit losses and non-interest
expenses.
We believe the consumer loans will increase by 4.2% and the
commercial loans will increase by 3.8% in 2014. We think that
6. consumer loans will increase because consumer confidence was
increasing during year 2014. On October 28th, consumer
confidence reached 94.5, which reflects consumers’ optimism in
the outlook of both jobs and incomes that will boost personal
consumption and increase loans. We believe that mortgages and
automobile loans will increase by 5% and credit cards and other
loans will increase by 2% and 3% respectively.
Wholesale Banking
Wholesale banking includes Middle Market Commercial
Banking, Government and Institutional Banking, Corporate
Banking, Commercial Real Estate, Treasury Management,
Corporate Trust and Assets Management.
Wholesale Banking reported a 5% increase in net income of $8.1
billion in 2013 compared to net income of $7.8 billion in 2012.
The increase in net income also comes from the decrease in
provision of credit loss and strong growth in asset backed
finance, asset management capital markets and corporate
banking. xxxii
We believe wholesale banking will continue to grow because
real estate mortgages, real estate construction and commercial
and industrial loans will continue to grow as the result of the
growing economy. We expect commercial and industrial loans
and real estate mortgage loans to increase by 4% in 2014.
Wealth, Brokerage and Retirements
Wealth, Brokerage and Retirement provides a full range of
financial advisory services to clients. Services includes wealth
management solutions (financial planning, private banking,
credit, investment management, and fiduciary services.)xxxiii
Wealth, Brokerage and Retirements reported a net income of
$1.7 billion in 2013, up 29% from 2012. The increase in net
income results from improvement in credit quality and growth in
loan balance.
We forecast that the Wealth, Brokerage and Retirement segment
will have a slight increase in 2014. We expect the insurance fee
to increase by 2% and the trust and investment fees to increase
by 6.8% in 2014.
Page 6
(Source from: Wells Fargo Annual Report 2013)xxxiv
Marketing Strategy
Wells Fargo has a core vision in building strong and life-time
relationships with its customers. Therefore increasing
financial products is a key of its marketing strategy. Cross-selling
strategy and extending services geographically
accelerate Wells Fargo’s ability to gain more new customers.
Analysis of Recent Earnings Release
On October 14th, 2014, Wells Fargo released its 3rd quarter
earnings report, which showed a continuing growth in both net
income and diluted earnings per share compared to the prior
year.
Net income of $5.7 billion, up 3% from third
quarter 2013
Diluted earnings per share up 3% to $1.02 from prior
year
Revenue of $21.2 billion, up 4%
ROA of 1.4% and ROE of 13.10%
The good financial performance in the 3rd quarter results from
strong loan and deposit growth in 3rd quarter, 2014. The
company did well in reducing and controlling its noninterest
expenses. The efficiency ratio was 57.7 percent in third quarter
2014, decreased by 0.2% compared to 57.9 percent in the
previous quarter. The continued improvement in credit quality
helps the company maintain its loan losses at historical lows.
The company only released $300 million from the allowance for
credit losses, which reflects a better expectation of future
economy. The net charge-offs were $668 million in third quarter
2014, decreased by $307 million from third quarter, 2013. Wells
Fargo declared $3.6 billion of common stock dividend and net
share repurchase including $1.0 billion forward share repurchase
expected to settle in fourth quarter, 2014. We believe with the
strong economic growth, Wells Fargo will continue to increase
its net income and dividend in fourth quarter, 2014.
Competition Analysis
The diversified financial industry within the financial sector is
highly correlated with the S&P 500 index, which has strong
performance in 2013. The competition within the industry is
highly competitive. The main competitors of Wells Fargo
include U.S. Bancorp, Bank of American Corporation, JPM
Chase &Co., and CitiGroup Inc.
Key statistics comparison between WFC and its competitors:
(For Fiscal Year 2013)
Source from: Retrieved from Bloomberg, Comparative
Analytics, Relative Valuationxxxv
7. As the comparison table above states, Wells Fargo has the
highest market capitalization among its competitors. Both its
Return on Equity and Return on Assets ratios are above the
average of its competitors. We believe Wells Fargo is very
competitive among its peers because Wells Fargo has a relatively
high net interest margin, which accounts for its high net income
level. In addition, Wells Fargo has a high dividend yield of
2.62%, which is very attractive to most investors. The current
and forward economic outlook is very positive. With the
recovery of economy and improvement in the housing market,
we believe Wells Fargo can boost its profitability by increasing
its loans and deposits. In addition, Wells Fargo’s reputation was
not severely damaged during the financial crisis between 2008
and 2012. As a result, it has a competitive advantage compared
to its competitors.
Below is the one year stock price performance comparison of
five companies.
Even though the diversified financial industry is relatively
mature and intensely competitive, Wells Fargo has a unique
advantage among its competitors. The cross-selling business
strategy provides appropriate products and services to the right
customers. The cross-selling strategy allows Wells Fargo to
maximize the profit from each customer and increases its
customer loyalty through enhancing the connections between the
company and its customers. The focus on technological
development is a competitive advantage for Wells Fargo because
it helps Wells Fargo develop a better customer database and
personalize products to its customers.
Dividends Payout Plan
Dividends payout plan is restricted by the regulatory policies as
well as capital guidelines. As a financial holding and bank
holding company, Wells Fargo & Company’s capital actions are
regulated under the New Capital Rule forced by the Federal
Reserve. The Dodd-Frank Act enforces straightforward capital
ratios that must be achieved by all bank holding companies,
including Wells Fargo & Company. In March 2014, the Federal
Reserve released the report of “Supervisory Stress Test
Methodology and Results” projected minimum Tier 1 common
ratio for all bank holding companies from quarter 4, 2014 to
quarter 4, 2015. Among 30 participants, Wells Fargo &
Company generated a projected Tier 1 common ratio of 8.2%.
This ratio might be low because it just reaches the median
performance among 30 participants.
Exhibit below is Wells Fargo’s dividend history from 2004 to
2014
Source from: Wells Fargo, Stock Price and Dividendxxxvii
Wells Fargo currently has a dividend payout ratio of 29%. The
approved capital plan of Wells Fargo & Company includes an
increase of 350 million additional share buybacks in 2014. In
addition, dividend per share increases by 16.7% from 0.30 cents
per share in 2013 to 0.35 cents per share in 2014.xxxviii According
to this modest capital plan, we value the stock of Wells Fargo &
Company because it focuses on its stabilities and holds a
conservative strategy. We project that the dividend payout ratio
will rise to 33% in 2014 because of Wells Fargo’s modest
capital plan and better future credit quality.
Government Regulation
The diversified financial industry is heavily regulated by the
Office of the Comptroller of Currency, the Federal Reserve
Board and the Federal Deposit Insurance Corporation (FDIC).
Regulations can help and hurt Wells Fargo at the same time.
Basel capital and liquidity standards and FRB guidelines and
rules require Wells Fargo to have higher capital reserve, which
will limit Wells Fargo’s reinvestment and retain activities. After
the financial crisis in 2008, Wells Fargo and other financial
institutions were subjected to a series of new regulations, such
as new minimum capital reserve for companies’ subsidiaries.
The regulatory environment will have significant influence on
the dividend payout policies, the type of assets to invest in and
other financing and investing activities.
The increasing trend of Wells Fargo’s Equity/Asset ratio is
strong evidence that Wells Fargo has made most necessary
adjustments for the new regulations. From our valuation model,
Wells Fargo currently has 13.15% of return on equity in 2013
and the ROE ratio will decrease to 12.81% as a result of the
FDIC’s new regulation that requires banks to hold more capital
reserves and the type of risky assets that banks can invest in.
However, we believe the government regulation on capital
reserves and interest rates will ease in three to five years along
with the recovery of the economy. Therefore, the Return on
Equity will start to increase in year 2017 and beyond.
Catalysts for Growth/Change
A robust recovering economy could be a catalyst for
Page 7
growing earnings for Wells Fargo & Company. Since Wells
Fargo & Company adopts conservative growth strategy; we
Source from: Yahoo! Financexxxvi
8. believe if the economy is really recovering rather than only
nominal indicators, Wells Fargo & Company would benefit
from its recent stable performances. In addition, with the
improvement in consumer confidence and unemployment,
we expect a strong growth in commercial loans, consumer
loans and interest-bearing deposits. Wells Fargo can increase
its net interest margin by increasing its loans and
deposits in 2014.
Page 8
The brand of Wells Fargo & Company is another strong
catalyst for its growth. Among the other big four banks in
the U.S. (JPMorgan Chase, Bank of America, Citigroup,
U.S. Bank), Wells Fargo & Company has the smallest asset
size. However, it has the largest market capitalization
($264.2 billions) among the big four banks.xxxix As we can
see, Wells Fargo & Company is a valuable investment
decision.
S.W.O.T. Analysis
Strengths/Opportunities
Wells Fargo has a powerful brand name and a highly
recognized logo- the horse. The company has a great
reputation among customers and good marketing and
business strategy.
As the second largest bank in deposits, home mortgage
servicing, and debit cards, WFC has a strong dividend
and total payout ratio, and those ratios continue to
grow.
Wells Fargo is not highly exposed to the global
market, so it can prevent some currency risk and other
international trade risks.
The company’s core value is people, both customers
and employees. Wells Fargo has over 265,000
employeesxl. The company contributes to different
volunteer works and pay back to its communities.
Weakness/ Threats
WFC has less exposure to global business compared to
other financial companies, which might lose some good
investment opportunities.
The financial industry is relatively mature, stable and
highly competitive. Compared to Discover, and Citi
Bank, Wells Fargo’s credit reward program is less
attractive. There are threats of product substitution by
other commercial banks
As the largest U.S mortgage lender, Wells Fargo is
restricted by Federal policies. Changes in
government regulation and the Federal Reserve rate
will have influence on Wells Fargo’s business
model.
Valuation Summary
We valued Wells Fargo under multiple valuation models,
including Discounted Cash Flow/ Economic Profit model,
Dividend Discount model and Relative model. Results are
shown below:
We are confident in our Discounted Cash Flow Model because it
reflects most of our assumptions compared to other models. We
think the Dividend Discount Model is also reliable because Wells
Fargo has a relative stable dividend payout ratio around 30%. As
long as the growth rate of the dividend is not reasonable, the
Dividend Discount Model can give us a conservative price
forecast. The results from relative multiple models show Wells
Fargo’s stock is greatly overvalued. We recognize there is a lot of
bias in estimation of comparable firms’ future multiples and it is
hard to track and analyze the differences between multiples across
firms. For that reason, we think the relative multiple model’s
results are not reliable.
Assumptions
Revenue Decomposition
As a financial company, Wells Fargo’s revenue is largely
driven by its interest income, which results from different
interest-bearing earning assets. We segment interest-bearing
earning assets into five main categories: Federal funds sold
and other short investments, Trading Assets, Investment
Securities, Loans, and Others.
Our key assumption under revenue decomposition is the
growth of each earning assets and funding resources’
interest rate. In Wells Fargo’s own revenue decomposition
table, they use the average balance of each earning assets,
therefore they can maintain a stable interest rate across
different years. In our revenue decomposition model, we
use the same amount on the balance sheet for each earning
assets due to lack of Wells Fargo’s daily transaction data.
Since we have every earning assets’ balance, in order to get
the interest income for each earning assets, the key
assumption we have to make is the interest rate.
We expect the interest rate on Real estate 1-4 family first
mortgage loan will increase to 4% in 2014 due to the
increasing price of house and personal income. We also
projected the interest rate of commercial and industrial loans
increase to 3.75% in 2014 because of the improvement in
economy. The increase in interest and non-interest bearing
expense offset the increase in commercial and consumer
loans’ interest income. In our revenue decomposition, loans
weight more than 70 percent of interest-bearing earning
assets that generate interest income. Consumer loans count
around two third of total loans with estimated interest
income of $22,792 million in 2014. The commercial loans
will have estimated interest income of $14,335 million in
2014.
Dividend Discount Model
Wells Fargo has relatively stable and consistent dividend
payout to its shareholders. It paid $5,953 million in dividend
in 2013 and has a dividend payout ratio of 29 percent. We
assume the dividend declared per common share will
increase to 1.40 in 2014, which can push up the dividend
payout ratio to 33 percent. When calculating the intrinsic
value by using the DDM model, we get a target price of
$59.94. We think this price will be very close to the fair
price because the assumption of dividend growth and
dividend payout is conservatively reasonable.
Dividend Discount Model $59.94
Discounted Cash Flow/Economic Profit $61.78
Relative P/B $40.38
Relative P/E (EPS 2014) $50.55
Relative P/E (EPS 2015) $49.06
9. Page 9
Relative Multiple Models
We select Bank of America Corporation, JPMorgan Chase
& Co, CitiGroup, and U.S. Bancorp as Wells Fargo’s
comparable firms because they are in the same industry and
they are the five biggest banks in the United States. Besides
the five banks, we also select Morgan Stanley and Goldman
Sachs Group, Inc. as Wells Fargo’s comparable firms
because some of Wells Fargo’s investment segment
business overlapped with those two companies’ business.
The result from relative multiple model shows that Wells
Fargo is largely overvalued now. The relative price over
book model give us $ 40.38 and the relative P/E (EPS 2014)
give us $50.55. We are not very confident in our relative
multiple model because we believe Wells Fargo should be
trade at a premium.
We believe the government regulation will change in a
positive way for financial institutions along with the
economy’s recovery in the future. Compared to other
financial institutions, Wells Fargo has its relative
advantage. Because it did not suffer a great loss and
retained its great reputation during the financial crisis,
therefore it can grow its deposits and loans at a faster rate
than other financial institutions whose reputation was
severely damaged during the financial crisis.
Moreover, we believe the future competition among
financial institutions will be largely driven by technology.
Since Wells Fargo has been dedicated in developing its
technology-based products and services, we expect Wells
Fargo can be traded at a premium.
DCF and EP Models
We believe DCF and EP models are the most accurate
forecasts because DCF and EP model covered all of our key
assumptions, which is relatively conservative and realistic.
The most important assumptions in the calculation of DCF
and EP models are cost of equity and FCFF. Details about
assumption of cost of equity are shown below. The DCF and
EP models give us the highest intrinsic price, $61.78. We
think the price in DCF/ EP models is reasonable because
considering the diversified business models and the stable
growth that WFC has, we expected the stock price to grow
in the future.
Cost of Equity
As a financial firm, we use the cost of equity to forecast the
future price instead of weighted average cost of capital. We
use the Capital Asset Pricing Model to calculate the cost of
equity. For the risk-free rate, we used 30-year long-term US
Treasury Bond rate because it is the least risky investment,
even it doesn’t match our forecast horizon. For the equity
risk premium, we used the geometric average premiums
because it considers the compounding of returns over the
long horizon. For the equity beta, we first looked at the
Bloomberg WFC raw beta, which is 0.98. We also looked
up on Yahoo! Finance, the beta they have for WFC is 0.86.
However, after we compare Wells Fargo’s historical beta
and its volatility level, we finally decided to use beta of 1.18
from FactSet.
Sensitivity Analysis
We understand that the assumptions we made in out models
will have different levels of impact on the intrinsic value. It
is hard to accurately predict the future stock price.
Therefore, we develop a sensitivity analysis to analyze those
key assumptions’ impact on our intrinsic value under
different scenarios, including the best case, the worst case
and the realistic case. We put the target price in the top-left
corner in the data table. Since we are most confident in our
Discounted Cash Flow model, we use the partial year
adjusted price from the Discount Cash Flow model in this
sensitivity analysis.
Beta & CV Growth
The first sensitivity analysis tests the impact of beta and
continuing value of growth on price. Beta is an important
element in terms of calculating cost of equity. The
continuing value of the growth rate is also essential in the
calculation of both DCF and DDM models. Increase in beta
will lower the price. When the beta increased from 1.18 to
1.23 by +0.05, the price decreased $2.57. Compared to beta,
continuing value of growth has less impact on price. For
instance, +0.05 increase in continuing value of growth will
only rise $0.31 of the price. Beta measures a stock’s
volatility, the degree to which its price fluctuates in relation
to the S&P 500.xli Therefore, if the S&P 500 index and
Wells Fargo is doing well, the beta will decrease, and vice
versa.
CV ROE & CV Growth
The second sensitivity analysis evaluates the impact of
continuing value of Return on Equity and continuing value
of growth on Price. Return on Equity is an essential factor
for financial company because it measures financial
companies’ profitability and it is one of the key assumptions
in the DDM model. Both the continuing value of growth
and the continuing value of ROE have a slight influence on
price.
10. Page 10
(A 0.25% increase will result in a less than $0.30 change in
price.) Return on Equity is calculated by the net income
divided by shareholders’ equity. Therefore, if Wells Fargo
continues to have growth in its net income and continues to
manage its stock buyback and dividend payout programs
appropriately, its ROE can grow in a stable rate.
CV ROE & Cost of Equity
We also test the effect of the cost of equity and continuing
value of ROE on price. Cost of equity is a crucial factor in
calculating of DDM and DCF/EP model. As we expected,
cost of equity has significant influence on price. A 0.25
increase in cost of equity from 8.53% to 8.78% can lower
price by $2.91. The cost of equity is calculated by using the
CAPM, therefore, it is important for the company to manage
their risk and reduce its volatility. The overall well-being of
the economy and government’s Q1 policies will influence
the risk-free rate, and then influence the cost of equity’s
value in our model.
CV Growth of Real estate 1-4 family first mortgage
interest rate & CV Growth of Real estate 1-4 family first
mortgage
In the fourth sensitivity analysis, we test continuing value of
growth of Real estate 1-4 family mortgage and its interest
rate. Consumer loans count for about 30% of Wells Fargo’s
total assets. Real estate 1-4 family mortgage has the largest
proportion in consumer loans. Therefore, we think it is
important to test the impact of Real estate 1-4 family
mortgage on price. As we expected, change in interest rate
significantly influences the price. For example, +0.50%
increase(from 3.50% to 4.00%) in continuing value growth
of real estate 1-4 family first mortgage interest rate will
result a positive change in price by $2.64. The U.S. housing
market is slowing recovery from the subprime mortgage
crisis.
During the past 3 years, the strict government regulation and
rising interest rates have limited the growth of the housing
market. With the economy’s recovery, we believe the
government regulation will slowly ease in the next 5 years.
We expect the demand for real estate mortgages to increase
in the next 5 years as a result of increasing in jobs and
income. The real estate 1-4 family mortgage interest rate
will increase along with the increase in mortgage demand.
CV Growth of Commercial & Industrial interest rate &
CV Growth of Commercial & Industrial
Lastly, we evaluate the impact of a continuing value of
growth of commercial & industrial and its interest rate. Total
commercial loans weighs about 25% of Wells Fargo’s
total assets. More than half proportion of total commercial
loans is commercial & industrial. Therefore, it
is important to evaluate commercial & industrial loans. As
the test result shows above, the change in continuing growth
of commercial & industrial balance slightly influences price
(+0.25% change from 4.00% to 4.25% results only
$0.02 change in price). Compared to growth in commercial
& industrial loan’s balance, growth in the interest rate of the
commercial & industrial loans has a stronger impact on the
price (+0.25% change from 3.00% to 3.25% results nearly
$1 change in price). We predict that the demand of
commercial and industrial loans will increase during the
following 3 to 5 years as a result of strong performance of
the economy and the market. Therefore, the growth in
demand in commercial and industrial loans will boost its
interest rate to 3.75% in 2014. Based on the sensitivity
analysis, it is important for Wells Fargo to make and
manage its interest rates on loans because change in those
interest rates will largely influence its price performance.
11. Important Disclaimer
This report was created by students enrolled in the Security
Analysis (6F:112) class at the University of Iowa. The report
was originally created to offer an internal investment
recommendation for the University of Iowa Krause Fund and
its advisory board. The report also provides potential
employers and other interested parties an example of the
students’ skills, knowledge and abilities. Members of the
Krause Fund are not registered investment advisors, brokers
or officially licensed financial professionals. The investment
advice contained in this report does not represent an offer or
solicitation to buy or sell any of the securities mentioned.
Unless otherwise noted, facts and figures included in this
report are from publicly available sources. This report is not
a complete compilation of data, and its accuracy is not
guaranteed. From time to time, the University of Iowa, its
faculty, staff, students, or the Krause Fund may hold a
financial interest in the companies mentioned in this report.
Page 11
i Wells Fargo & Company (2013). From 10-K 2013, Page 1.
Retrieved from
<https://www08.wellsfargomedia.com/downloads/pdf/invest
_relations/2013_10K.pdf>
ii FactSet Research Systems. (n.d.). Wells Fargo & Company,
Retrieved November 18, 2014, from FactSet database.
iii October 2014 Real Estate Data. (2014, November 13).
Retrieved November 18, 2014, from
<http://www.realtor.com/data-portal/realestatestatistics>
iv Yahoo! Finance. Retrieved November 18, 2014, from
<http://finance.yahoo.com/echarts?s=WFC+Interactive#%7B
%22range%22%3A%221y%22%2C%22scale%22%3A%22l
inear%22%7D>
v Pritzker, P., Doms, M., & Moyer, B. (2014, October 1).
Measuring the Economy-A Primer on GDP and the National
Income and Product Accounts. Retrieved November 18,
2014, from
<http://www.bea.gov/national/pdf/nipa_primer.pdf>
vi Economic Projections of Federal Reserve Board Members
and Federal Reserve Bank Presidents, June 2014. (2014, June
18). Retrieved November 18, 2014, from
<http://www.federalreserve.gov/monetarypolicy/files/fomcpr
ojtabl20140618.pdf>
vii Economic Projections of Federal Reserve Board Members
and Federal Reserve Bank Presidents, June 2014. (2014, June
18). Retrieved November 18, 2014, from
<http://www.federalreserve.gov/monetarypolicy/files/fomcpr
ojtabl20140618.pdf>
viii Unemployment rate down to 6.1 percent in June: The
Economics Daily: U.S. Bureau of Labor Statistics. (2014,
July 8). Retrieved November 18, 2014, from
<http://www.bls.gov/opub/ted/2014/ted_20140708.htm#tab-
1>
ix Unemployment rate down to 6.1 percent in June: The
Economics Daily: U.S. Bureau of Labor Statistics. (2014,
July 8). Retrieved November 18, 2014, from
<http://www.bls.gov/opub/ted/2014/ted_20140708.htm#tab-
1>
x Bloomberg L.P. (2014) CONCCONF Index 01/01/13 to
11/1/14. Retrieved November 18, 2014 from Bloomberg
database
xi FactSet Research Systems. (n.d.). Wells Fargo &
Company, Retrieved November 18, 2014, from FactSet
database.
xii 30-Year Fixed-Rate Mortgages since 1971. (n.d.).
Retrieved November 18, 2014, from
<http://www.freddiemac.com/pmms/pmms30.htm>
xiii Press Release. (2014, November 13). Retrieved November
18, 2014, from
<http://www.federalreserve.gov/newsevents/press/bcreg/201
41113a.htm>
xiv Press Release. (2014, November 13). Retrieved November
18, 2014, from
<http://www.federalreserve.gov/newsevents/press/bcreg/201
41113a.htm>
xv Current FAQsInforming the public about the Federal
Reserve. (2014, November 3). Retrieved November 18,
2014, from
<http://www.federalreserve.gov/faqs/money_12849.htm>
xvi Wells Fargo & Company, Annual Company –Run Stress
Test Results. (2014, March 20). Retrieved November 18,
2014, from
<https://www08.wellsfargomedia.com/downloads/pdf/invest
_relations/stress-test-results-2014.pdf>
xvii Touryalai, H. (2014, March 20). Stress Test Results:
Big Banks Look Healthier As 29 of 30 Pass, Zions Fails.
Retrieved November 18, 2014, from
<http://www.forbes.com/sites/halahtouryalai/2014/03/20
/stress-test-results-big-banks-look-healthier-as-29-of-30-
pass-zion-fails/>
xviii Gandel, S. (2014, March 26). Citi and four other banks
stumble in Fed stress tests. Retrieved November 18, 2014,
from <http://fortune.com/2014/03/26/citi-and-four-other-banks-
stumble-in-fed-stress-tests/?
utm_content=buffer38fa8&utm_medium=social&utm_
source=facebook.com&utm_campaign=buffer/>
12. Page 12
xix Touryalai, H. (2014, March 20). Stress Test Results:
Big Banks Look Healthier As 29 of 30 Pass, Zions Fails.
Retrieved November 18, 2014, from
<http://www.forbes.com/sites/halahtouryalai/2014/03/20
/stress-test-results-big-banks-look-healthier-as-29-of-30-
pass-zion-fails/>
xx Monica, P. (2014, March 20). Warren Buffett's favorite
bank -- Wells Fargo -- isn't like the others - The Buzz -
Investment and Stock Market News. Retrieved November
18, 2014, from
<http://buzz.money.cnn.com/2014/05/20/wells-fargo-stock/>
xxi Monica, P. (2014, March 20). Warren Buffett's favorite
bank -- Wells Fargo -- isn't like the others - The Buzz -
Investment and Stock Market News. Retrieved November
18, 2014, from
<http://buzz.money.cnn.com/2014/05/20/wells-fargo-stock/>
xxii Wells Fargo & Company (2013). From 10-K 2013, Page
1.
Retrieved from
<https://www08.wellsfargomedia.com/downloads/pdf/invest
_relations/2013_10K.pdf>
xxiii FactSet Research Systems. (n.d.). Wells Fargo &
Company, Business Description, Retrieved November 18,
2014, from FactSet database.
xxiv Charts & Graphs Archive. (2014, November 1).
Retrieved November 18, 2014, from
<http://www.nilsonreport.com/publication_chart_and_graphs
_archive.php?1=1&year=2014>
xxv FactSet Research Systems. (n.d.). Wells Fargo &
Company, Segments, Retrieved November 18, 2014, from
FactSet database.
xxvi Wells Fargo & Company. (2014). Annual report 2013.
Retrieved from
<https://www08.wellsfargomedia.com/downloads/pdf/invest
_relations/2013-annual-report.pdf>
xxvii Wells Fargo & Company. (2014). Annual report 2013.
Retrieved from
<https://www08.wellsfargomedia.com/downloads/pdf/invest
_relations/2013-annual-report.pdf>
xxviii Wells Fargo Strategy. (1999, January 1). Retrieved
November 18, 2014, from
<https://www.wellsfargo.com/invest_relations/vision_values/
6>
xxix Wells Fargo & Company. (2014). Annual report 2013.
Retrieved from
<https://www08.wellsfargomedia.com/downloads/pdf/invest
_relations/2013-annual-report.pdf>
xxx Wells Fargo & Company. (2014). Annual report 2013.
Page 3. Retrieved from
<https://www08.wellsfargomedia.com/downloads/pdf/invest
_relations/2013-annual-report.pdf>
xxxi Wells Fargo & Company. (2014). Annual report 2013.
Page 44. Retrieved from
<https://www08.wellsfargomedia.com/downloads/pdf/invest
_relations/2013-annual-report.pdf>
xxxii Wells Fargo & Company. (2014). Annual report 2013.
Page 44. Retrieved from
<https://www08.wellsfargomedia.com/downloads/pdf/invest
_relations/2013-annual-report.pdf>
xxxiii FactSet Research Systems. (n.d.). Wells Fargo &
Company, Comparative Statistics, Retrieved November 18,
2014, from FactSet database.
xxxiv Wells Fargo & Company. (2014). Annual report 2013.
Retrieved from
<https://www08.wellsfargomedia.com/downloads/pdf/invest
_relations/2013-annual-report.pdf>
xxxv Bloomberg L.P. (2014) Relative Valuation. Retrieved
November 18, 2014 from Bloomberg database
xxxvi Yahoo! Finance. Retrieved November 18, 2014, from
<http://finance.yahoo.com/echarts?s=WFC+Interactive#%7B
%22range%22%3A%221y%22%2C%22scale%22%3A%22l
inear%22%2C%22comparisons%22%3A%7B%22USB%22
%3A%7B%22color%22%3A%22%23cc0000%22%2C%22
weight%22%3A1%7D%2C%22JPM%22%3A%7B%22color
%22%3A%22%23009999%22%2C%22weight%22%3A1%
7D%2C%22C%22%3A%7B%22color%22%3A%22%23ff0
0ff%22%2C%22weight%22%3A1%7D%2C%22BAC%22%
3A%7B%22color%22%3A%22%239900ff%22%2C%22wei
ght%22%3A1%7D%7D%7D >
xxxvii Stock Price and Dividends. (n.d.). Retrieved November
18, 2014, from
<https://www.wellsfargo.com/invest_relations/dividend>
xxxviii Wells Fargo (WFC) Plans Modest Dividend, Buyback
Increase Following CCAR Results. (2014, March 26).
Retrieved November 18, 2014, from
<http://www.streetinsider.com/Dividend Hike/Wells Fargo
(WFC) Plans Modest Dividend, Buyback Increase Following
CCAR Results/9319992.html>
xxxix Morris, P. (2014, May 27). 1 More Reason Warren
Buffett Owns $23 Billion of Wells Fargo Inc. Retrieved
November 18, 2014, from
<http://www.fool.com/investing/general/2014/05/27/1-more-reason-
warren-buffett-owns-23-billion-of-we.aspx>
13. Page 13
xl Wells Fargo & Company (2013). From 10-K 2013,
Retrieved from
<https://www08.wellsfargomedia.com/downloads/pdf/invest
_relations/2013_10K.pdf>
xli Beta: Measuring a Stock?s Volatility |Growth Stocks and
Beta. (n.d.). Retrieved November 18, 2014, from
<http://www.zacks.com/education/articles.php?id=58>
19. WELLS FARGO & CO.
Historical Cash Flow Statement
Scale in millions
Fiscal Years Ending Dec. 31 2011 2012 2013
Cash Flows from Operating Activities
Net income before noncontrolling interests
16,211
19,368
22,224
Adjustment to reconcile net income to net cash provided by operating activities:
Provision for credit losses
7,899
7,217
2,309
Change in fair value of MSRs (residential) & MHFS carried at fair value (295) (2,307) (3,229)
Depreciation & amortization 2,208 2,807 3,293
Other net losses (gains) 3,273 (3,661) (9,384)
Preferred shares released to ESOP 959 - -
Stock option compensation expense 529 1,698 1,920
Excess tax benefits related to stock option payments (79) (226) (271)
Originations of MHFS (345,099) (483,835) (317,054)
Proceeds from sales of & principal collected on mortgages originated for sale 298,524 421,623 311,431
Originations of LHFS (5) (15) -
Proceeds from sales of and principal collected on LHFS 11,833 9,383 575
Purchases of LHFS
Net change in:
Trading assets
(11,723)
35,149
(7,975)
105,440
(291)
43,638
Loans originated for sale
Deferred income taxes
-
3,573
-
(1,297)
-
4,977
Accrued interest receivable (401) 293 (13)
Accrued interest payable (362) (84) (32)
Other assets, net (11,529) 2,064 4,693
Other accrued expenses & liabilities, net 3,000 (11,953) (7,145)
Net cash flows from operating activities 13,665 58,540 57,641
Cash Flows from Investing Activities
Net change in:
Federal funds sold, securities purchased under resale agreements & other short-term investments 36,270 (92,946) (78,184)
Available-for-sale securities:
Proceeds from sales of securities available-for-sale 23,062 5,210 2,837
Prepayments & maturities of securities available-for-sale 52,618 59,712 50,737
Purchases of securities available for sale (121,235) (64,756) (89,474)
Held-to-maturity securities:
Paydowns & maturities of held-to-maturity securities - - 30
Purchases of held-to-maturity securities - - (5,782)
Nonmarketable equity investments:
Sales proceeds of nonmarketable equity investments - - 2,577
Purchases of nonmarketable equity investments - - (3,273)
Loans:
Loans originated by banking subsidiaries, net of p (35,686) (50,420) (43,744)
Proceeds from sales (including participations) of 6,555 6,811 7,694
Purchases (including participations) of loans (8,878) (9,040) (11,563)
Principal collected on nonbank entities' loans 9,782 25,080 19,955
Loans originated by nonbank entities (7,522) (23,555) (17,311)
Net cash acquired from (paid for) acquisitions (353) (4,322) -
Proceeds from sales foreclosed assets
10,655
9,729
Proceeds from sales of foreclosed assets & short sales
-
-
-
11,021
Net cash from purchases & sales of MSRs (155) 116 407
Other investing activities, net (157) (1,509) 581
Net cash flows from investing activities (35,044) (139,890) (153,492)
Cash Flows from Financing Activities
Net change in:
Deposits 72,128 82,762 76,342
Short term borrowings (6,231) 7,699 (3,390)
Long-term debt:
Proceeds from issuance of long-term debt 11,687 27,695 53,227
Long-term debt repayment (50,555) (28,093) (25,423)
Preferred stock:
Proceeds from issuance of preferred stock
2,501
Redemption of preferred stock
-
Cash dividends - preferred
(844)
1,377
-
(892)
3,145
-
(1,017)
Common stock:
Proceeds from issuance of stock warrants
Proceeds from issuance of common stock
-
1,296
-
2,091
-
2,224
Common stock repurchased (2,416) (3,918) (5,356)
Cash dividends paid on common stock (2,537) (4,565) (5,953)
Common stock warrants repurchased (2) (1) -
Excess tax benefits related to stock option payments
Purchase of Prudential's noncontrolling interest
Net change in noncontrolling interests
79
-
(331)
226
-
(611)
271
-
(296)
Other financing activities, net - - 136
Net cash flows from financing activities 24,775 83,770 93,910
Net change in cash & due from banks 3,396 2,420 (1,941)
Cash & due from banks at beginning of year 16,044 19,440 21,860
Cash & due from banks at end of year 19,440 21,860 19,919
Supplement cash flow disclosures:
Cash paid for interest 7,011 5,245 4,321
Cash paid for income taxes 4,875 8,024 7,132
Page 19
20. WELLS FARGO & CO.
Forecast Cash Flow Statement
Scale in millions
Fiscal Years Ending Dec. 31 2014E 2015E 2016E 2017E 2018E 2019E 2020 CV
Cash Flows from Operating Activities
Net income before noncontrolling interests
Adjustment to reconcile net income to net cash provided by operating activities:
Impairment of mortgage
23,239
(507)
23,760
(866)
24,423
(909)
26,003
(859)
27,748
(898)
29,383
(938)
30,879
(871)
Originations of MHFS
Proceeds from sales of & principal collected on mortgages originated for sale 729 (802) (842) (795) (831) (869) (807)
Trading assets (2,925) (3,287) (3,451) (3,261) (3,408) (3,562) (3,308)
Loans originated for sale (27) (8) (8) (8) (8) (9) (8)
Other assets, net (9,860) (4,810) 253 (4,534) (4,738) (4,951) (4,599)
Other accrued expenses & liabilities, net (1,399) (1,371) (1,344) (1,317) (1,290) (1,265) (1,239)
Net cash flows from operating activities 9,250 12,616 18,122 15,228 16,573 17,790 20,045
Cash Flows from Investing Activities
Net change in:
Federal funds sold, securities purchased under resale agreements & other short-term investments (14,687) (11,256) (11,368) (12,131) (12,714) (11,308) (11,490)
Change in investment securities (12,869) (15,545) (15,522) (15,166) (16,100) (15,280) (14,193)
Change in Premises& equipment, net (291) 86 (257) (264) (51) (273) (281)
Change in Net Loans (33,832) (35,915) (38,122) (37,602) (35,782) (36,062) (37,362)
Net cash flows from investing activities (61,679) (62,629) (65,270) (65,164) (64,647) (62,923) (63,327)
Cash Flows from Financing Activities
Net change in:
Deposits 48,197 50,433 51,033 53,317 55,707 55,194 57,527
Short term borrowings 1,886 1,952 2,020 2,091 2,164 2,240 2,318
Long-term debt: 9,180 9,731 10,315 10,933 11,589 12,285 13,022
Cash paid for preferred stock dividend (989) (989) (989) (989) (989) (989) (989)
Cash paid for dividend (7,278) (8,512) (9,991) (9,957) (9,938) (9,926) (9,923)
Cash paid for repurchase (5,500) (5,200) (4,500) (4,200) (4,000) (4,000) (4,000)
Change in treasury stock (172) (149) (119) (103) (90) (83) (76)
Change in Common stock: 734 1,154 1,209 1,251 1,289 1,322 1,355
Change in Unearned ESOP shares (12) (12) (12) (12) (12) (13) (13)
Purchase of Prudential's noncontrolling interest (346) (346) (346) (346) (346) (346) (346)
Net cash flows from financing activities 45,700 48,061 48,619 51,985 55,374 55,683 58,875
Net change in cash & due from banks (6,729) (1,951) 1,471 2,049 7,300 10,550 15,594
Cash & due from banks at beginning of year 19,919 13,190 11,238 12,709 14,758 22,058 32,609
Cash & due from banks at end of year 13,190 11,238 12,709 14,758 22,058 32,609 48,203
Page 20
21. Page 21
WELLS FARGO & CO.
Weighted Average Cost of Capital (WACC) Estimation
Risk‐free rate
( 30 year U.S. Treasury Bond Rate )
end at 11/18/2014
3.05%
Risk Premium 4.64%
Beta
(FactSet)
1.18
Cost of Equity (CAPM) 8.53%
Key Assumptions of Valuation Model
Ticker Symbol WFC
Current Share Price
Fiscal Year End
53.44
Dec. 31
Beta
Risk‐Free Rate
1.18 FactSet data (3 year)
3.05%
Equity Risk‐Premium 4.64%
CV Growth of NOPLAT 3.00%
Cost of Equity 8.53%
CV ROE 12.27%
Dividend Payout Ratio 2013 25.88%
Dividend Payout Ratio 2014 29.56%
CV Growth of Real estate 1‐4 family first mortgage 4.00%
CV Growth of Real estate 1‐4 family first mortgage interest rate 3.50%
CV Growth of Commercial & Industrial 4.00%
CV Growth of Commercial & Industrial Interest Rate 3.00%
22. WELLS FARGO & CO.
Value Driver Estimation
Scale in millions
Fiscal Years Ending Dec. 31 2011 2012 2013 2014E 2015E 2016E 2017E 2018E 2019E 2020 CV
Net Income 15025 17999 20889 21904 22425 23088 24668 26413 28048 29544
Total Assets 1313867 1422968 1527015 1594555 1665005 1736703 1813375 1895205 1979007 2067522
Total Liabilities 1172180 1264057 1356007 1413870 1474615 1536639 1601664 1669834 1738288 1809916
Equity EP
Beginning Total Stockholders' Equity 127889 141687 158911 171008 180685 190389 200064 211710 225372 240720
ROE 11.75% 12.70% 13.15% 12.81% 12.41% 12.13% 12.33% 12.48% 12.45% 12.27%
Re - Cost of Equity 8.53% 8.53% 8.53% 8.53% 8.53% 8.53% 8.53% 8.53% 8.53% 8.53%
Equity EP 4122 5920 7342 7325 7021 6857 7612 8364 8835 9022
FCFE (Simple Method)
Net income 15025 17999 20889 21904 22425 23088 24668 26413 28048 29544
Less change in total assets 55739 109101 104047 67540 70450 71699 76671 81831 83802 88514
Plus change in total liability 41941 91877 91950 57863 60745 62024 65025 68170 68454 71628
FCFE (simple) 1227 775 8792 12227 12720 13414 13021 12751 12700 12657
Cash from Operations:
Interest income 49412 48391 47089 49893 50519 51287 53428 55736 57938 59873
Less: Interest Expense 6649 5161 4289 4272 4431 4604 4779 4928 5144 5409
Less: Provisions from Credit Losses 7899 7217 2309 2332 2355 2379 2403 2427 2451 2476
Plus: Non‐interest Revenue 38185 42856 40980 43013 45161 47413 49786 52287 54884 57654
Less: Non‐interest Expense 49393 50398 48842 50551 52340 54143 56028 57980 60022 62136
Less: Taxes 7445 9103 10405 12513 12794 13151 14001 14941 15822 16627
Less: Net income attributable to noncontrolling interests 342 471 346 346 346 346 346 346 346 346
Less: The preferred stock dividends 844 898 989 989 989 989 989 989 989 989
Net Income 15025 17999 20889 21904 22425 23088 24668 26413 28048 29544
Cash From Operations 15025 17999 20889 21904 22425 23088 24668 26413 28048 29544
Sources of Cash:
Increase in deposits 72128 82765 76342 48197 50433 51033 53317 55707 55194 57527
Increase in total debt -37939 10109 22327 11066 11683 12335 13024 13754 14525 15340
Increase in accrued expense & other liabilities 7752 -997 -6719 -1399 -1371 -1344 -1317 -1290 -1265 -1239
Source of Cash 41941 91877 91950 57863 60745 62024 65025 68170 68454 71628
Uses of Cash:
Increase in Federal funds sold, securities purchased under
resale agreements & other short-term investments -36270 92946 76480 14687 11256 11368 12131 12714 11308 11490
Increase in trading assets 26400 -20332 5331 2925 3287 3451 3261 3408 3562 3308
Increase in Investment securities 49959 12586 29154 12869 15545 15522 15166 16100 15280 14193
Increase in mortgages held for sale -3406 -1208 -30386 -729 802 842 795 831 869 807
Loans held for sale 1338 110 133 160 168 177 185 193 202 210
Increase in loans held for sale 48 -1228 23 27 8 8 8 8 9 8
Increase in net loans 16014 32255 28783 33832 35915 38122 37602 35782 36062 37362
Cash & due from banks 19440 21860 19919 13190 11238 12709 14758 22058 32608 48202
Increase in cash 3396 2420 -1941 -6729 -1951 1471 2049 7300 10550 15594
Increase in PPE -113 -103 -272 291 -86 257 264 51 273 281
Increase in goodwill 345 522 0 0 0 0 0 0 0 0
Increase in mortgage servicing rights -1875 -1313 4111 507 866 909 859 898 938 871
Increase in other assets 1241 -7444 -7236 9860 4810 -253 4534 4738 4951 4599
Uses of Cash: 55739 109101 104047 67540 70450 71699 76671 81831 83802 88514
FCFE (Formal Method)
Cash From Operations 15025 17999 20889 21904 22425 23088 24668 26413 28048 29544
Plus: Sources of Cash 41941 91877 91950 57863 60745 62024 65025 68170 68454 71628
Less: Uses of Cash 55739 109101 104047 67540 70450 71699 76671 81831 83802 88514
FCFE (formal) 1227 775 8792 12227 12720 13414 13021 12751 12700 12657
Page 22
23. WELLS FARGO & CO.
Discounted Cash Flow (DCF) and Economic Profit (EP) Valuation Models
Key Inputs:
CV Growth 3.00%
CV ROE 12.27%
Cost of Equity 8.53%
Fiscal Years Ending Dec. 31 2014E 2015E 2016E 2017E 2018E 2019E 2020 CV
Page 23
DCF Model
5.33%
Net Income 21904 22425 23088 24668 26413 28048 29544
FCFF 12227 12720 13414 13021 12751 12700 12657
Discount Periods 1 2 3 4 5 6 6
Discount Factor 1.0853 1.1778 1.2782 1.3871 1.5054 1.6337 1.6337
DCF_CV 404006
DCF
Value of Equity
305481
11267 10800 10494 9387 8470 7774 247289
Less: ESOP
Ve
Shares outstanding
Price/share
‐1887
303594
5198.3
Price/Share Today 58.40
EP Model
EP
7325 7021 6857 7612 8364
8835
9022
Discount Periods 1 2 3 4 5 6 6
Discount Factor 1.0853 1.1778 1.2782 1.3871 1.5054 1.6337 1.6337
EP_CV 163286
PV EP
6750 5961 5365 5487 5556 5408 99946
Value of Equity
134473
Begin TSE
Less: ESOP
Ve
171008
‐1887
303594
Shares outstanding
Price/share
5198.3
Price/Share Today 58.40
25. Page 25
WELLS FARGO & CO.
Relative Valuation Models
Ticker
Company
Price
EPS
2014E
EPS
2015E
P/E 14
P/E 15
P/B 14
BAC BANK OF AMERICA Corp $ 17.09 $1.46 $1.49 11.7 11.4 0.82
JPM JPMORGAN CHASE & CO. $ 60.38 $5.51 $5.99 11.0 10.1 1.07
C CITIGROUP Inc $ 53.57 $4.73 $5.40 11.3 9.9 0.80
MS MORGAN STANLEY $ 35.60 $2.73 $2.92 13.0 12.2 1.05
GS GOLDMAN SACHS GROUP Inc $ 189.93 $17.18 $17.27 11.1 11.0 1.18
USB U.S. BANCORP $ 43.80 $3.07 $3.29 14.3 13.3 2.05
WFC WELLS FARGO & CO. $ 53.44 $4.19 $4.33 12.75 12.33 1.69
Implied Value:
Relative P/E (EPS14) $ 50.55
Relative P/E (EPS15)
Relative P/E Average
$ 49.06
$ 49.06
Book Value/Shares 34.76
P/B Multiplier 1.2
Relative P/B $ 40.38
Average 12.1 11.3 1.2
26. Page 26
WELLS FARGO & CO.
Key Management Ratios
Fiscal Years Ending Dec. 31 2011 2012 2013 2014E 2015E 2016E 2017E 2018E 2019E 2020 CV
Liquidity Ratios
Operating CF ratio(Cash Flows from Operations)/Current Liabilities) 0.01 0.05 0.05 0.01 0.01 0.01 0.01 0.01 0.01 0.01
Loan‐to‐deposit Ratio ( Total Loans/ Total Deposits ) 0.84 0.80 0.77 0.76 0.76 0.76 0.76 0.75 0.75 0.74
Financial Leverage Ratios
Debt‐to‐equity Ratio ( Total Liabilities/Shareholders' equity ) 8.27 7.95 7.93 7.83 7.75 7.68 7.57 7.41 7.22 7.03
Interest coverage Ratio(Net Income/Total Interest Expense) 2.39 3.66 5.10 5.36 5.28 5.23 5.37 5.56 5.65 5.64
Equity Ratio (Equity/ Total Assets) 10.67% 11.07% 11.14% 11.28% 11.38% 11.47% 11.63% 11.85% 12.12% 12.42%
Profitability Ratios
Net Profit Margin(Net Income / (Total Interest Income + Total Non‐Interest Income)) 18.12% 20.71% 24.84% 24.64% 24.47% 24.39% 24.86% 25.37% 25.74% 25.98%
Loan Growth (Net Loan Balance, t ‐ Net Loan Balance, t‐1) / Net Loan Balance, t‐1 2.18% 4.30% 3.68% 4.17% 4.25% 4.33% 4.09% 3.74% 3.63% 3.63%
Deposit Growth (Total Deposits, t ‐ Total Deposits, t‐1) / Total Deposits, t‐1 8.51% 9.00% 7.61% 4.47% 4.47% 4.33% 4.34% 4.34% 4.13% 4.13%
Return on Assets(Net Income / Average Total Assets) 1.23% 1.38% 1.48% 1.46% 1.42% 1.40% 1.42% 1.45% 1.47% 1.48%
ROE (Net Income / Beginning of Total Shareholders' equity) 11.75% 12.70% 13.15% 12.81% 12.41% 12.13% 12.33% 12.48% 12.45% 12.27%
Payout Policy Ratios
Dividend Payout Ratio(Dividends Declared Per Share / Earnings Per Share) 17% 26% 30% 33% 38% 43% 40% 38% 35% 34%
Total Payout Ratio (Dividends +Repurchase) /NI 33% 47% 54% 58% 61% 63% 57% 53% 50% 47%
27. Effects of ESOP Exercise and Share Repurchases on Common Stock Balance Sheet Account and Number of Shares Outstanding
Page 27
Number of Options Outstanding (shares): 140,963,693
Average Time to Maturity (years): 3.20
Expected Annual Number of Options Exercised: 44,069,898
Current Average Strike Price: $ 42.82
Cost of Equity: 8.53%
Current Stock Price: $ 53.44
2014E 2015E 2016E 2017E 2018E 2019E 2020 CV
Increase in Shares Outstanding: 44,069,898 44,069,898 44,069,898 44,069,898 44,069,898 44,069,898 44,069,898
Average Strike Price: $ 42.82 $ 42.82 $ 42.82 $ 8.56 $ ‐ $ ‐ $ ‐
Increase in Common Stock Account: 1,887,199,864 1,887,199,864 1,887,199,864 377,439,973 ‐ ‐ ‐
Change in Treasury Stock
5,500,000,000 5,200,000,000 4,500,000,000 4,200,000,000 4,000,000,000 4,000,000,000 4,000,000,000
Expected Price of Repurchased Shares: $ 53.44 $ 58.00 $ 62.94 $ 68.31 $ 74.13 $ 80.45 $ 87.31
Number of Shares Repurchased: 102,919,162 89,661,562 71,496,515 61,488,098 53,959,903 49,721,082 45,815,241
Shares Outstanding (beginning of the year) 5,257,163,000 5,198,313,736 5,152,722,072 5,125,295,455 5,107,877,255 5,097,987,250 5,092,336,066
Plus: Shares Issued Through ESOP 44,069,898 44,069,898 44,069,898 44,069,898 44,069,898 44,069,898 44,069,898
Less: Shares Repurchased in Treasury 102,919,162 89,661,562 71,496,515 61,488,098 53,959,903 49,721,082 45,815,241
Shares Outstanding (end of the year) 5,198,313,736 5,152,722,072 5,125,295,455 5,107,877,255 5,097,987,250 5,092,336,066 5,090,590,723
28. Page 28
VALUATION OF OPTIONS GRANTED IN ESOP
Ticker Symbol WFC
Current Stock Price 53.44
Risk Free Rate 0.10%
Current Dividend Yield 2.68%
Annualized St. Dev. of Stock Returns 18.30%
Average Average B‐S Value
Range of Number Exercise Remaining Option of Options
Outstanding Options of Shares Price Life (yrs) Price Granted
Range 1 140,484,056 42.86 3.20 9.65 $ 1,355,042,790
Range 2 479,637 31.95 2.80 18.12 $ 8,689,785
Total 140,963,693 42.82 3.20 12.84 $ 1,363,732,575