Download to read offline


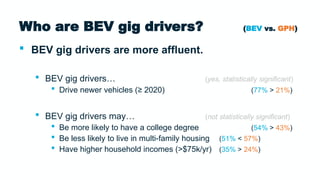
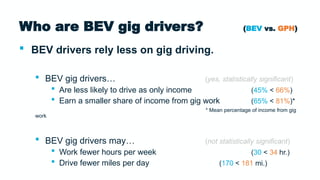
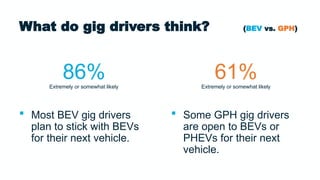
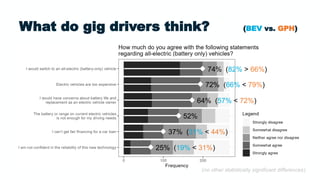
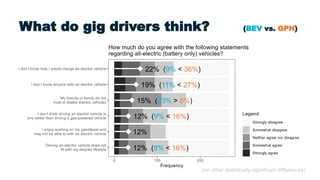
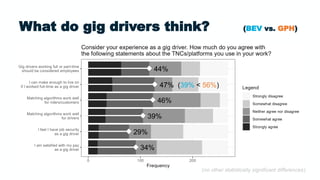


BEV gig drivers exhibit notable differences compared to GPH drivers, including higher affluence, college education, and vehicle age. They also rely less on gig driving as their primary income source and intend to choose BEVs for their next vehicle. Additionally, there is a willingness among some GPH drivers to consider BEVs or PHEVs for future vehicle purchases.


