Download as PDF, PPTX

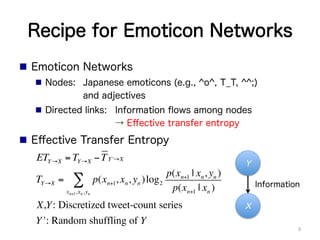
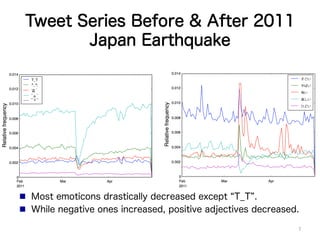
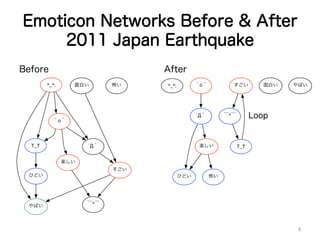

This document proposes using emoticon networks to explore collective mood in social media. Emoticon networks visualize information flows between Japanese emoticons and adjectives in tweets. Analysis found that before a 2011 earthquake, emoticon networks showed subsequent chains of positive and negative events, while after the earthquake they showed alternating chains of positive and negative elements. More validation and comparison to other network models is needed.


