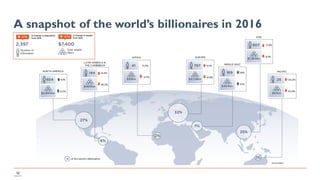
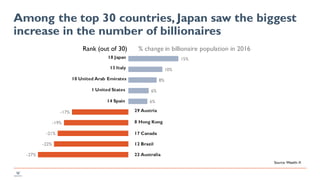
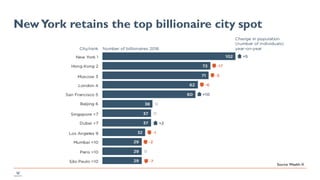
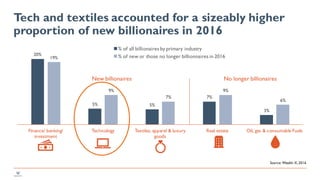
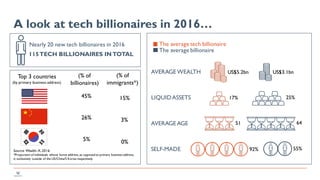
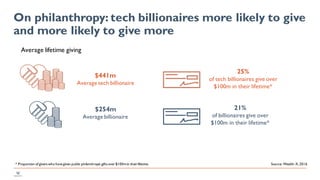
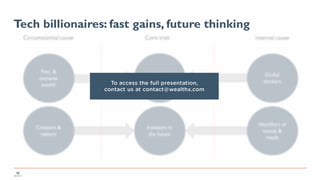
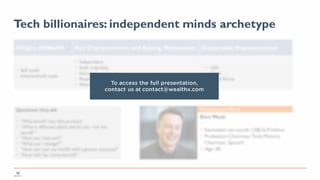
APPLIED WEALTH INTELLIGENCE
TheTech Billionaire
Including insights from theWealth-X Billionaire Census 2017
5 June,2017
Presented byWinston Chesterfield
Director: Wealth-X Custom Research
A snapshot of the world’s billionaires in 2016
Like the general population, wealth distribution is
not evenly spread amongst billionaires
Just over half of all billionaires had a
net worth of less than $2bn, with
95% holding a personal fortune of
between $1bn and $10bn
Among the top 30 countries, Japan saw the biggest
increase in the number of billionaires
-27%
-22%
-21%
-19%
-17%
6%
6%
8%
10%
15%
Rank (out of 30) % change in billionaire population in 2016
18 Japan
13 Italy
10 United Arab Emirates
1 United States
14 Spain
29 Austria
8 Hong Kong
17 Canada
12 Brazil
22 Australia
Source: Wealth-X
NewYork retains the top billionaire city spot
Source: Wealth-X
The volatile nature of
extreme wealth
Change in wealth over 2016
Source: Wealth-X
Changes in billionaires’ portfolios
0%
5%
10%
15%
20%
25%
30%
35%
40%
45%
50%
Private holdings Public holdings Liquid assets Real estate and luxury assets
Year-on-year asset allocation
2015 2016
Source: Wealth-X
The average person who became a billionaire in
2016…
Married
Male
92%
Almost half of
wealth is in
private holdings
Source: Wealth-X
Note: Circles only in orange indicate that new billionaires
are similar to the general billionaire population.
Average net
worth
US$1.7
bn
US$3.1
bn
Average
age
5464
Self-made
wealth
62%55%
The average billionaire
The average person to
become a billionaire in
2016
Tech and textiles accounted for a sizeably higher
proportion of new billionaires in 2016
20%
5% 5%
7%
3%
19%
9%
7%
9%
6%
Finance/ banking/
investment
Technology Textiles, apparel & luxury
goods
Real estate Oil, gas & consumable Fuels
% of all billionaires by primary industry
% of new or those no longer billionnaires in 2016
Source: Wealth-X,2016
New billionaires No longer billionaires
Yan Wu
Chairwoman of Hakim Unique Internet
Source of wealth:Self-made
Primary residence:Zhejiang, China
Married
Net worth:$1.1bn
Source: Wealth-X
The rising
importance of tech
A look at tech billionaires in 2016…
Nearly 20 new tech billionaires in 2016
115TECH BILLIONAIRES IN TOTAL
45%
26%
5%
US$5.2bn
17%
92%
US$3.1bn
25%
55%
AVERAGE WEALTH
LIQUIDASSETS
AVERAGE AGE
SELF-MADE
Top 3 countries
(by primary business address)
Source: Wealth-X,2016
*Proportion of individuals whose home address, as opposed to primary business address,
is exclusively outside of the US/China/S Korea respectively
51 64
The average billionaire
The average tech billionaire
(% of
immigrants*)
(% of
billionaires)
15%
3%
0%
On philanthropy: tech billionaires more likely to give
and more likely to give more
Average lifetime giving
$441m
Average tech billionaire
$254m
Average billionaire
25%
of tech billionaires give over
$100m in their lifetime*
21%
of billionaires give over
$100m in their lifetime*
Source: Wealth-X,2016* Proportion of givers who have given public philanthropic gifts over$100min theirlifetime
Tech billionaire:
archetype
Tech billionaires: fast gains, future thinking
WEALTH-X
To access the full presentation,
contact us at contact@wealthx.com
Leading trait: modern day Howard Hughes
WEALTH-X
To access the full presentation,
contact us at contact@wealthx.com
Tech billionaires: independent minds archetype
WEALTH-X
To access the full presentation,
contact us at contact@wealthx.com
Tech billionaires: independent minds archetype
WEALTH-X
To access the full presentation,
contact us at contact@wealthx.com
TO DISCUSS OUR UNIQUE SERVICES,
PLEASE CONTACT:
APPLIED WEALTH INTELLIGENCE
contact@wealthx.com
+1 877 887 8454

Wealth-X - The Tech Billionaire

  • 1.
    APPLIED WEALTH INTELLIGENCE TheTechBillionaire Including insights from theWealth-X Billionaire Census 2017 5 June,2017 Presented byWinston Chesterfield Director: Wealth-X Custom Research
  • 2.
    A snapshot ofthe world’s billionaires in 2016
  • 3.
    Like the generalpopulation, wealth distribution is not evenly spread amongst billionaires Just over half of all billionaires had a net worth of less than $2bn, with 95% holding a personal fortune of between $1bn and $10bn
  • 4.
    Among the top30 countries, Japan saw the biggest increase in the number of billionaires -27% -22% -21% -19% -17% 6% 6% 8% 10% 15% Rank (out of 30) % change in billionaire population in 2016 18 Japan 13 Italy 10 United Arab Emirates 1 United States 14 Spain 29 Austria 8 Hong Kong 17 Canada 12 Brazil 22 Australia Source: Wealth-X
  • 5.
    NewYork retains thetop billionaire city spot Source: Wealth-X
  • 6.
    The volatile natureof extreme wealth
  • 7.
    Change in wealthover 2016 Source: Wealth-X
  • 8.
    Changes in billionaires’portfolios 0% 5% 10% 15% 20% 25% 30% 35% 40% 45% 50% Private holdings Public holdings Liquid assets Real estate and luxury assets Year-on-year asset allocation 2015 2016 Source: Wealth-X
  • 9.
    The average personwho became a billionaire in 2016… Married Male 92% Almost half of wealth is in private holdings Source: Wealth-X Note: Circles only in orange indicate that new billionaires are similar to the general billionaire population. Average net worth US$1.7 bn US$3.1 bn Average age 5464 Self-made wealth 62%55% The average billionaire The average person to become a billionaire in 2016
  • 10.
    Tech and textilesaccounted for a sizeably higher proportion of new billionaires in 2016 20% 5% 5% 7% 3% 19% 9% 7% 9% 6% Finance/ banking/ investment Technology Textiles, apparel & luxury goods Real estate Oil, gas & consumable Fuels % of all billionaires by primary industry % of new or those no longer billionnaires in 2016 Source: Wealth-X,2016 New billionaires No longer billionaires
  • 11.
    Yan Wu Chairwoman ofHakim Unique Internet Source of wealth:Self-made Primary residence:Zhejiang, China Married Net worth:$1.1bn Source: Wealth-X
  • 12.
  • 13.
    A look attech billionaires in 2016… Nearly 20 new tech billionaires in 2016 115TECH BILLIONAIRES IN TOTAL 45% 26% 5% US$5.2bn 17% 92% US$3.1bn 25% 55% AVERAGE WEALTH LIQUIDASSETS AVERAGE AGE SELF-MADE Top 3 countries (by primary business address) Source: Wealth-X,2016 *Proportion of individuals whose home address, as opposed to primary business address, is exclusively outside of the US/China/S Korea respectively 51 64 The average billionaire The average tech billionaire (% of immigrants*) (% of billionaires) 15% 3% 0%
  • 14.
    On philanthropy: techbillionaires more likely to give and more likely to give more Average lifetime giving $441m Average tech billionaire $254m Average billionaire 25% of tech billionaires give over $100m in their lifetime* 21% of billionaires give over $100m in their lifetime* Source: Wealth-X,2016* Proportion of givers who have given public philanthropic gifts over$100min theirlifetime
  • 15.
  • 16.
    Tech billionaires: fastgains, future thinking WEALTH-X To access the full presentation, contact us at contact@wealthx.com
  • 17.
    Leading trait: modernday Howard Hughes WEALTH-X To access the full presentation, contact us at contact@wealthx.com
  • 18.
    Tech billionaires: independentminds archetype WEALTH-X To access the full presentation, contact us at contact@wealthx.com
  • 19.
    Tech billionaires: independentminds archetype WEALTH-X To access the full presentation, contact us at contact@wealthx.com
  • 20.
    TO DISCUSS OURUNIQUE SERVICES, PLEASE CONTACT: APPLIED WEALTH INTELLIGENCE contact@wealthx.com +1 877 887 8454