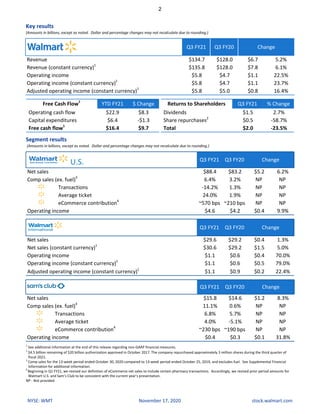
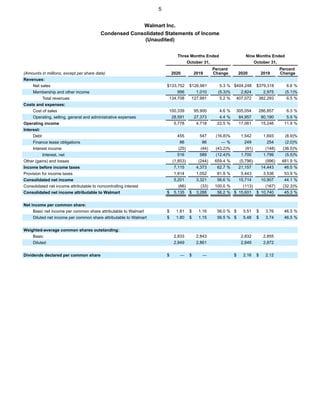
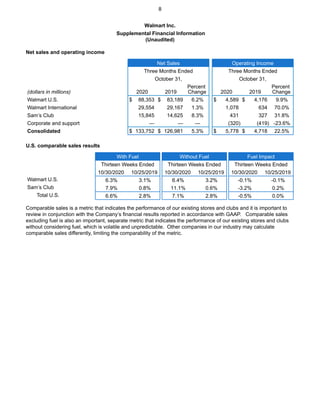
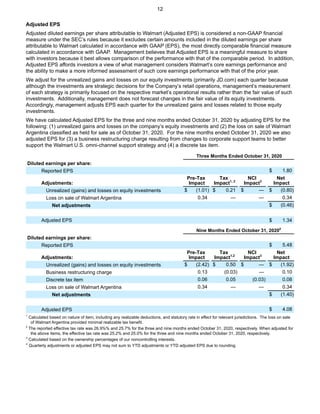
- Walmart reported strong financial results for Q3 FY21, with total revenue increasing 5.2% to $134.7 billion and adjusted EPS of $1.34.
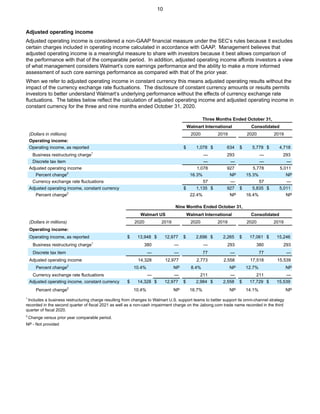
- Comp sales grew 6.4% at Walmart U.S. and eCommerce sales increased 79%, while Sam's Club comp sales rose 11.1% with eCommerce up 41%.
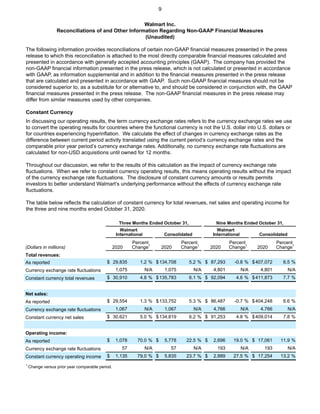
- International sales increased 1.3% to $29.6 billion (5% excluding currency effects), led by growth in Flipkart, Canada and Walmex.
Walmart reported record annual revenue of nearly $560 billion for fiscal year 2021, representing growth of $35 billion from the previous year. Quarterly revenue was also up, reaching $152.1 billion which was a 7.3% increase. Walmart U.S. saw comp sales growth of 8.6% for the quarter and 79% growth in eCommerce sales for the year. Looking ahead, Walmart expects consolidated net sales to decline in fiscal 2022 due to planned divestitures, but excluding divestitures sales are forecast to increase by low single digits with operating income expected to be flat to up slightly.
- Walmart reported quarterly earnings results for Q2 FY20, with US comp sales up 2.8% and e-commerce sales up 37%. Overall revenue was $130.4 billion, up 1.8% year-over-year.
- Operating income was $5.6 billion, down 2.9% due to inclusion of Flipkart, but better than expected.
- For fiscal 2020, Walmart raised guidance and now expects US comp sales growth towards the upper end of +2.5-3%, adjusted EPS to be slightly down or up, and continued strength in the US.
Walmart reported its financial results for the fourth quarter and full fiscal year 2020. For Q4, total revenue increased 2.1% to $141.7 billion while operating income decreased 12.3% to $5.3 billion. Walmart U.S. comp sales grew 1.9% and ecommerce sales increased 35%. For the full fiscal year, total revenue increased 1.9% to $524 billion and operating income decreased 6.3% to $20.6 billion. Walmart also provided guidance for fiscal year 2021, forecasting net sales growth of approximately 3% and EPS growth between 1.5-4.5% to $5.00-$5.15.
- Walmart reported financial results for the first quarter of fiscal year 2022, with net sales of $138.3 billion, up 2.7% from the prior year. Operating income increased 32.3% to $6.9 billion.
- Walmart U.S. comp sales grew 6.0% and eCommerce sales increased 37%. Operating income increased 26.8%. Sam's Club comp sales increased 7.2% and eCommerce sales grew 47%.
- Based on the strong first quarter results, Walmart raised its guidance for the second quarter and full fiscal year 2022, expecting continued growth in operating income and earnings per share.
- Walmart reported strong Q2 2021 results, with US comp sales up 9.3% and e-commerce sales up 97%. Operating income increased 8.5% to $6.1 billion.
- The company incurred $1.5 billion in additional COVID-19 related costs but saw higher demand and margins in general merchandise categories.
- All operating segments saw sales growth, with the US seeing a 9.5% increase in net sales and Sam's Club an 8.8% increase, while International sales fell 6.8% due to currency impacts.
Walmart's Q1 sales increased nearly 9% to $134.6 billion due to strong demand during the COVID-19 pandemic. Ecommerce sales grew 74% in the US and 40% for Sam's Club. Operating income rose 6% to $5.2 billion despite $900 million in additional pandemic-related costs. The company withdrew its full-year guidance due to uncertainty around the pandemic's impact and economic stimulus measures.
Walmart reported financial results for the third quarter of fiscal year 2020.
- Walmart U.S. comparable sales grew 3.2% and e-commerce sales grew 41%, while operating income increased 6.1%
- Total revenue was $128.0 billion, an increase of 2.5% compared to the prior year. Excluding currency effects, revenue increased 3.3%
- For fiscal year 2020, Walmart raised its expectations and now expects adjusted earnings per share to increase slightly compared to the prior year.
- Sales increased 3.3% to a record $2.269 billion in 3Q08 and 2.1% to a record $6.280 billion in the first nine months.
- EPS was $1.50 in 3Q08, above the guidance range, and $3.57 in the first nine months.
- Guidance for 4Q08 EPS is $0.40 to $0.60 and the full year guidance is raised to $3.97 to $4.17 per share.
P&G Delivers 17% EPS Growth - Raises Fiscal Year Outlook finance3
Procter & Gamble reported strong quarterly results with 8% sales growth and 17% earnings per share growth. Sales increased for major brands like Gillette, Tide, and Pantene. The company raised its full year sales and earnings guidance due to the solid quarterly performance and positive business outlook. Operating margins also improved during the quarter behind gross margin expansion and cost savings.
P&G Delivers Double-Digit Sales Growth in First Quarterfinance3
P&G reported double-digit sales growth in the first quarter, exceeding Wall Street earnings estimates. Unit volume grew 13% driven by double-digit growth in fabric and home care and health care. Net sales increased 11% to $10.8 billion. Core earnings per share grew 17% to $1.12 per share, beating consensus estimates by two cents. The company expects high single-digit volume growth and mid to upper single-digit sales growth in the second quarter. For the fiscal year, sales growth of 4-6% and double-digit earnings per share growth are expected.
Wal Mart Store Financial ResultsFebruary 03/07/08finance1
Wal-Mart reported an 8.9% increase in total net sales for the four-week period ending February 29, 2008 compared to the same period the previous year. Comparable store sales increased 2.6% in the US and international sales increased 19.8%. Strength was seen in grocery, health and wellness, and entertainment categories in the US. The company estimates comparable store sales in the US to be flat to up 2% for the upcoming five-week period.
Yum! Brands provides guidance for full-year 2009, projecting earnings per share growth of at least 10% prior to special items. Key growth strategies include opening 1,400 new international restaurants, generating 3% global same-store-sales growth, and achieving industry-leading returns on invested capital. The guidance outlines targets for each of Yum!'s major divisions: China, Yum Restaurants International, and the U.S. business. Yum! expects overall operating profit growth driven by strong performances in China and international markets, while improving returns in the U.S.
Tim Jerzyk, Senior Vice President of Investor Relations/Treasurer at Yum! Brands, provided a detailed guidance update for full-year 2008. Key points included expectations of 12% EPS growth excluding special items and up to 16% including special items. Goals were to build leading brands across China, drive expansion in international markets, improve US brand positions and returns, and deliver industry-leading shareholder and franchisee returns. The guidance also provided financial targets for revenue growth, new restaurant openings, margins, ownership levels, and more for its divisions.
P&G Delivers Second Quarter EPS and Organic Sales in Line with Expectations finance3
- P&G reported diluted net earnings per share of $1.58 for the second quarter, a 61% increase from the previous year, driven by a $0.63 gain from the sale of the Folgers business. Organic sales grew 2% due to price increases and positive product mix while net sales declined 3% from unfavorable foreign exchange and lower volume.
- The CEO acknowledged it was a challenging quarter but said P&G delivered earnings in line with expectations and will continue focusing on innovation, cost management and productivity to drive long-term profitable growth.
- For the fiscal year, P&G expects organic sales growth of 2-5% and earnings per share of $4.29,
Tupperware Brands Corporation reported its first quarter 2009 results. Key highlights include:
- Sales increased 1% in local currency but decreased 15% to $462.8 million due to foreign exchange impacts.
- Diluted earnings per share were $0.41, exceeding guidance of $0.34 to $0.39 through expense management.
- For the second quarter of 2009, sales are expected to increase 2-4% in local currency but decrease 12-14% to $402-412 million due to currency impacts. Diluted EPS is forecasted to be $0.57 to $0.62 excluding items.
P&G Reports Fourth Quarter EPS of $0.92 and Operating Profit Growth of 13%, b...finance3
- P&G reported 4th quarter EPS of $0.92, a 37% increase, and operating profit growth of 13% behind balanced 5% organic sales and volume growth.
- For the fiscal year, net sales increased 9% to $83.5 billion and EPS grew 20% to $3.64, marking the 7th consecutive year of top-line growth meeting or exceeding targets.
- Segment results were mixed, with some like Beauty and Grooming seeing sales growth from new product launches and markets, while others like Health & Well-Being faced commodity cost pressures and market changes.
eBay reported record financial results for Q2 2005, with net revenues of $1.086 billion, up 40% year-over-year. Earnings per share were $0.21, exceeding guidance. Strong momentum in the US and Germany along with growth at PayPal contributed to the results. eBay raised full-year 2005 guidance for net revenues to between $4.34-4.41 billion and earnings per share to between $0.77-0.78.
- Sherwin-Williams reported a 1.5% increase in first quarter sales to a record $1.782 billion and EPS of $0.64, above guidance of $0.56 to $0.61.
- Global Group sales increased 14.8% due to volume gains, price increases, and acquisitions while Paint Stores Group sales declined 1.9% due to soft architectural paint and non-paint sales.
- The company expects Q2 EPS of $1.45 to $1.60 and reaffirms full year 2008 EPS guidance of $4.70 to $4.85, representing a low single digit increase in consolidated sales.
P&G Reports First Quarter EPS of $1.03 Up 12% on 9% Sales Growthfinance3
- P&G reported first quarter net sales growth of 9% to $22 billion and diluted EPS growth of 12% to $1.03 per share.
- Sales growth was led by the Beauty, Fabric Care & Home Care, and Baby Care & Family Care segments.
- The CEO expressed confidence that P&G will continue to deliver long-term growth through leading innovation and productivity despite economic challenges.
P&G Delivers at Top End of Increased Earnings Expectationsfinance3
P&G delivered strong financial results in the October-December quarter, with double-digit growth in unit volume, net sales, and earnings. Unit volume grew 19% overall and 9% excluding acquisitions, with all business segments experiencing growth. Net sales increased 20% to $13.22 billion due to volume growth and a 4% boost from foreign exchange rates. Reported net earnings grew 22% to $1.82 billion, driven by volume growth and manufacturing cost savings enabling marketing investments.
P&G Reports EPS of $0.92, up 16% Behind 8% Sales Growth finance3
P&G reported an 8% increase in quarterly sales to $20.2 billion and a 16% increase in earnings per share to $0.92. Every business segment achieved mid-single digit or higher sales growth led by Fabric & Home Care, Baby & Family Care, and Grooming. EPS growth was primarily due to strong sales growth and a 0.3% improvement in operating margin, excluding a one-time $0.02 per share tax benefit which increased the fiscal year EPS outlook. The company expects to deliver another year of broad growth across businesses and geographies.
- The document is the transcript from 3M's Q1 2006 earnings conference call.
- 3M had strong sales growth of 8.3% in Q1 2006, with all six business segments growing. Operating income grew 18.8%.
- Geographic growth was strong, with Asia Pacific growing 12.0% and Europe growing 7.9% in local currency.
P&G Reports Strong Sales and Earnings Growth, Increases Fiscal Year Outlook finance3
P&G reported strong sales and earnings growth in the first quarter. Net sales increased 27% to $18.79 billion due to growth in both the base P&G business and the addition of Gillette. Organic sales grew 6% and earnings per share increased 3% to $0.79, though EPS growth excluding Gillette dilution was 9-10%. P&G increased its full-year earnings per share outlook due to better cost expectations and expects EPS growth of 13-14% for fiscal year 2007.
eBay reported record quarterly net revenues of $180.9 million for Q2 2001, an 84% increase over the same period last year. Pro forma earnings per share were $0.12. Gross merchandise sales on the platform reached $2.25 billion, up 74% year-over-year. Registered users increased 15% over Q1 2001 to 34.1 million. Based on strong performance, eBay raised its financial guidance for the remainder of 2001, expecting net revenues between $385-400 million and pro forma EPS of $0.21-0.22.
P&G Delivers 15% EPS Growth - Raises Fiscal Year Guidancefinance3
- P&G reported 15% earnings per share growth for the January-March quarter, above analysts' estimates, driven by strong organic sales growth despite a difficult operating environment.
- Net sales increased 10% to $14.29 billion for the quarter, with organic sales growth of 8%, above P&G's target range.
- As a result of the strong results, P&G raised its fiscal year earnings per share guidance range to $2.64 to $2.65.
eBay reported record financial results for the first quarter of 2005, with net revenues of $1.032 billion (up 36% year-over-year). Key metrics like registered users, listings, and gross merchandise volume also grew substantially compared to the prior year. The company exceeded guidance for the quarter. Based on the strong results, eBay raised its financial guidance for 2005, expecting full-year net revenues between $4.27 and $4.36 billion.
Libbey Inc. reported first quarter 2018 earnings. Key highlights included sales increasing 5.2% to $181.9 million driven by new product launches. Adjusted EBITDA increased 91% to $11.9 million compared to the prior year. Management expects full-year adjusted EBITDA margins between 10-11% and net sales to increase low single digits, maintaining the previous 2018 outlook.
- Walmart reported first quarter earnings for fiscal year 2020, with net sales of $123.9 billion, a 1.1% increase from the prior year. Comparable sales in the US grew 3.4% and ecommerce sales grew 37%.
- Operating income was $4.9 billion, a 4.1% decrease. However, operating income in the US grew 5.5% to $4.1 billion, driven by strong comp sales growth.
- International sales declined 4.9% to $28.8 billion due to currency impacts, but grew 1.2% excluding currency. Sam's Club comparable sales increased 0.3% while ecommerce sales grew 28%.
Align Technology announced financial results for Q3 2020 with total revenues increasing 20.9% year-over-year to $734.1 million, Clear Aligner volume growing 28.7% year-over-year to 496.1 thousand cases, and operating income rising 39.3% year-over-year to $177.1 million resulting in an operating margin of 24.1% as the company continued strong growth in Clear Aligners and Imaging Systems.
Walmart reported financial results for Q4 and fiscal year 2014. Q4 EPS was $1.34 and underlying EPS was $1.60. Fiscal year 2014 EPS was $4.85 and underlying EPS was $5.11. Consolidated net sales for fiscal 2014 increased 1.6% to $473.1 billion. The company plans to increase capital expenditures in fiscal 2015 to accelerate the rollout of small format stores in the US, including Neighborhood Markets and Walmart Express stores. For fiscal 2015, the company expects EPS between $5.10-$5.45.
This document brings together a set
of latest data points and publicly
available information relevant for
Healthcare Industry . We are very
excited to share this content and
believe that readers will benefit from
this periodic publication immensely
Walmart and Target reported strong second quarter results driven by increased online sales and improved profitability during the pandemic. The analyst expects this trend to continue in the second half of 2020 and 2021, with elevated online sales and higher margins as consumers limit shopping trips. Store sales may soften in the third quarter as economic uncertainty rises but rebound in the fourth quarter. Underlying profitability and cash flow are improving significantly for the retailers due to higher sales and lower expenses.
This is a brief review of Campbell soup's 10K. It is driven by questions to help you find the most important parts in a 10K report. All the questions are answered.
This document brings together a set of latest data points and publicly available information relevant for Retail & Consumer Goods Industry. We are very excited to share this content and believe that readers will benefit immensely from this periodic publication immensely.
Marketing ROI case for banking & financeMichael Wolfe
Following is a case study showing marketing effectiveness analytics for a banking and financial services firm in the South Central US. A part of the challenge here involved estimating the impact that Hurricane Katrina had on this banks and the measurement of marketing ROI and impact in some new markets. in the end,. as is true for the banking sector, actual ROI of marketing is quite high and there are substantial opportunities for accelerate revenue growth with more effective marketing spend.
Target's and Walmart's and what's happening to the retailthomas paulson
Walmart and Target's second quarter results showed improving profitability and cash generation for mega-discounters. Walmart and Target gained market share profitably while other retailers lost sales and profitability. Strong safety protocols implemented during COVID-19 helped boost customer loyalty and repeat visits. Trip consolidation increased significantly during the quarter, benefiting Walmart and Target and leaving other retailers behind. Looking ahead, underlying profit growth at Walmart is expected to continue in the second half of 2020, driven by expense leverage and lower online losses. However, store sales may soften due to economic uncertainty while digital sales growth remains robust.
Walmart has grown significantly since its founding in 1962. In fiscal year 2012, Walmart saw a 5.9% increase in net sales to $443.9 billion. Operating income increased 4% to $26.6 billion and earnings per share increased from $4.18 to $4.54. Walmart remains focused on growth, profitability and reducing expenses. An analysis of Walmart's financials from 2004-2013 shows increasing profitability, strong returns on investment, and overall solid financial performance despite economic challenges. The intrinsic value of Walmart's stock is estimated to be $95.56 per share, above its current market price of $73.51, indicating it may be a good investment.
P&G Delivers Double-Digit Earnings Growth on Strong Top Line Resultsfinance3
- P&G reported strong sales and earnings growth in the third quarter, with sales up 22% and earnings per share up 20%, driven by double-digit organic volume growth across all business segments.
- Net sales increased 22% to $13.03 billion due to a 12% increase in organic volume and 5% benefit from foreign exchange. Earnings per share increased 14% compared to the prior year period excluding restructuring charges.
- For the fourth quarter, P&G expects organic volume growth of around 10% and high teens sales growth, with operating margin declining due to the inclusion of the Wella acquisition.
This document brings together a set of latest data points and publicly available information relevant for Retail & Consumer good. We are very excited to share this content and believe that readers will benefit from this periodic publication immensely.
This document brings together a set of latest data points and publicly available information relevant for Retail and Consumer Goods Industry. We are very excited to share this content and believe that readers will benefit immensely from this periodic publication.
Morgan Stanley reported record first quarter results for 2007, with net income up 70% from the previous year. Revenue was $11 billion, up 29%, driven by record sales and trading in both fixed income and equities. Return on equity was 29.9%, up from 21.3% the previous year. All business segments achieved record or higher results, with institutional securities delivering a 71% rise in pre-tax income on the back of strong fixed income and equities trading.
This document is Wal-Mart's 2004 annual report which provides an overview of the company's performance and initiatives. It discusses Wal-Mart's commitment to providing good jobs and careers for associates through opportunities for skills development, career advancement, and support during difficult times. It profiles several associates who received assistance from Wal-Mart's health benefits during medical crises. The annual report also outlines Wal-Mart's focus areas of building relationships with suppliers, engaging in community support activities, raising customer living standards, delivering good investment returns, and supporting military service members and their families.
This document is Wal-Mart's 2004 annual report which highlights the company's financial performance and discusses initiatives around jobs, community involvement, suppliers, and customers. It features stories about Wal-Mart associates who have benefited from the company's health insurance and career opportunities. The report discusses Wal-Mart's commitment to diversity and communicating its positive impact. The Chairman's letter emphasizes the company's dedication to high standards of conduct and making necessary changes.
P&G Reports 8% Net Sales and 22% EPS Growth in the Fourth Quarter finance3
The Procter & Gamble Company reported 8% net sales growth and 22% earnings per share growth in the fourth quarter. P&G also announced plans to repurchase $24-30 billion of company shares over the next three years through increased share buybacks of $8-10 billion annually. Every business segment grew organic sales for the fiscal year, led by high-single digit growth in blades and razors and fabric and home care. Chairman A.G. Lafley expressed confidence in P&G's strategies and ability to take advantage of growth opportunities.
P&G Reports Strong Sales and EPS Growth -- Increases Fiscal Year Outlook finance3
P&G reported strong sales and earnings growth for the third quarter of fiscal year 2007. Net sales increased 8% to $18.69 billion and earnings per share grew 17% to $0.74. Growth was driven by double-digit sales increases in several product categories. The company improved its full-year earnings per share outlook due to the strong quarterly results.
This document provides an overview of General Mills' 2014 annual report. It discusses financial highlights for 2014 including a 1% increase in net sales to $17.9 billion and a 4% increase in adjusted diluted EPS to $2.82. The Chairman's letter discusses priorities for 2015 including accelerating sales growth by focusing on key consumer groups and product categories that are growing. The report provides information on General Mills' business segments, board of directors, and sales trends for various product categories including Big G Cereal.
General Mills' annual report summarizes its financial performance in fiscal year 2012. Key points include:
- Net sales grew 12% to $16.7 billion, with international sales up 45% due to the Yoplait yogurt acquisition.
- Segment operating profit rose 2% to over $3 billion.
- Adjusted diluted EPS grew 3% to $2.56, excluding one-time items.
- The company aims to continue balanced growth across core and emerging markets through established and new brands.
Brian Fitzsimmons on the Business Strategy and Content Flywheel of Barstool S...Neil Horowitz
On episode 272 of the Digital and Social Media Sports Podcast, Neil chatted with Brian Fitzsimmons, Director of Licensing and Business Development for Barstool Sports.
What follows is a collection of snippets from the podcast. To hear the full interview and more, check out the podcast on all podcast platforms and at www.dsmsports.net
Unveiling the Dynamic Personalities, Key Dates, and Horoscope Insights: Gemin...my Pandit
Explore the fascinating world of the Gemini Zodiac Sign. Discover the unique personality traits, key dates, and horoscope insights of Gemini individuals. Learn how their sociable, communicative nature and boundless curiosity make them the dynamic explorers of the zodiac. Dive into the duality of the Gemini sign and understand their intellectual and adventurous spirit.
NIMA2024 | De toegevoegde waarde van DEI en ESG in campagnes | Nathalie Lam |...BBPMedia1
Nathalie zal delen hoe DEI en ESG een fundamentele rol kunnen spelen in je merkstrategie en je de juiste aansluiting kan creëren met je doelgroep. Door middel van voorbeelden en simpele handvatten toont ze hoe dit in jouw organisatie toegepast kan worden.
The APCO Geopolitical Radar - Q3 2024 The Global Operating Environment for Bu...APCO
The Radar reflects input from APCO’s teams located around the world. It distils a host of interconnected events and trends into insights to inform operational and strategic decisions. Issues covered in this edition include:
Zodiac Signs and Food Preferences_ What Your Sign Says About Your Tastemy Pandit
Know what your zodiac sign says about your taste in food! Explore how the 12 zodiac signs influence your culinary preferences with insights from MyPandit. Dive into astrology and flavors!
Dive into this presentation and learn about the ways in which you can buy an engagement ring. This guide will help you choose the perfect engagement rings for women.
IMPACT Silver is a pure silver zinc producer with over $260 million in revenue since 2008 and a large 100% owned 210km Mexico land package - 2024 catalysts includes new 14% grade zinc Plomosas mine and 20,000m of fully funded exploration drilling.
4 Benefits of Partnering with an OnlyFans Agency for Content Creators.pdfonlyfansmanagedau
In the competitive world of content creation, standing out and maximising revenue on platforms like OnlyFans can be challenging. This is where partnering with an OnlyFans agency can make a significant difference. Here are five key benefits for content creators considering this option:
The Genesis of BriansClub.cm Famous Dark WEb PlatformSabaaSudozai
BriansClub.cm, a famous platform on the dark web, has become one of the most infamous carding marketplaces, specializing in the sale of stolen credit card data.
Garments ERP Software in Bangladesh _ Pridesys IT Ltd.pdfPridesys IT Ltd.
Pridesys Garments ERP is one of the leading ERP solution provider, especially for Garments industries which is integrated with
different modules that cover all the aspects of your Garments Business. This solution supports multi-currency and multi-location
based operations. It aims at keeping track of all the activities including receiving an order from buyer, costing of order, resource
planning, procurement of raw materials, production management, inventory management, import-export process, order
reconciliation process etc. It’s also integrated with other modules of Pridesys ERP including finance, accounts, HR, supply-chain etc.
With this automated solution you can easily track your business activities and entire operations of your garments manufacturing
proces
Digital Marketing with a Focus on Sustainabilitysssourabhsharma
Digital Marketing best practices including influencer marketing, content creators, and omnichannel marketing for Sustainable Brands at the Sustainable Cosmetics Summit 2024 in New York
Navigating the world of forex trading can be challenging, especially for beginners. To help you make an informed decision, we have comprehensively compared the best forex brokers in India for 2024. This article, reviewed by Top Forex Brokers Review, will cover featured award winners, the best forex brokers, featured offers, the best copy trading platforms, the best forex brokers for beginners, the best MetaTrader brokers, and recently updated reviews. We will focus on FP Markets, Black Bull, EightCap, IC Markets, and Octa.
❼❷⓿❺❻❷❽❷❼❽ Dpboss Matka Result Satta Matka Guessing Satta Fix jodi Kalyan Final ank Satta Matka Dpbos Final ank Satta Matta Matka 143 Kalyan Matka Guessing Final Matka Final ank Today Matka 420 Satta Batta Satta 143 Kalyan Chart Main Bazar Chart vip Matka Guessing Dpboss 143 Guessing Kalyan night
Cover Story - China's Investment Leader - Dr. Alyce SUmsthrill
In World Expo 2010 Shanghai – the most visited Expo in the World History
https://www.britannica.com/event/Expo-Shanghai-2010
China’s official organizer of the Expo, CCPIT (China Council for the Promotion of International Trade https://en.ccpit.org/) has chosen Dr. Alyce Su as the Cover Person with Cover Story, in the Expo’s official magazine distributed throughout the Expo, showcasing China’s New Generation of Leaders to the World.
Anny Serafina Love - Letter of Recommendation by Kellen Harkins, MS.AnnySerafinaLove
This letter, written by Kellen Harkins, Course Director at Full Sail University, commends Anny Love's exemplary performance in the Video Sharing Platforms class. It highlights her dedication, willingness to challenge herself, and exceptional skills in production, editing, and marketing across various video platforms like YouTube, TikTok, and Instagram.
2. Key results
(Amounts in billions, except as noted. Dollar and percentage changes may not recalculate due to rounding.)
Q3 FY21 Q3 FY20 Change
Revenue $134.7 $128.0 $6.7 5.2%
Revenue (constant currency)1
$135.8 $128.0 $7.8 6.1%
Operating income $5.8 $4.7 $1.1 22.5%
Operating income (constant currency)1
$5.8 $4.7 $1.1 23.7%
Adjusted operating income (constant currency)1
$5.8 $5.0 $0.8 16.4%
Free Cash Flow1
YTD FY21 $ Change Returns to Shareholders Q3 FY21 % Change
Operating cash flow $22.9 $8.3 Dividends $1.5 2.7%
Capital expenditures $6.4 -$1.3 Share repurchases2
$0.5 -58.7%
Free cash flow1
$16.4 $9.7 Total $2.0 -23.5%
Segment results
(Amounts in billions, except as noted. Dollar and percentage changes may not recalculate due to rounding.)
U.S. Q3 FY21 Q3 FY20 Change
Net sales $88.4 $83.2 $5.2 6.2%
Comp sales (ex. fuel)3
6.4% 3.2% NP NP
Transactions -14.2% 1.3% NP NP
Average ticket 24.0% 1.9% NP NP
eCommerce contribution4
~570 bps ~210 bps NP NP
Operating income $4.6 $4.2 $0.4 9.9%
Q3 FY21 Q3 FY20 Change
Net sales $29.6 $29.2 $0.4 1.3%
Net sales (constant currency)1
$30.6 $29.2 $1.5 5.0%
Operating income $1.1 $0.6 $0.4 70.0%
Operating income (constant currency)1
$1.1 $0.6 $0.5 79.0%
Adjusted operating income (constant currency)1
$1.1 $0.9 $0.2 22.4%
Q3 FY21 Q3 FY20 Change
Net sales $15.8 $14.6 $1.2 8.3%
Comp sales (ex. fuel)3
11.1% 0.6% NP NP
Transactions 6.8% 5.7% NP NP
Average ticket 4.0% -5.1% NP NP
eCommerce contribution4
~230 bps ~190 bps NP NP
Operating income $0.4 $0.3 $0.1 31.8%
1
See additional information at the end of this release regarding non-GAAP financial measures.
2
$4.5 billion remaining of $20 billion authorization approved in October 2017. The company repurchased approximately 3 million shares during the third quarter of
fiscal 2021.
3
Comp sales for the 13-week period ended October 30, 2020 compared to 13-week period ended October 25, 2019, and excludes fuel. See Supplemental Financial
Information for additional information.
4
Beginning in Q1 FY21, we revised our definition of eCommerce net sales to include certain pharmacy transactions. Accordingly, we revised prior period amounts for
Walmart U.S. and Sam’s Club to be consistent with the current year’s presentation.
NP - Not provided
2
NYSE: WMT November 17, 2020 stock.walmart.com
3. Quarterly Highlights
• Launched Walmart +, a new membership offering with the initial list of benefits of unlimited free delivery, Scan
& Go checkout in stores and discounts on fuel
• Announced a reinvented Black Friday shopping experience called “Black Friday Deals for Days”
• Hosted first-ever virtual Open Call Event for U.S.-manufactured products, as 175 small businesses found an
opportunity with Walmart
• Announced new drone delivery pilots in the U.S. with Zipline, Flytrex and DroneUp
• Announced a pilot with Cruise, an all-electric self-driving car company, to test grocery delivery
• Launched Walmart Insurance Services, LLC, a licensed insurance brokerage, which will assist people with
enrolling in insurance plans
• Opened three new Walmart Health Centers in Newnan, GA, Cartersville, GA and McDonough, GA
• Launched Free Assembly, a modern fashion brand for women and men, found exclusively at Walmart
• Launched Eloquii Elements, a new private brand of everyday fashion for women
• Announced initial rollout of a new store design in the U.S. focused on a digitally-enabled shopping experience
• Launched a team-based operating model in U.S. supercenters to better serve customers and provide associates
with more room for career and pay growth
• Partnered with Goldman Sachs to offer online marketplace sellers access to capital
• Announced the agreement to sell Asda, Walmart’s subsidiary in the U.K., to the Issa brothers and TDR Capital
• Announced the sale of the company’s business in Argentina to Grupo de Narvaez
• Announced the agreement to sell a majority interest in Seiyu, Walmart’s subsidiary in Japan, to KKR and
Rakuten
• Announced additional investment in Ninjacart, India’s innovative startup for supply chain and technology
solutions
• Announced strategic partnership with Flipkart and Aditya Birla Fashion and Retail to enhance the consumer
fashion experience in India
• Announced the acquisition of the intellectual property of mobile gaming startup, Mech Mocha, by Flipkart
• Launched first self-checkout stations for Sam’s Club in Mexico
• Announced collaboration with Sam’s Club and 98point6, a virtual primary care provider, for exclusive telehealth
offerings via text-based app
• Announced partnership with Door Dash to deliver prescriptions from Sam’s Club pharmacies
• Announced expansion of Scan & Go to all Sam’s Club U.S. fuel stations
• Announced ambitious goals targeting zero emissions in Walmart operations by 2040, including harvesting
enough wind, solar and other energy sources to power the company’s own facilities with 100% renewable
energy by 2035
• Named as one of this year’s Forbes JUST 100, a list of companies that strive to benefit all of its stakeholders
About Walmart
Walmart Inc. (NYSE: WMT) helps people around the world save money and live better - anytime and anywhere - in
retail stores, online, and through their mobile devices. Each week, over 265 million customers and members visit
approximately 11,400 stores under 55 banners in 26 countries and eCommerce websites. With fiscal year 2020
revenue of $524 billion, Walmart employs over 2.2 million associates worldwide. Walmart continues to be a
leader in sustainability, corporate philanthropy and employment opportunity. Additional information about
Walmart can be found by visiting https://corporate.walmart.com, on Facebook at https://facebook.com/walmart
and on Twitter at https://twitter.com/walmart.
Investor Relations contact
Dan Binder, CFA (479) 258-7172
Media Relations contact
Randy Hargrove (800) 331-0085
3
NYSE: WMT November 17, 2020 stock.walmart.com
5. Walmart Inc.
Condensed Consolidated Statements of Income
(Unaudited)
Three Months Ended Nine Months Ended
October 31, October 31,
(Amounts in millions, except per share data) 2020 2019
Percent
Change 2020 2019
Percent
Change
Revenues:
Net sales $133,752 $126,981 5.3 % $404,248 $379,318 6.6 %
Membership and other income 956 1,010 (5.3)% 2,824 2,975 (5.1)%
Total revenues 134,708 127,991 5.2 % 407,072 382,293 6.5 %
Costs and expenses:
Cost of sales 100,339 95,900 4.6 % 305,054 286,857 6.3 %
Operating, selling, general and administrative expenses 28,591 27,373 4.4 % 84,957 80,190 5.9 %
Operating income 5,778 4,718 22.5 % 17,061 15,246 11.9 %
Interest:
Debt 455 547 (16.8)% 1,542 1,693 (8.9)%
Finance lease obligations 86 86 — % 249 254 (2.0)%
Interest income (25) (44) (43.2)% (91) (148) (38.5)%
Interest, net 516 589 (12.4)% 1,700 1,799 (5.5)%
Other (gains) and losses (1,853) (244) 659.4 % (5,796) (996) 481.9 %
Income before income taxes 7,115 4,373 62.7 % 21,157 14,443 46.5 %
Provision for income taxes 1,914 1,052 81.9 % 5,443 3,536 53.9 %
Consolidated net income 5,201 3,321 56.6 % 15,714 10,907 44.1 %
Consolidated net income attributable to noncontrolling interest (66) (33) 100.0 % (113) (167) (32.3)%
Consolidated net income attributable to Walmart $ 5,135 $ 3,288 56.2 % $ 15,601 $ 10,740 45.3 %
Net income per common share:
Basic net income per common share attributable to Walmart $ 1.81 $ 1.16 56.0 % $ 5.51 $ 3.76 46.5 %
Diluted net income per common share attributable to Walmart $ 1.80 $ 1.15 56.5 % $ 5.48 $ 3.74 46.5 %
Weighted-average common shares outstanding:
Basic 2,833 2,843 2,832 2,855
Diluted 2,849 2,861 2,849 2,872
Dividends declared per common share $ — $ — $ 2.16 $ 2.12
5
6. Walmart Inc.
Condensed Consolidated Balance Sheets
(Unaudited)
October 31, January 31, October 31,
(Amounts in millions) 2020 2020 2019
ASSETS
Current assets:
Cash and cash equivalents $ 14,325 $ 9,465 $ 8,606
Receivables, net 5,770 6,284 5,612
Inventories 51,842 44,435 51,546
Prepaid expenses and other 1,665 1,622 2,148
Total current assets 73,602 61,806 67,912
Property and equipment, net 102,232 105,208 104,326
Operating lease right-of-use assets 17,128 17,424 16,944
Finance lease right-of-use assets, net 4,929 4,417 4,155
Goodwill 30,236 31,073 30,716
Other long-term assets 22,736 16,567 15,777
Total assets $ 250,863 $ 236,495 $ 239,830
LIABILITIES AND EQUITY
Current liabilities:
Short-term borrowings $ 240 $ 575 $ 4,926
Accounts payable 54,152 46,973 49,750
Dividends payable 1,529 — 1,507
Accrued liabilities 24,995 22,296 20,973
Accrued income taxes 548 280 327
Long-term debt due within one year 4,358 5,362 4,093
Operating lease obligations due within one year 1,725 1,793 1,740
Finance lease obligations due within one year 574 511 468
Total current liabilities 88,121 77,790 83,784
Long-term debt 40,849 43,714 44,912
Long-term operating lease obligations 15,982 16,171 15,741
Long-term finance lease obligations 4,750 4,307 4,068
Deferred income taxes and other 13,657 12,961 13,018
Commitments and contingencies
Equity:
Common stock 283 284 284
Capital in excess of par value 3,485 3,247 3,091
Retained earnings 92,279 83,943 80,656
Accumulated other comprehensive loss (14,616) (12,805) (12,382)
Total Walmart shareholders’ equity 81,431 74,669 71,649
Noncontrolling interest 6,073 6,883 6,658
Total equity 87,504 81,552 78,307
Total liabilities and equity $ 250,863 $ 236,495 $ 239,830
6
7. Walmart Inc.
Condensed Consolidated Statements of Cash Flows
(Unaudited)
Nine Months Ended
October 31,
(Amounts in millions) 2020 2019
Cash flows from operating activities:
Consolidated net income $ 15,714 $ 10,907
Adjustments to reconcile consolidated net income to net cash provided by operating activities:
Depreciation and amortization 8,333 8,159
Unrealized (gains) and losses (6,883) (911)
Losses and (gains) on disposal of business operations 1,028 (1)
Deferred income taxes 1,246 574
Other operating activities 930 938
Changes in certain assets and liabilities, net of effects of acquisitions and dispositions:
Receivables, net 165 661
Inventories (8,260) (7,558)
Accounts payable 8,553 2,925
Accrued liabilities 1,796 (1,107)
Accrued income taxes 258 (48)
Net cash provided by operating activities 22,880 14,539
Cash flows from investing activities:
Payments for property and equipment (6,438) (7,765)
Proceeds from the disposal of property and equipment 99 218
Proceeds from disposal of certain operations 12 833
Payments for business acquisitions, net of cash acquired (180) (56)
Other investing activities — 485
Net cash used in investing activities (6,507) (6,285)
Cash flows from financing activities:
Net change in short-term borrowings (301) (282)
Proceeds from issuance of long-term debt — 5,492
Repayments of long-term debt (4,132) (1,907)
Dividends paid (4,582) (4,545)
Purchase of Company stock (1,186) (4,829)
Dividends paid to noncontrolling interest (76) (407)
Other financing activities (1,063) (735)
Net cash used in financing activities (11,340) (7,213)
Effect of exchange rates on cash, cash equivalents and restricted cash (170) (166)
Net increase in cash, cash equivalents and restricted cash 4,863 875
Cash, cash equivalents and restricted cash at beginning of year 9,515 7,756
Cash, cash equivalents and restricted cash at end of period $ 14,378 $ 8,631
7
8. Walmart Inc.
Supplemental Financial Information
(Unaudited)
Net sales and operating income
Net Sales Operating Income
Three Months Ended Three Months Ended
October 31, October 31,
(dollars in millions) 2020 2019
Percent
Change 2020 2019
Percent
Change
Walmart U.S. $ 88,353 $ 83,189 6.2% $ 4,589 $ 4,176 9.9%
Walmart International 29,554 29,167 1.3% 1,078 634 70.0%
Sam’s Club 15,845 14,625 8.3% 431 327 31.8%
Corporate and support — — — (320) (419) -23.6%
Consolidated $ 133,752 $ 126,981 5.3% $ 5,778 $ 4,718 22.5%
U.S. comparable sales results
With Fuel Without Fuel Fuel Impact
Thirteen Weeks Ended Thirteen Weeks Ended Thirteen Weeks Ended
10/30/2020 10/25/2019 10/30/2020 10/25/2019 10/30/2020 10/25/2019
Walmart U.S. 6.3% 3.1% 6.4% 3.2% -0.1% -0.1%
Sam’s Club 7.9% 0.8% 11.1% 0.6% -3.2% 0.2%
Total U.S. 6.6% 2.8% 7.1% 2.8% -0.5% 0.0%
Comparable sales is a metric that indicates the performance of our existing stores and clubs and it is important to
review in conjunction with the Company’s financial results reported in accordance with GAAP. Comparable sales
excluding fuel is also an important, separate metric that indicates the performance of our existing stores and clubs
without considering fuel, which is volatile and unpredictable. Other companies in our industry may calculate
comparable sales differently, limiting the comparability of the metric.
8
9. Walmart Inc.
Reconciliations of and Other Information Regarding Non-GAAP Financial Measures
(Unaudited)
The following information provides reconciliations of certain non-GAAP financial measures presented in the press
release to which this reconciliation is attached to the most directly comparable financial measures calculated and
presented in accordance with generally accepted accounting principles (GAAP). The company has provided the
non-GAAP financial information presented in the press release, which is not calculated or presented in accordance
with GAAP, as information supplemental and in addition to the financial measures presented in the press release
that are calculated and presented in accordance with GAAP. Such non-GAAP financial measures should not be
considered superior to, as a substitute for or alternative to, and should be considered in conjunction with, the GAAP
financial measures presented in the press release. The non-GAAP financial measures in the press release may
differ from similar measures used by other companies.
Constant Currency
In discussing our operating results, the term currency exchange rates refers to the currency exchange rates we use
to convert the operating results for countries where the functional currency is not the U.S. dollar into U.S. dollars or
for countries experiencing hyperinflation. We calculate the effect of changes in currency exchange rates as the
difference between current period activity translated using the current period’s currency exchange rates and the
comparable prior year period’s currency exchange rates. Additionally, no currency exchange rate fluctuations are
calculated for non-USD acquisitions until owned for 12 months.
Throughout our discussion, we refer to the results of this calculation as the impact of currency exchange rate
fluctuations. When we refer to constant currency operating results, this means operating results without the impact
of the currency exchange rate fluctuations. The disclosure of constant currency amounts or results permits
investors to better understand Walmart’s underlying performance without the effects of currency exchange rate
fluctuations.
The table below reflects the calculation of constant currency for total revenues, net sales and operating income for
the three and nine months ended October 31, 2020.
Three Months Ended October 31, Nine Months Ended October 31,
Walmart
International Consolidated
Walmart
International Consolidated
(Dollars in millions) 2020
Percent
Change1
2020
Percent
Change1
2020
Percent
Change1
2020
Percent
Change1
Total revenues:
As reported $ 29,835 1.2 % $134,708 5.2 % $ 87,293 -0.8 % $407,072 6.5 %
Currency exchange rate fluctuations 1,075 N/A 1,075 N/A 4,801 N/A 4,801 N/A
Constant currency total revenues $ 30,910 4.8 % $135,783 6.1 % $ 92,094 4.6 % $411,873 7.7 %
Net sales:
As reported $ 29,554 1.3 % $133,752 5.3 % $ 86,487 -0.7 % $404,248 6.6 %
Currency exchange rate fluctuations 1,067 N/A 1,067 N/A 4,766 N/A 4,766 N/A
Constant currency net sales $ 30,621 5.0 % $134,819 6.2 % $ 91,253 4.8 % $409,014 7.8 %
Operating income:
As reported $ 1,078 70.0 % $ 5,778 22.5 % $ 2,696 19.0 % $ 17,061 11.9 %
Currency exchange rate fluctuations 57 N/A 57 N/A 193 N/A 193 N/A
Constant currency operating income $ 1,135 79.0 % $ 5,835 23.7 % $ 2,889 27.5 % $ 17,254 13.2 %
1
Change versus prior year comparable period.
9
10. Adjusted operating income
Adjusted operating income is considered a non-GAAP financial measure under the SEC’s rules because it excludes
certain charges included in operating income calculated in accordance with GAAP. Management believes that
adjusted operating income is a meaningful measure to share with investors because it best allows comparison of
the performance with that of the comparable period. In addition, adjusted operating income affords investors a view
of what management considers Walmart’s core earnings performance and the ability to make a more informed
assessment of such core earnings performance as compared with that of the prior year.
When we refer to adjusted operating income in constant currency this means adjusted operating results without the
impact of the currency exchange rate fluctuations. The disclosure of constant currency amounts or results permits
investors to better understand Walmart’s underlying performance without the effects of currency exchange rate
fluctuations. The tables below reflect the calculation of adjusted operating income and adjusted operating income in
constant currency for the three and nine months ended October 31, 2020.
Three Months Ended October 31,
Walmart International Consolidated
(Dollars in millions) 2020 2019 2020 2019
Operating income:
Operating income, as reported $ 1,078 $ 634 $ 5,778 $ 4,718
Business restructuring charge1
— 293 — 293
Discrete tax item — — — —
Adjusted operating income 1,078 927 5,778 5,011
Percent change2
16.3% NP 15.3% NP
Currency exchange rate fluctuations 57 — 57 —
Adjusted operating income, constant currency $ 1,135 $ 927 $ 5,835 $ 5,011
Percent change2
22.4% NP 16.4% NP
Nine Months Ended October 31,
Walmart US Walmart International Consolidated
(Dollars in millions) 2020 2019 2020 2019 2020 2019
Operating income:
Operating income, as reported $ 13,948 $ 12,977 $ 2,696 $ 2,265 $ 17,061 $ 15,246
Business restructuring charge1
380 — — 293 380 293
Discrete tax item — — 77 — 77 —
Adjusted operating income 14,328 12,977 2,773 2,558 17,518 15,539
Percent change2
10.4% NP 8.4% NP 12.7% NP
Currency exchange rate fluctuations — — 211 — 211 —
Adjusted operating income, constant currency $ 14,328 $ 12,977 $ 2,984 $ 2,558 $ 17,729 $ 15,539
Percent change2
10.4% NP 16.7% NP 14.1% NP
1
Includes a business restructuring charge resulting from changes to Walmart U.S. support teams to better support its omni-channel strategy
recorded in the second quarter of fiscal 2021 as well as a non-cash impairment charge on the Jabong.com trade name recorded in the third
quarter of fiscal 2020.
2
Change versus prior year comparable period.
NP - Not provided
10
11. Free Cash Flow
We define free cash flow as net cash provided by operating activities in a period minus payments for property and
equipment made in that period. We had net cash provided by operating activities of $22.9 billion for the nine
months ended October 31, 2020, which increased when compared to $14.5 billion for the nine months ended
October 31, 2019 primarily due to the impact of the global health crisis which accelerated inventory sell-through, as
well as the timing and payment of inventory purchases, incremental COVID-19 related expenses and certain benefit
payments. We generated free cash flow of $16.4 billion for the nine months ended October 31, 2020, which
increased when compared to $6.8 billion for the nine months ended October 31, 2019 due to the same reasons as
the increase in net cash provided by operating activities, as well as $1.3 billion in decreased capital expenditures
due to impacts from the COVID-19 pandemic which impacted the timing of store remodeling and front-end
technology transformation activities in Walmart U.S.
Free cash flow is considered a non-GAAP financial measure. Management believes, however, that free cash flow,
which measures our ability to generate additional cash from our business operations, is an important financial
measure for use in evaluating the company’s financial performance. Free cash flow should be considered in
addition to, rather than as a substitute for, consolidated net income as a measure of our performance and net cash
provided by operating activities as a measure of our liquidity.
Additionally, Walmart’s definition of free cash flow is limited, in that it does not represent residual cash flows
available for discretionary expenditures, due to the fact that the measure does not deduct the payments required for
debt service and other contractual obligations or payments made for business acquisitions. Therefore, we believe it
is important to view free cash flow as a measure that provides supplemental information to our Consolidated
Statements of Cash Flows.
Although other companies report their free cash flow, numerous methods may exist for calculating a company’s free
cash flow. As a result, the method used by Walmart’s management to calculate our free cash flow may differ from
the methods used by other companies to calculate their free cash flow.
The following table sets forth a reconciliation of free cash flow, a non-GAAP financial measure, to net cash provided
by operating activities, which we believe to be the GAAP financial measure most directly comparable to free cash
flow, as well as information regarding net cash used in investing activities and net cash used in financing activities.
Nine Months Ended
October 31,
(Dollars in millions) 2020 2019
Net cash provided by operating activities $ 22,880 $ 14,539
Payments for property and equipment (capital expenditures) (6,438) (7,765)
Free cash flow $ 16,442 $ 6,774
Net cash used in investing activities1
$ (6,507) $ (6,285)
Net cash used in financing activities (11,340) (7,213)
1
“Net cash used in investing activities” includes payments for property and equipment, which is also included in our computation of free cash
flow.
11
12. Adjusted EPS
Adjusted diluted earnings per share attributable to Walmart (Adjusted EPS) is considered a non-GAAP financial
measure under the SEC’s rules because it excludes certain amounts included in the diluted earnings per share
attributable to Walmart calculated in accordance with GAAP (EPS), the most directly comparable financial measure
calculated in accordance with GAAP. Management believes that Adjusted EPS is a meaningful measure to share
with investors because it best allows comparison of the performance with that of the comparable period. In addition,
Adjusted EPS affords investors a view of what management considers Walmart’s core earnings performance and
the ability to make a more informed assessment of such core earnings performance with that of the prior year.
We adjust for the unrealized gains and losses on our equity investments (primarily JD.com) each quarter because
although the investments are strategic decisions for the Company’s retail operations, management’s measurement
of each strategy is primarily focused on the respective market’s operational results rather than the fair value of such
investments. Additionally, management does not forecast changes in the fair value of its equity investments.
Accordingly, management adjusts EPS each quarter for the unrealized gains and losses related to those equity
investments.
We have calculated Adjusted EPS for the three and nine months ended October 31, 2020 by adjusting EPS for the
following: (1) unrealized gains and losses on the company’s equity investments and (2) the loss on sale of Walmart
Argentina classified as held for sale as of October 31, 2020. For the nine months ended October 31, 2020 we also
adjusted EPS for (3) a business restructuring charge resulting from changes to corporate support teams to better
support the Walmart U.S. omni-channel support strategy and (4) a discrete tax item.
Three Months Ended October 31, 2020
Diluted earnings per share:
Reported EPS $ 1.80
Adjustments:
Pre-Tax
Impact
Tax
Impact1, 2
NCI
Impact3
Net
Impact
Unrealized (gains) and losses on equity investments $ (1.01) $ 0.21 $ — $ (0.80)
Loss on sale of Walmart Argentina 0.34 — — 0.34
Net adjustments $ (0.46)
Adjusted EPS $ 1.34
Nine Months Ended October 31, 20204
Diluted earnings per share:
Reported EPS $ 5.48
Adjustments:
Pre-Tax
Impact
Tax
Impact1,2
NCI
Impact3
Net
Impact
Unrealized (gains) and losses on equity investments $ (2.42) $ 0.50 $ — $ (1.92)
Business restructuring charge 0.13 (0.03) — 0.10
Discrete tax item 0.06 0.05 (0.03) 0.08
Loss on sale of Walmart Argentina 0.34 — — 0.34
Net adjustments $ (1.40)
Adjusted EPS $ 4.08
1
Calculated based on nature of item, including any realizable deductions, and statutory rate in effect for relevant jurisdictions. The loss on sale
of Walmart Argentina provided minimal realizable tax benefit.
2
The reported effective tax rate was 26.9%% and 25.7% for the three and nine months ended October 31, 2020, respectively. When adjusted for
the above items, the effective tax rate was 25.2% and 25.0% for the three and nine months ended October 31, 2020, respectively.
3
Calculated based on the ownership percentages of our noncontrolling interests.
4
Quarterly adjustments or adjusted EPS may not sum to YTD adjustments or YTD adjusted EPS due to rounding.
12
13. As previously disclosed in our third quarter ended October 31, 2019 press release, we have calculated Adjusted
EPS for the three and nine months ended October 31, 2019 by adjusting EPS for the following: (1) unrealized gains
and losses on the company's equity investment in JD.com and (2) a non-cash impairment charge related to the
Jabong.com trade name.
Three Months Ended October 31, 2019
Diluted earnings per share:
Reported EPS $ 1.15
Adjustments:
Pre-Tax
Impact
Tax
Impact1
NCI
Impact2
Net
Impact
Unrealized (gains) and losses on JD.com investment $ (0.06) $ 0.01 $ — $ (0.05)
Non-cash impairment charge on Jabong.com trade name 0.10 (0.03) (0.01) 0.06
Net adjustments $ 0.01
Adjusted EPS $ 1.16
Nine Months Ended October 31, 20193
Diluted earnings per share:
Reported EPS $ 3.74
Adjustments:
Pre-Tax
Impact
Tax
Impact1
NCI
Impact2
Net
Impact
Unrealized (gains) and losses on JD.com investment $ (0.32) $ 0.07 $ — $ (0.25)
Non-cash impairment charge on Jabong.com trade name 0.10 (0.03) (0.01) 0.06
Net adjustments $ (0.19)
Adjusted EPS $ 3.55
1
Calculated based on nature of item, including any realizable deductions, and statutory rate in effect for relevant jurisdictions.
2
Calculated based on the ownership percentages of the noncontrolling interest at Flipkart.
3
Quarterly adjustments or adjusted EPS may not sum to YTD adjustments or YTD adjusted EPS due to rounding.
13