Olamide Okulaja_Creating synergy for PPP_PPP Conference2019
vinti_clevelend2013fp
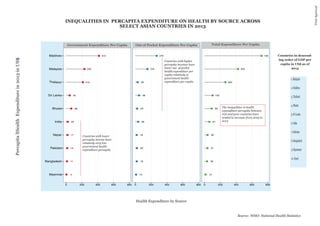
1. Source: WHO- National Health Statistics
INEQUALITIES IN PERCAPITA EXPENDITURE ON HEALTH BY SOURCE ACROSS
SELECT ASIAN COUNTRIES IN 2013
PercapitalHealthExpenditurein2013inUS$
1.Malaysia
2.Maldives
3.Thailand
4.Bhutan
5.SriLanka
6.India
7.Pakistan
8.Bangladesh
9.Myannmar
10.Nepal
Countries in descend-
ing order of GDP per
capita in US$ as of
2013
Health Expenditure by Source
VintiAgarwal
Government Expenditure Per Capita
415
232
212
66
45
20
17
14
11
4
270
153
48
36
30
23
20
19
18
10
720
423
264
102
90
61
39
37
32
14Myanmar
Bangladesh
Pakistan
Nepal
India
Bhutan
Sri Lanka
Thailand
Malaysia
Maldives
0 200 400 600 800 0 200 400 600 800 0 200 400 600 800
Out of Pocket Expenditure Per Capita Total Expenditure Per Capita
Countries with lower
percapita income have
relatively very low
government health
expenditure percapita
Countries with higher
percapita incomes have
lower out of pocket
health expenditure per
capita relatively to
government health
expenditure per capita
The inequalities in health
expenditure percapita between
rich and poor countries have
tended to increase from 2005 to
2013