SlideShare a Scribd company logo
1 of 1
Download to read offline
Distribution 20% Agency, Direct, Direct
Marketing, Brokers, IFAs
Product / Risk 55% Value of losses (claims)
General Operating
Expenses
13-20%
Policy Operation
Re-insurance 5%
Agency, Direct, Direct
Marketing
Fraud 5%
Inflated and fradulent
claims
Claims management
Risk evaluation
(underwriting)
Product development and
management
Marketing / Branding / PR
Premium Investments
(PAR fund, Float)
7%
Customer service
Costs Customer ValueStack Element Details
10%
Opportunity
H
Insurance stack: Value vs. Costs illustrates the mismatch and opportunities
5%
80%
5%
0
10%
2%
5%
0
1%
0
2%
Insurer Profit 2% - 9%
Focus on rapid model scalability
Profit margin remains similar
10%
------------------------------------------------------------------------------------------------ INSURER BOTTOM LINE -----------------------------------------------------------------------------------------------
M L
H
H
H
L
M
H
H
L
L
M
M

More Related Content

Similar to Value Stack (29 March 2016)

VMall presentation
VMall presentationVMall presentation
VMall presentation
Chloe Nguyen
 
Cab2 Report Presentation
Cab2 Report PresentationCab2 Report Presentation
Cab2 Report Presentation
Abdullah Alraee
 

Similar to Value Stack (29 March 2016) (20)

GOE Allocation Presentation
GOE Allocation PresentationGOE Allocation Presentation
GOE Allocation Presentation
 
Advanced Pricing in General Insurance
Advanced Pricing in General InsuranceAdvanced Pricing in General Insurance
Advanced Pricing in General Insurance
 
VMall presentation
VMall presentationVMall presentation
VMall presentation
 
procurement risk management
procurement risk managementprocurement risk management
procurement risk management
 
Bring the Customer Journey to Life with Salesforce Marketing Cloud
Bring the Customer Journey to Life with Salesforce Marketing CloudBring the Customer Journey to Life with Salesforce Marketing Cloud
Bring the Customer Journey to Life with Salesforce Marketing Cloud
 
Banking Sector
Banking SectorBanking Sector
Banking Sector
 
Business Risk Management Outline PowerPoint Presentation Slides
Business Risk Management Outline PowerPoint Presentation SlidesBusiness Risk Management Outline PowerPoint Presentation Slides
Business Risk Management Outline PowerPoint Presentation Slides
 
Investor and analyst day presentation website post 5 22_18
Investor and analyst day presentation website post 5 22_18Investor and analyst day presentation website post 5 22_18
Investor and analyst day presentation website post 5 22_18
 
Risk Management Tools And Techniques PowerPoint Presentation Slides
Risk Management Tools And Techniques PowerPoint Presentation SlidesRisk Management Tools And Techniques PowerPoint Presentation Slides
Risk Management Tools And Techniques PowerPoint Presentation Slides
 
Third Quarter 2016 Investor Presentation
Third Quarter 2016 Investor PresentationThird Quarter 2016 Investor Presentation
Third Quarter 2016 Investor Presentation
 
Procurement Risk Management PowerPoint Presentation Slides
Procurement Risk Management PowerPoint Presentation SlidesProcurement Risk Management PowerPoint Presentation Slides
Procurement Risk Management PowerPoint Presentation Slides
 
Cab2 Report Presentation
Cab2 Report PresentationCab2 Report Presentation
Cab2 Report Presentation
 
Tricumen / FY14 Capital Markets: Regions_open 250315
Tricumen / FY14 Capital Markets: Regions_open 250315Tricumen / FY14 Capital Markets: Regions_open 250315
Tricumen / FY14 Capital Markets: Regions_open 250315
 
Closing the Programmatic Loop
Closing the Programmatic LoopClosing the Programmatic Loop
Closing the Programmatic Loop
 
Procurement Risk Management
 Procurement Risk Management Procurement Risk Management
Procurement Risk Management
 
MDM comparatively less mature; plans seem to be in place to transform further...
MDM comparatively less mature; plans seem to be in place to transform further...MDM comparatively less mature; plans seem to be in place to transform further...
MDM comparatively less mature; plans seem to be in place to transform further...
 
Project Risk Management Overview PowerPoint Presentation Slides
Project Risk Management Overview PowerPoint Presentation SlidesProject Risk Management Overview PowerPoint Presentation Slides
Project Risk Management Overview PowerPoint Presentation Slides
 
Tricumen / Capital Markets Regions 6m15_open 230815
Tricumen / Capital Markets Regions 6m15_open 230815Tricumen / Capital Markets Regions 6m15_open 230815
Tricumen / Capital Markets Regions 6m15_open 230815
 
Ryder System, Inc. 2nd Quarter 2015 Earnings
Ryder System, Inc. 2nd Quarter 2015 EarningsRyder System, Inc. 2nd Quarter 2015 Earnings
Ryder System, Inc. 2nd Quarter 2015 Earnings
 
Revenue Assurance Industry Update - Webinar by Dr. Gadi Solotorevsky, cVidya'...
Revenue Assurance Industry Update - Webinar by Dr. Gadi Solotorevsky, cVidya'...Revenue Assurance Industry Update - Webinar by Dr. Gadi Solotorevsky, cVidya'...
Revenue Assurance Industry Update - Webinar by Dr. Gadi Solotorevsky, cVidya'...
 

Value Stack (29 March 2016)

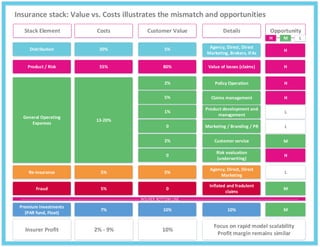
  • 1. Distribution 20% Agency, Direct, Direct Marketing, Brokers, IFAs Product / Risk 55% Value of losses (claims) General Operating Expenses 13-20% Policy Operation Re-insurance 5% Agency, Direct, Direct Marketing Fraud 5% Inflated and fradulent claims Claims management Risk evaluation (underwriting) Product development and management Marketing / Branding / PR Premium Investments (PAR fund, Float) 7% Customer service Costs Customer ValueStack Element Details 10% Opportunity H Insurance stack: Value vs. Costs illustrates the mismatch and opportunities 5% 80% 5% 0 10% 2% 5% 0 1% 0 2% Insurer Profit 2% - 9% Focus on rapid model scalability Profit margin remains similar 10% ------------------------------------------------------------------------------------------------ INSURER BOTTOM LINE ----------------------------------------------------------------------------------------------- M L H H H L M H H L L M M