Data precision meets
humanexpertise
UTI Quant Fund
UTI Mutual Fund
�I e,/:. l,u-1-M zi,tMfi "'4.
Mutual Fund investments are subject to market risks, read all scheme related documents carefully.
Factor Investing: Understandingkey Factors
3
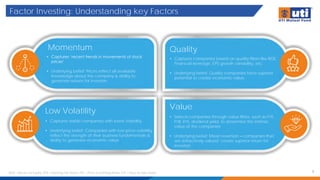
Momentum
• Captures ‘recent trends in movements of stock
prices’
• Underlying belief: Prices reflect all available
knowledge about the company & ability to
generate returns for investors
Low Volatility
• Captures stable companies with lower Volatility
• Underlying belief: Companies with low price-volatility
reflect the strength of their business fundamentals &
ability to generate economic value
• Captures companies based on quality filters like ROE,
Financial leverage, EPS growth variability, etc.
• Underlying belief: Quality companies have superior
potential to create economic value
Quality
Value
• Selects companies through value filters, such as P/E,
P/B, P/S, dividend yield, to determine the intrinsic
value of the companies
• Underlying belief: Mean reversion – companies that
are attractively valued create superior return for
investors
ROE – Return on Equity, EPS – Earnings Per Share, P/E – Price to Earnings Ratio, P/S – Price to Sales Ratio
4.
Factor Investing: Long-termperformance
4
Data From 31/Mar/2005 to 30/Nov/2024. 'Momentum” refers to Nifty 200 Momentum 30 TRI, “Low Volatility” refers BSE Low Volatility TRI*, “Quality” refers to Nifty200 Quality 30 TRI, “Value” refers to Nifty 500
Value 50 TRI, “BSE 200” refers to BSE 200 TRI. Nifty 100 Low Volatility ITRI is taken as the Index for Low Volatility before the launch of BSE Low Volatility TRI in September 2005. Source: MFI Explorer & Nifty Indices
Limited. Past performance may or may not sustain in the future. The figures pertain to performance of the index and do not indicate the returns/performance of the scheme. It is not possible to invest directly
in Index. Returns & Volatility are calculated on Compound Annual Growth Rate & Annualized basis (Daily Returns).
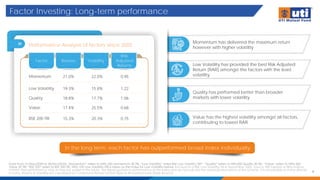
In the long term, each factor has outperformed broad index individually
Momentum has delivered the maximum return
however with higher volatility
Low Volatility has provided the best Risk Adjusted
Return (RAR) amongst the factors with the least
volatility
Quality has performed better than broader
markets with lower volatility
Value has the highest volatility amongst all factors,
contributing to lowest RAR
Performance Analysis of factors since 2005
Factor Returns Volatility
Risk
Adjusted
Returns
Momentum 21.0% 22.0% 0.95
Low Volatility 19.3% 15.8% 1.22
Quality 18.8% 17.7% 1.06
Value 17.4% 25.5% 0.68
BSE 200 TRI 15.3% 20.3% 0.75
5.
Factor Investing :Winners keep rotating
5
Data From 31/Mar/2005 to 30/Nov/2024. 'Momentum” refers to Nifty 200 Momentum 30 TRI, “Low Volatility” refers BSE Low Volatility TRI*, “Quality” refers to Nifty200 Quality 30 TRI, “Value” refers to Nifty 500
Value 50 TRI, “BSE 200” refers to BSE 200 TRI. Nifty 100 Low Volatility ITRI is taken as the Index for Low Volatility before the launch of BSE Low Volatility TRI in September 2005. Source: MFI Explorer & Nifty Indices
Limited. Past performance may or may not sustain in the future. The figures pertain to performance of the index and do not indicate the returns/performance of the scheme. It is not possible to invest directly
in Index.
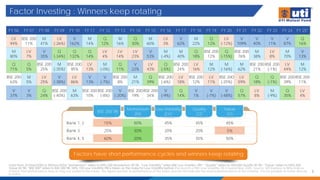
Factors have short performance cycles and winners keep rotating
BSE 200 TRI
Momentum
(M)
Low Volatility
(LV)
Quality
(Q)
Value
(V)
Rank 1, 2 15% 50% 45% 45% 45%
Rank 3 25% 30% 20% 20% 5%
Rank 4, 5 60% 20% 35% 35% 50%
FY 06 FY 07 FY 08 FY 09 FY 10 FY 11 FY 12 FY 13 FY 14 FY 15 FY 16 FY 17 FY 18 FY 19 FY 20 FY 21 FY 22 FY 23 FY 24 FY 25*
LV
94%
BSE 200
11%
M
41%
LV
(-26%)
V
162%
M
14%
Q
12%
M
16%
Q
30%
M
60%
LV
3%
V
62%
M
22%
Q
12%
LV
(-12%)
V
109%
V
40%
V
11%
V
87%
Q
16%
M
80%
LV
7%
V
35%
Q
(-34%)
Q
132%
Q
14%
LV
4%
LV
14%
LV
23%
V
53%
M
(-4%)
M
40%
Q
18%
BSE 200
12%
Q
(-15%)
BSE 200
76%
M
38%
LV
8%
M
70%
V
13%
Q
71%
Q
5%
BSE 200
25%
M
(-35%)
BSE 200
95%
LV
13%
M
(-0%)
Q
11%
V
22%
LV
43%
Q
(-5%)
BSE 200
24%
LV
16%
M
12%
M
(-16%)
M
62%
BSE 200
21%
BSE 200
(-1%)
LV
44%
M
12%
BSE 200
63%
M
5%
LV
25%
V
(-38%)
LV
86%
V
13%
V
(-7%)
BSE 200
8%
M
21%
Q
39%
BSE 200
(-6%)
LV
18%
BSE 200
12%
LV
11%
BSE 200
(-25%)
LV
59%
Q
18%
Q
(-1%)
BSE 200
39%
BSE 200
11%
V
37%
V
3%
Q
24%
BSE 200
(-40%)
M
63%
BSE 200
10%
BSE 200
(-8%)
V
(-20%)
BSE 200
19%
BSE 200
34%
V
(-9%)
Q
14%
V
1%
V
(-7%)
V
(-48%)
Q
57%
LV
8%
M
(-9%)
Q
35%
LV
4%
6.
Factor Investing :Alpha Generation
6
Data From 31/Mar/2005 to 30/Nov/2024. 'Momentum” refers to Nifty 200 Momentum 30 TRI, “Low Volatility” refers BSE Low Volatility TRI*, “Quality” refers to Nifty200 Quality 30 TRI, “Value” refers to Nifty 500
Value 50 TRI, “BSE 200” refers to BSE 200 TRI. Nifty 100 Low Volatility ITRI is taken as the Index for Low Volatility before the launch of BSE Low Volatility TRI in September 2005. Source: MFI Explorer & Nifty Indices
Limited. Past performance may or may not sustain in the future. The figures pertain to performance of the index and do not indicate the returns/performance of the scheme. It is not possible to invest directly
in Index.
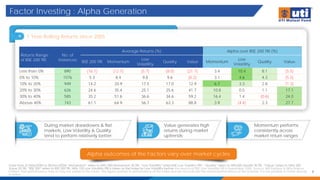
Alpha outcomes of the Factors vary over market cycles
1 Year Rolling Returns since 2005
During market drawdowns & flat
markets, Low Volatility & Quality
tend to perform relatively better;
Value generates high
returns during market
uptrends;
Momentum performs
consistently across
market return ranges
Returns Range
of BSE 200 TRI
No. of
Instances
Average Returns (%) Alpha over BSE 200 TRI (%)
BSE 200 TRI Momentum
Low
Volatility
Quality Value Momentum
Low
Volatility
Quality Value
Less than 0% 890 (16.1) (12.7) (5.7) (8.0) (21.7) 3.4 10.4 8.1 (5.5)
0% to 10% 1076 5.3 8.4 9.8 9.6 (0.2) 3.1 4.6 4.3 (5.5)
10% to 20% 949 14.2 20.9 17.5 17.0 12.9 6.7 3.3 2.8 (1.3)
20% to 30% 626 24.6 35.4 25.1 25.6 41.7 10.8 0.5 1.1 17.1
30% to 40% 585 35.2 51.6 36.6 34.6 59.2 16.4 1.4 (0.6) 24.0
Above 40% 743 61.1 64.9 56.7 63.3 88.8 3.9 (4.4) 2.3 27.7
7.
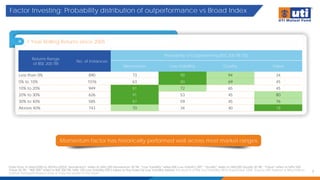
Factor Investing: Probabilitydistribution of outperformance vs Broad Index
7
Data From 31/Mar/2005 to 30/Nov/2024. 'Momentum” refers to Nifty 200 Momentum 30 TRI, “Low Volatility” refers BSE Low Volatility TRI*, “Quality” refers to Nifty200 Quality 30 TRI, “Value” refers to Nifty 500
Value 50 TRI , “BSE 200” refers to BSE 200 TRI. Nifty 100 Low Volatility ITRI is taken as the Index for Low Volatility before the launch of BSE Low Volatility TRI in September 2005. Source: MFI Explorer & Nifty Indices
Limited. Past performance may or may not sustain in the future.
Momentum factor has historically performed well across most market ranges
1 Year Rolling Returns since 2005
Returns Range
of BSE 200 TRI
No. of Instances
Probability of Outperforming BSE 200 TRI (%)
Momentum Low Volatility Quality Value
Less than 0% 890 73 98 94 34
0% to 10% 1076 63 80 69 45
10% to 20% 949 81 72 65 45
20% to 30% 626 91 53 45 80
30% to 40% 585 87 59 45 76
Above 40% 743 70 34 40 78
8.
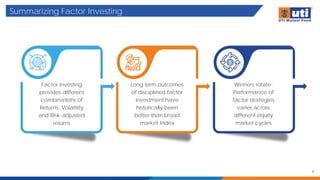
Summarizing Factor Investing
8
Factorinvesting
provides different
combinations of
Returns, Volatility
and Risk-adjusted
returns
Long term outcomes
of disciplined factor
investment have
historically been
better than broad
market Index
Winners rotate:
Performance of
factor strategies
varies across
different equity
market cycles
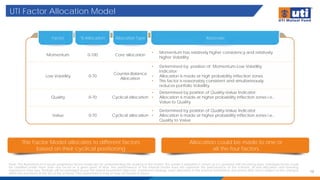
UTI Factor AllocationModel
10
Note: The illustrations of in-house proprietary factor model are for understanding the working of the model. The model is adaptive in nature as it is updated with incoming data. Individual stocks could
be classified under more than one factor at a given point of time. The performance of the internal model does not represent the performance of the scheme. Actual allocation and investing
experience may vary. Portfolio will be managed as per the stated investment objective, investment strategy, asset allocation in the scheme information document (SID) and is subject to the changes
within the provisions of the SID of the scheme. Past performance may or may not sustain in future.
The Factor Model allocates to different factors
based on their cyclical positioning
Allocation could be made to one or
all the four factors
Factor % Allocation Allocation Type Rationale
Momentum 0-100 Core allocation
• Momentum has relatively higher consistency and relatively
higher Volatility
Low Volatility 0-70
Counter-Balance
Allocation
• Determined by position of Momentum-Low Volatility
Indicator;
• Allocation is made at high probability inflection zones.
• This factor is reasonably consistent and simultaneously
reduces portfolio Volatility
Quality 0-70 Cyclical allocation
• Determined by position of Quality-Value Indicator;
• Allocation is made at higher probability inflection zones i.e.,
Value to Quality
Value 0-70 Cyclical allocation
• Determined by position of Quality-Value Indicator;
• Allocation is made at higher probability inflection zones i.e.,
Quality to Value
11.
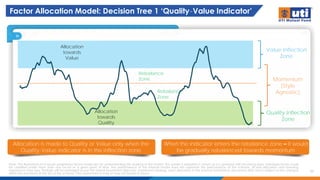
Factor Allocation Model:Decision Tree 1 ‘Quality-Value Indicator’
11
Note: The illustrations of in-house proprietary factor model are for understanding the working of the model. The model is adaptive in nature as it is updated with incoming data. Individual stocks could
be classified under more than one factor at a given point of time. The performance of the internal model does not represent the performance of the scheme. Actual allocation and investing
experience may vary. Portfolio will be managed as per the stated investment objective, investment strategy, asset allocation in the scheme information document (SID) and is subject to the changes
within the provisions of the SID of the scheme. Past performance may or may not sustain in future.
Allocation is made to Quality or Value only when the
Quality-Value indicator is in the inflection zone
When the indicator enters the rebalance zone – it would
be gradually rebalanced towards momentum
Rebalance
Zone
Rebalance
Zone
Allocation
towards
Value
Allocation
towards
Quality
Value Inflection
Zone
Quality Inflection
Zone
Momentum
(Style
Agnostic)
12.
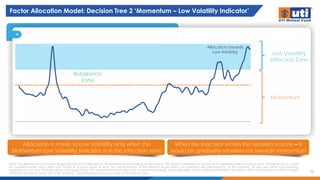
Factor Allocation Model:Decision Tree 2 ‘Momentum – Low Volatility Indicator’
12
Note: The illustrations of in-house proprietary factor model are for understanding the working of the model. The model is adaptive in nature as it is updated with incoming data. Individual stocks could
be classified under more than one factor at a given point of time. The performance of the internal model does not represent the performance of the scheme. Actual allocation and investing
experience may vary. Portfolio will be managed as per the stated investment objective, investment strategy, asset allocation in the scheme information document (SID) and is subject to the changes
within the provisions of the SID of the scheme. Past performance may or may not sustain in future.
Allocation is made to Low Volatility only when the
Momentum-Low Volatility indicator is in the inflection zone
When the indicator enters the rebalance zone – it
would be gradually rebalanced towards momentum
Low Volatility
Inflection Zone
Momentum
Allocation towards
Low Volatility
Rebalance
Zone
13.
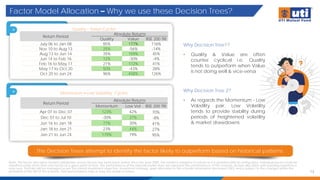
Factor Model Allocation– Why we use these Decision Trees?
13
Note: The factor allocation model's distribution across factors has been back tested since the year 2005. The model is adaptive in nature as it is updated with incoming data. Individual stocks could be
classified under more than one factor at a given point of time. The performance of the internal model does not represent the performance of the scheme. Actual allocation and investing experience
may vary. Portfolio will be managed as per the stated investment objective, investment strategy, asset allocation in the scheme information document (SID) and is subject to the changes within the
provisions of the SID of the scheme. Past performance may or may not sustain in future.
The Decision Trees attempt to identify the factor likely to outperform based on historical patterns
Why Decision Tree1?
• Quality & Value are often
counter cyclical i.e. Quality
tends to outperform when Value
is not doing well & vice-versa
Why Decision Tree 2?
• As regards the Momentum - Low
Volatility pair, Low Volatility
tends to provide stability during
periods of heightened volatility
& market drawdowns
Quality - Value Cycles
Return Period
Absolute Returns
Quality Value BSE 200 TRI
July 06 to Jan 08 85% 177% 116%
Nov 10 to Aug 13 25% -56% -14%
Aug 13 to Jun 14 35% 159% 45%
Jun 14 to Feb 16 12% -30% -4%
Feb 16 to May 17 21% 112% 41%
May 17 to Oct 20 50% -43% 28%
Oct 20 to Jun 24 96% 458% 126%
Momentum – Low Volatility Cycles
Return Period
Absolute Returns
Momentum Low Vol BSE 200 TRI
Apr 07 to Dec 07 123% 42% 70%
Dec 07 to Jul 10 -30% 37% -8%
Jun 16 to Jan 18 77% 30% 41%
Jan 18 to Jan 21 23% 44% 27%
Jan 21 to Jun 24 179% 79% 95%
14.
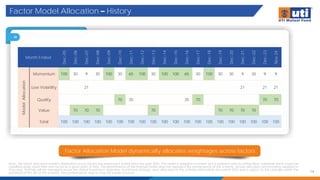
Factor Model Allocation– History
14
Note: The factor allocation model's distribution across factors has been back tested since the year 2005. The model is adaptive in nature as it is updated with incoming data. Individual stocks could be
classified under more than one factor at a given point of time. The performance of the internal model does not represent the performance of the scheme. Actual allocation and investing experience
may vary. Portfolio will be managed as per the stated investment objective, investment strategy, asset allocation in the scheme information document (SID) and is subject to the changes within the
provisions of the SID of the scheme. Past performance may or may not sustain in future.
Factor Allocation Model dynamically allocates weightages across factors
Month Ended
Dec-05
Dec-06
Dec-07
Dec-08
Dec-09
Dec-10
Dec-11
Dec-12
Dec-13
Dec-14
Dec-15
Dec-16
Dec-17
Dec-18
Dec-19
Dec-20
Dec-21
Dec-22
Dec-23
Nov
24
Model
Allocation
Momentum 100 30 9 30 100 30 65 100 30 100 100 65 30 100 30 30 9 30 9 9
Low Volatility 0 0 21 0 0 0 0 0 0 0 0 0 0 0 0 0 21 0 21 21
Quality 0 0 0 0 0 70 35 0 0 0 0 35 70 0 0 0 0 0 70 70
Value 0 70 70 70 0 0 0 0 70 0 0 0 0 0 70 70 70 70 0 0
Total 100 100 100 100 100 100 100 100 100 100 100 100 100 100 100 100 100 100 100 100
15.
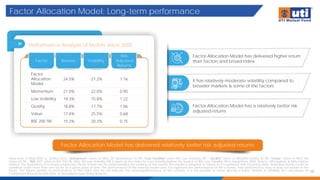
Factor Allocation Model:Long-term performance
15
Data from 31/Mar/2005 to 30/Nov/2024. 'Momentum” refers to Nifty 200 Momentum 30 TRI, “Low Volatility” refers BSE Low Volatility TRI*, “Quality” refers to Nifty200 Quality 30 TRI, “Value” refers to Nifty 500
Value 50 TRI , “BSE 200” refers to BSE 200 TRI. Nifty 100 Low Volatility ITRI is taken as the Index for Low Volatility before the launch of BSE Low Volatility TRI in September 2005. Source: MFI Explorer & Nifty Indices
Limited. The illustrations of in-house proprietary factor model are for understanding the working of the model. The model is adaptive in nature as it is updated with incoming data. Individual stocks could be
classified under more than one factor at a given point of time. The performance of the internal model does not represent the performance of the scheme. Past performance may or may not sustain in the
future. The figures pertain to performance of the index and do not indicate the returns/performance of the scheme. It is not possible to invest directly in Index. Returns & Volatility are calculated on
Compound Annual Growth Rate & Annualized basis (Daily Returns).
Factor Allocation Model has delivered relatively better risk adjusted returns
Factor Allocation Model has delivered higher return
than factors and broad index
It has relatively moderate volatility compared to
broader markets & some of the factors
Factor Allocation Model has a relatively better risk
adjusted returns
Performance Analysis of factors since 2005
Factor Returns Volatility
Risk
Adjusted
Returns
Factor
Allocation
Model
24.5% 21.2% 1.16
Momentum 21.0% 22.0% 0.95
Low Volatility 19.3% 15.8% 1.22
Quality 18.8% 17.7% 1.06
Value 17.4% 25.5% 0.68
BSE 200 TRI 15.3% 20.3% 0.75
16.
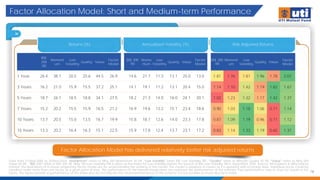
Factor Allocation Model:Short and Medium-term Performance
16
Data from 31/Mar/2005 to 30/Nov/2024. 'Momentum” refers to Nifty 200 Momentum 30 TRI, “Low Volatility” refers BSE Low Volatility TRI*, “Quality” refers to Nifty200 Quality 30 TRI, “Value” refers to Nifty 500
Value 50 TRI , “BSE 200” refers to BSE 200 TRI. Nifty 100 Low Volatility ITRI is taken as the Index for Low Volatility before the launch of BSE Low Volatility TRI in September 2005. Source: MFI Explorer & Nifty Indices
Limited. The illustrations of in-house proprietary factor model are for understanding the working of the model. The model is adaptive in nature as it is updated with incoming data. Individual stocks could be
classified under more than one factor at a given point of time. The performance of the internal model does not represent the performance of the scheme. Past performance may or may not sustain in the
future. The figures pertain to performance of the index and do not indicate the returns/performance of the scheme. It is not possible to invest directly in Index.
Factor Allocation Model has delivered relatively better risk adjusted returns
Returns (%) Annualized Volatility (%) Risk Adjusted Returns
BSE
200
TRI
Moment
um
Low
Volatility
Quality Value
Factor
Model
BSE 200
TRI
Mome
ntum
Low
Volatility
Quality Value
Factor
Model
BSE 200
TRI
Moment
um
Low
Volatility
Quality Value
Factor
Model
1 Year 26.4 38.1 20.5 25.6 44.5 26.9 14.6 21.7 11.3 13.1 25.0 13.0 1.81 1.76 1.81 1.96 1.78 2.07
3 Years 16.2 21.0 15.9 15.5 37.2 25.1 14.1 19.1 11.2 13.1 20.4 15.0 1.14 1.10 1.42 1.19 1.82 1.67
5 Years 18.7 26.1 18.5 18.8 34.1 27.5 18.2 21.3 14.0 16.0 24.1 20.1 1.02 1.23 1.32 1.17 1.42 1.37
7 Years 15.2 20.2 15.5 15.9 16.5 21.2 16.9 19.6 13.2 15.1 23.4 18.6 0.90 1.03 1.18 1.06 0.71 1.14
10 Years 13.7 20.5 15.0 13.5 16.7 19.9 15.8 18.7 12.6 14.0 23.3 17.8 0.87 1.09 1.19 0.96 0.71 1.12
15 Years 13.3 20.2 16.4 16.3 15.1 22.5 15.9 17.8 12.4 13.7 23.1 17.2 0.83 1.14 1.33 1.19 0.65 1.31
17.
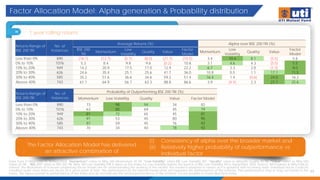
Factor Allocation Model:Alpha generation & Probability distribution
17
Data from 31/Mar/2005 to 30/Nov/2024. 'Momentum” refers to Nifty 200 Momentum 30 TRI, “Low Volatility” refers BSE Low Volatility TRI*, “Quality” refers to Nifty200 Quality 30 TRI, “Value” refers to Nifty 500
Value 50 TRI , “BSE 200” refers to BSE 200 TRI. Nifty 100 Low Volatility ITRI is taken as the Index for Low Volatility before the launch of BSE Low Volatility TRI in September 2005. Source: MFI Explorer & Nifty Indices
Limited. The illustrations of in-house proprietary factor model are for understanding the working of the model. The model is adaptive in nature as it is updated with incoming data. Individual stocks could be
classified under more than one factor at a given point of time. The performance of the internal model does not represent the performance of the scheme. Past performance may or may not sustain in the
future. The figures pertain to performance of the index and do not indicate the returns/performance of the scheme. It is not possible to invest directly in Index.
The Factor Allocation Model has delivered
an attractive combination of
(i) Consistency of alpha over the broader market and
(ii) Relatively higher probability of outperformance vs
individual factor
1 year rolling returns
Returns Range of
BSE 200 TRI
No. of
Instances
Average Returns (%) Alpha over BSE 200 TRI (%)
BSE 200
TRI
Momentum
Low
Volatility
Quality Value
Factor
Model
Momentum
Low
Volatility
Quality Value
Factor
Model
Less than 0% 890 (16.1) (12.7) (5.7) (8.0) (21.7) (10.5) 3.4 10.4 8.1 (5.5) 5.6
0% to 10% 1076 5.3 8.4 9.8 9.6 (0.2) 10.8 3.1 4.6 4.3 (5.5) 5.5
10% to 20% 949 14.2 20.9 17.5 17.0 12.9 22.2 6.7 3.3 2.8 (1.3) 8.0
20% to 30% 626 24.6 35.4 25.1 25.6 41.7 36.0 10.8 0.5 1.1 17.1 11.5
30% to 40% 585 35.2 51.6 36.6 34.6 59.2 51.4 16.4 1.4 (0.6) 24.0 16.2
Above 40% 743 61.1 64.9 56.7 63.3 88.8 86.6 3.9 (4.4) 2.3 27.7 25.6
Returns Range of
BSE 200 TRI
No. of
Instances
Probability of Outperforming BSE 200 TRI (%)
Momentum Low Volatility Quality Value Factor Model
Less than 0% 890 73 98 94 34 82
0% to 10% 1076 63 80 69 45 79
10% to 20% 949 81 72 65 45 81
20% to 30% 626 91 53 45 80 95
30% to 40% 585 87 59 45 76 92
Above 40% 743 70 34 40 78 92
18.
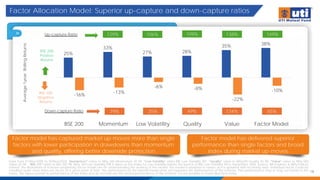
Factor Allocation Model:Superior up-capture and down-capture ratios
18
Data from 31/Mar/2005 to 30/Nov/2024. 'Momentum” refers to Nifty 200 Momentum 30 TRI, “Low Volatility” refers BSE Low Volatility TRI*, “Quality” refers to Nifty200 Quality 30 TRI, “Value” refers to Nifty 500
Value 50 TRI , “BSE 200” refers to BSE 200 TRI. Nifty 100 Low Volatility ITRI is taken as the Index for Low Volatility before the launch of BSE Low Volatility TRI in September 2005. Source: MFI Explorer & Nifty Indices
Limited. The illustrations of in-house proprietary factor model are for understanding the working of the model. The model is adaptive in nature as it is updated with incoming data. Individual stocks could be
classified under more than one factor at a given point of time. The performance of the internal model does not represent the performance of the scheme. Past performance may or may not sustain in the
future. The figures pertain to performance of the index and do not indicate the returns/performance of the scheme. It is not possible to invest directly in Index.
Factor model has captured market up-moves more than single
factors with lower participation in drawdowns than momentum
and quality, offering better downside protection
Factor model has delivered superior
performance than single factors and broad
index during market up-moves
25%
33%
27% 28%
35% 38%
-16%
-13%
-6% -8%
-22%
-10%
BSE 200 Momentum Low Volatility Quality Value Factor Model
Up-capture Ratio
Down-capture Ratio
129% 106% 109% 138% 149%
65%
134%
49%
35%
79%
BSE 200
Positive
Returns
Average
1year
Rolling
Returns
BSE 200
Negative
Returns
19.
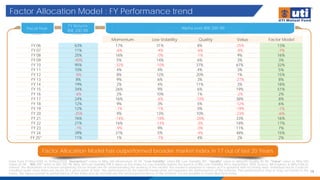
Factor Allocation Model: FY Performance trend
19
Data from 31/Mar/2005 to 30/Nov/2024. 'Momentum” refers to Nifty 200 Momentum 30 TRI, “Low Volatility” refers BSE Low Volatility TRI*, “Quality” refers to Nifty200 Quality 30 TRI, “Value” refers to Nifty 500
Value 50 TRI , “BSE 200” refers to BSE 200 TRI. Nifty 100 Low Volatility ITRI is taken as the Index for Low Volatility before the launch of BSE Low Volatility TRI in September 2005. Source: MFI Explorer & Nifty Indices
Limited. The illustrations of in-house proprietary factor model are for understanding the working of the model. The model is adaptive in nature as it is updated with incoming data. Individual stocks could be
classified under more than one factor at a given point of time. The performance of the internal model does not represent the performance of the scheme. Past performance may or may not sustain in the
future. The figures pertain to performance of the index and do not indicate the returns/performance of the scheme. It is not possible to invest directly in Index.
Factor Allocation Model has outperformed broader market index in 17 out of last 20 Years
Fiscal Year Alpha over BSE 200 TRI
FY Returns
BSE 200 TRI
FY 06 63% 17% 31% 8% -25% 13%
FY 07 11% -6% -4% -6% -8% -7%
FY 08 25% 16% -0% -1% 9% 16%
FY 09 -40% 5% 14% 6% 3% 3%
FY 10 95% -32% -10% 37% 67% 32%
FY 11 10% 4% 4% 4% 3% 5%
FY 12 -8% 8% 12% 20% 1% 15%
FY 13 8% 9% 6% 3% -27% 8%
FY 14 19% 2% 4% 11% 3% 18%
FY 15 34% 26% 9% 6% 19% 51%
FY 16 -6% 2% 10% 1% -2% 2%
FY 17 24% 16% -6% -10% 38% 8%
FY 18 12% 9% 3% 5% -12% 6%
FY 19 12% -1% -1% 0% -19% -1%
FY 20 -25% 9% 13% 10% -23% -6%
FY 21 76% -14% -18% -20% 33% 16%
FY 22 21% 16% -14% -3% 18% 17%
FY 23 -1% -9% 9% -0% 11% 7%
FY 24 39% 31% 5% -4% 48% 15%
FY 25* 11% 1% -7% 4% 2% 2%
Momentum Low Volatility Quality Value Factor Model
20.
Factor Allocation Model: Performance across key market events
20
Data from 31/Mar/2005 to 30/Nov/2024. 'Momentum” refers to Nifty 200 Momentum 30 TRI, “Low Volatility” refers BSE Low Volatility TRI*, “Quality” refers to Nifty200 Quality 30 TRI, “Value” refers to Nifty 500
Value 50 TRI , “BSE 200” refers to BSE 200 TRI. Nifty 100 Low Volatility ITRI is taken as the Index for Low Volatility before the launch of BSE Low Volatility TRI in September 2005. Source: MFI Explorer & Nifty Indices
Limited. The illustrations of in-house proprietary factor model are for understanding the working of the model. The model is adaptive in nature as it is updated with incoming data. Individual stocks could be
classified under more than one factor at a given point of time. The performance of the internal model does not represent the performance of the scheme. Past performance may or may not sustain in the
future. The figures pertain to performance of the index and do not indicate the returns/performance of the scheme. It is not possible to invest directly in Index.
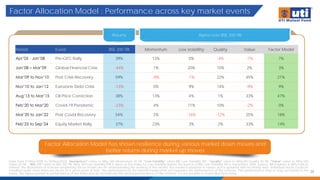
Factor Allocation Model has shown resilience during various market down moves and
better returns during market up moves
Returns Alpha over BSE 200 TRI
Period Event BSE 200 TRI Momentum Low Volatility Quality Value Factor Model
Apr’05 - Jan’08 Pre-GFC Rally 39% 13% 0% -4% -7% 7%
Jan’08 – Mar’09 Global Financial Crisis -44% 1% 20% 10% 2% 3%
Mar’09 to Nov’10 Post Crisis Recovery 59% -8% -1% 22% 45% 21%
Nov’10 to Jan’12 Eurozone Debt Crisis -13% 0% 9% 14% -9% 9%
Aug’13 to Mar’15 Oil Price Correction 38% 13% 4% 1% 33% 47%
Feb’20 to Mar’20 Covid-19 Pandemic -23% 4% 11% 10% -2% 0%
Mar’20 to Jan’22 Post Covid Recovery 54% 2% -16% -12% 25% 18%
Feb’23 to Sep’24 Equity Market Rally 37% 23% 3% 2% 33% 14%
21.
Factor Allocation Model: Rolling Return Performance
21
Data from 31/Mar/2005 to 30/Nov/2024. BSE 200” refers to BSE 200 TRI. Source: MFI Explorer & Nifty Indices Limited. The illustrations of in-house proprietary factor model are for understanding the working of the
model. The model is adaptive in nature as it is updated with incoming data. Individual stocks could be classified under more than one factor at a given point of time. The performance of the internal model
does not represent the performance of the scheme. Past performance may or may not sustain in the future. The figures pertain to performance of the index and do not indicate the returns/performance of
the scheme. It is not possible to invest directly in Index.
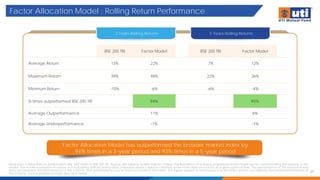
Factor Allocation Model has outperformed the broader market index by
94% times in a 3-year period and 93% times in a 5-year period
BSE 200 TRI Factor Model BSE 200 TRI Factor Model
Average Return 13% 22% 7% 12%
Maximum Return 39% 48% 22% 26%
Minimum Return -10% -6% -6% -4%
% times outperformed BSE 200 TRI 94% 93%
Average Outperformance 11% 6%
Average Underperformance -1% -1%
3 Years Rolling Returns 5 Years Rolling Returns
22.
Summarizing Factor AllocationModel
22
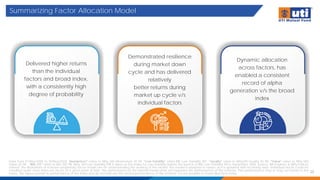
Delivered higher returns
than the individual
factors and broad index,
with a consistently high
degree of probability
Demonstrated resilience
during market down
cycle and has delivered
relatively
better returns during
market up cycle v/s
individual factors
Dynamic allocation
across factors, has
enabled a consistent
record of alpha
generation v/s the broad
index
Data from 31/Mar/2005 to 30/Nov/2024. 'Momentum” refers to Nifty 200 Momentum 30 TRI, “Low Volatility” refers BSE Low Volatility TRI*, “Quality” refers to Nifty200 Quality 30 TRI, “Value” refers to Nifty 500
Value 50 TRI , “BSE 200” refers to BSE 200 TRI. Nifty 100 Low Volatility ITRI is taken as the Index for Low Volatility before the launch of BSE Low Volatility TRI in September 2005. Source: MFI Explorer & Nifty Indices
Limited. The illustrations of in-house proprietary factor model are for understanding the working of the model. The model is adaptive in nature as it is updated with incoming data. Individual stocks could be
classified under more than one factor at a given point of time. The performance of the internal model does not represent the performance of the scheme. Past performance may or may not sustain in the
future. The figures pertain to performance of the index and do not indicate the returns/performance of the scheme. It is not possible to invest directly in Index.
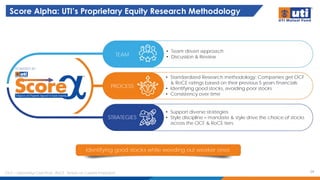
Score Alpha: UTI’sProprietary Equity Research Methodology
24
Identifying good stocks while weeding out weaker ones
TEAM
PROCESS
STRATEGIES
• Team driven approach
• Discussion & Review
• Standardized Research methodology: Companies get OCF
& RoCE ratings based on their previous 5 years financials
• Identifying good stocks, avoiding poor stocks
• Consistency over time
• Support diverse strategies
• Style discipline – mandate & style drive the choice of stocks
across the OCF & RoCE tiers
POWERED BY
OCF – Operating Cash Flow , RoCE : Return on Capital Employed
25.
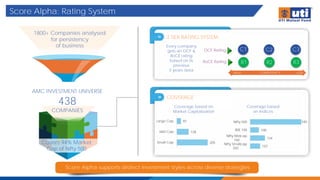
Score Alpha: RatingSystem
Score Alpha supports distinct investment styles across diverse strategies
Covers 94% Market
Cap of Nifty 500
1800+ Companies analysed
for persistency
of business
COVERAGE
3 TIER RATING SYSTEM
C1 C2 C3
R1 R2 R3
OCF Rating
RoCE Rating
LOW
HIGH CONSISTENCY
Every company
gets an OCF &
RoCE rating
based on its
previous
5 years data
205
128
97
Small Cap
Mid Cap
Large Cap
Coverage based on
Market Capitalization
107
134
100
340
Nifty Smallcap
250
Nifty Midcap
150
BSE 100
Nifty 500
Coverage based
on Indices
AMC INVESTMENT UNIVERSE
438
COMPANIES
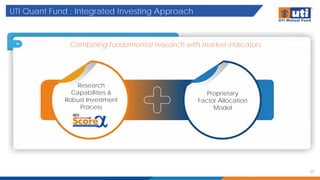
UTI Quant Fund: Integrated Investing Approach
27
Combining fundamental research with market indicators
Research
Capabilities &
Robust Investment
Process
Proprietary
Factor Allocation
Model
28.
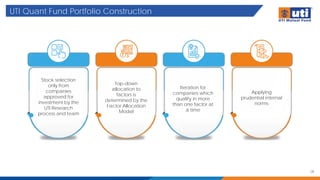
UTI Quant FundPortfolio Construction
28
Stock selection
only from
companies
approved for
investment by the
UTI Research
process and team
Top-down
allocation to
factors is
determined by the
Factor Allocation
Model
Iteration for
companies which
qualify in more
than one factor at
a time
Applying
prudential internal
norms
29.
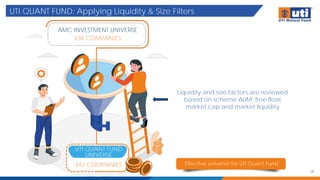
UTI QUANT FUND:Applying Liquidity & Size Filters
29
Effective universe for UTI Quant Fund
AMC INVESTMENT UNIVERSE
438 COMPANIES
UTI QUANT FUND
UNIVERSE
342 COMPANIES
Liquidity and size factors are reviewed
based on scheme AUM, free float
market cap and market liquidity
30.
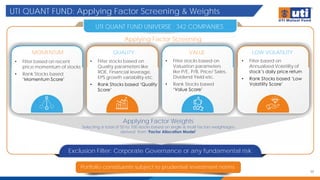
UTI QUANT FUND:Applying Factor Screening & Weights
30
Portfolio constituents subject to prudential investment norms
UTI QUANT FUND UNIVERSE : 342 COMPANIES
Exclusion Filter: Corporate Governance or any fundamental risk
Applying Factor Weights
Selecting a total of 50 to 100 stocks based on single & multi factors weightages
derived from ‘Factor Allocation Model’
Applying Factor Screening
MOMENTUM QUALITY VALUE LOW VOLATILITY
• Filter based on recent
price momentum of stocks
• Rank Stocks based
‘Momentum Score’
• Filter stocks based on
Quality parameters like
ROE, Financial leverage,
EPS growth variability etc.
• Rank Stocks based ‘Quality
Score’
• Filter stocks based on
Valuation parameters
like P/E, P/B, Price/ Sales,
Dividend Yield etc.
• Rank Stocks based
‘Value Score’
• Filter based on
Annualized Volatility of
stock’s daily price return
• Rank Stocks based ‘Low
Volatility Score’
31.
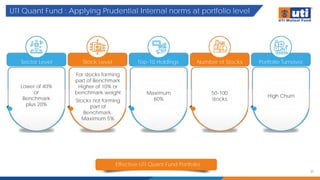
UTI Quant Fund: Applying Prudential Internal norms at portfolio level
31
Effective UTI Quant Fund Portfolio
Sector Level Stock Level Top-10 Holdings Number of Stocks Portfolio Turnover
Lower of 40%
or
Benchmark
plus 20%
For stocks forming
part of Benchmark
Higher of 10% or
benchmark weight
Stocks not forming
part of
Benchmark:
Maximum 5%
Maximum
60%
50-100
stocks
High Churn
32.
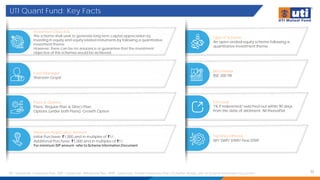
UTI Quant Fund:Key Facts
32
SIP – Systematic Investment Plan; SWP – Systematic Withdrawal Plan; STRIP - Systematic Transfer Investment Plan. For further details, refer to Scheme Information Document
Investment Objective
The scheme shall seek to generate long term capital appreciation by
investing in equity and equity related instruments by following a quantitative
investment theme.
However, there can be no assurance or guarantee that the investment
objective of the schemes would be achieved.
Type of Scheme
An open-ended equity scheme following a
quantitative investment theme
Fund Manager
Sharwan Goyal
Benchmark
BSE 200 TRI
Plans & Options
Plans: Regular Plan & Direct Plan
Options (under both Plans): Growth Option
Minimum Application Amount
Initial Purchase: ₹1,000 and in multiples of ₹1/-
Additional Purchase: ₹1,000 and in multiples of ₹1/-
For minimum SIP amount- refer to Scheme Information Document
Facilities Offered
SIP/ SWP/ STRIP/ Flexi STRIP
Exit Load
1% if redeemed/ switched-out within 90 days
from the date of allotment; Nil thereafter
33.
Why invest inUTI Quant Fund?
33
“Aims to consistently generate alpha over the broad
index through an Integrated Investment Approach.
Combining our in-house proprietary research
methodology ‘ScoreApha’ along with
‘Factor Allocation Model’ designed to
dynamically allocate weights to factors that
are expected to do well in the near future.”
34.
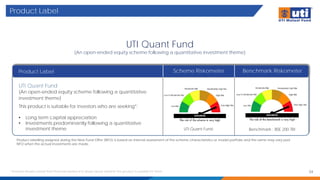
Product Label
UTI QuantFund
(An open-ended equity scheme following a quantitative investment theme)
Product Label
Product labelling assigned during the New Fund Offer (NFO) is based on internal assessment of the scheme characteristics or model portfolio and the same may vary post
NFO when the actual investments are made.
Scheme Riskometer Benchmark Riskometer
UTI Quant Fund
(An open-ended equity scheme following a quantitative
investment theme)
This product is suitable for investors who are seeking*:
• Long term capital appreciation
• Investments predominantly following a quantitative
investment theme Benchmark : BSE 200 TRI
* Investors should consult their financial advisers if in doubt about whether the product is suitable for them. 34
UTI Quant Fund
35.
Mutual Fund Investmentsare subject to market risks, read all scheme related documents carefully.
REGISTERED OFFICE: UTI Tower, ‘GN’ Block, Bandra Kurla Complex, Bandra (E), Mumbai - 400051. Phone: 022 – 66786666. UTI Asset Management Company Ltd (Investment
Manager for UTI Mutual Fund) Email: invest@uti.co.in. (CIN-L65991MH2002PLC137867). For more information, please contact the nearest UTI Financial Centre or your AMFI/NISM
certified UTI Mutual Fund Independent Financial Advisor (IFA) for a copy of the Statement of Additional Information, Scheme Information Document, and Key Information
Memorandum cum Application Form.
Disclaimers:
The illustrations of in-house proprietary factor model are for understanding the working of the model. The model is adaptive in nature as it is updated with incoming data.
Individual stocks could be classified under more than one factor at a given point of time. The performance of the internal model does not represent the performance of the
scheme. Actual allocation and investing experience may vary. Portfolio will be managed as per the stated investment objective, investment strategy, asset allocation in the
scheme information document (SID) and is subject to the changes within the provisions of the SID of the scheme. Past performance may or may not sustain in future.
The information on this document is provided for information purposes only. It does not constitute any offer, recommendation, or solicitation to any person to enter into any
transaction or adopt any hedging, trading, or investment strategy, nor does it constitute any prediction of likely future movements in rates or prices or any representation that
any such future movements will not exceed those shown in any illustration. Users of this document should seek advice regarding the appropriateness of investing in any
securities, financial instruments, or investment strategies referred to in this document and should understand that statements regarding future prospects may not be realized.
The recipient of this material is solely responsible for any action taken based on this material. Opinions, projections, and estimates are subject to change without notice.
UTI AMC Ltd is not an investment adviser and is not purporting to provide you with investment, legal, or tax advice. UTI AMC Ltd or UTI Mutual Fund (acting through UTI Trustee
Company Pvt. Ltd) accepts no liability and will not be liable for any loss or damage arising directly or indirectly (including special, incidental, or consequential loss or damage)
from your use of this document, howsoever arising, and including any loss, damage or expense arising from, but not limited to, any defect, error, imperfection, fault, mistake or
inaccuracy with this document, its contents or associated services, or due to any unavailability of the document or any part thereof or any contents or associated services.
The fund Strategy shown is subject to change with respect to peer-set and benchmark. Limits mentioned are internal prudential norms. For asset allocation and related details,
please refer to the Scheme Information Document of the respective schemes.
All complaints, regarding UTI Mutual Fund can be directed towards service@uti.co.in and for any unsatisfactory or lack of response visit https://scores.sebi.gov.in (SEBI SCORES
portal) and /or visit https://smartodr.in/ (Online Dispute Resolution Portal).
Disclaimer