Downloaded 13 times
![CFA Investment Research Competition Panhandle Oil & Gas, Inc.
4 | P a g e
Source: IMF Data and Forecast
Source: Cowen & Co.’s annual E&P study for 2015
Source: Baker Hughes 1/30/2015
Bargain Power
Supplier
Bargain Power
Customer
Threat of New
Entrants
Threat of
Substitutes
Industry
Rivalry
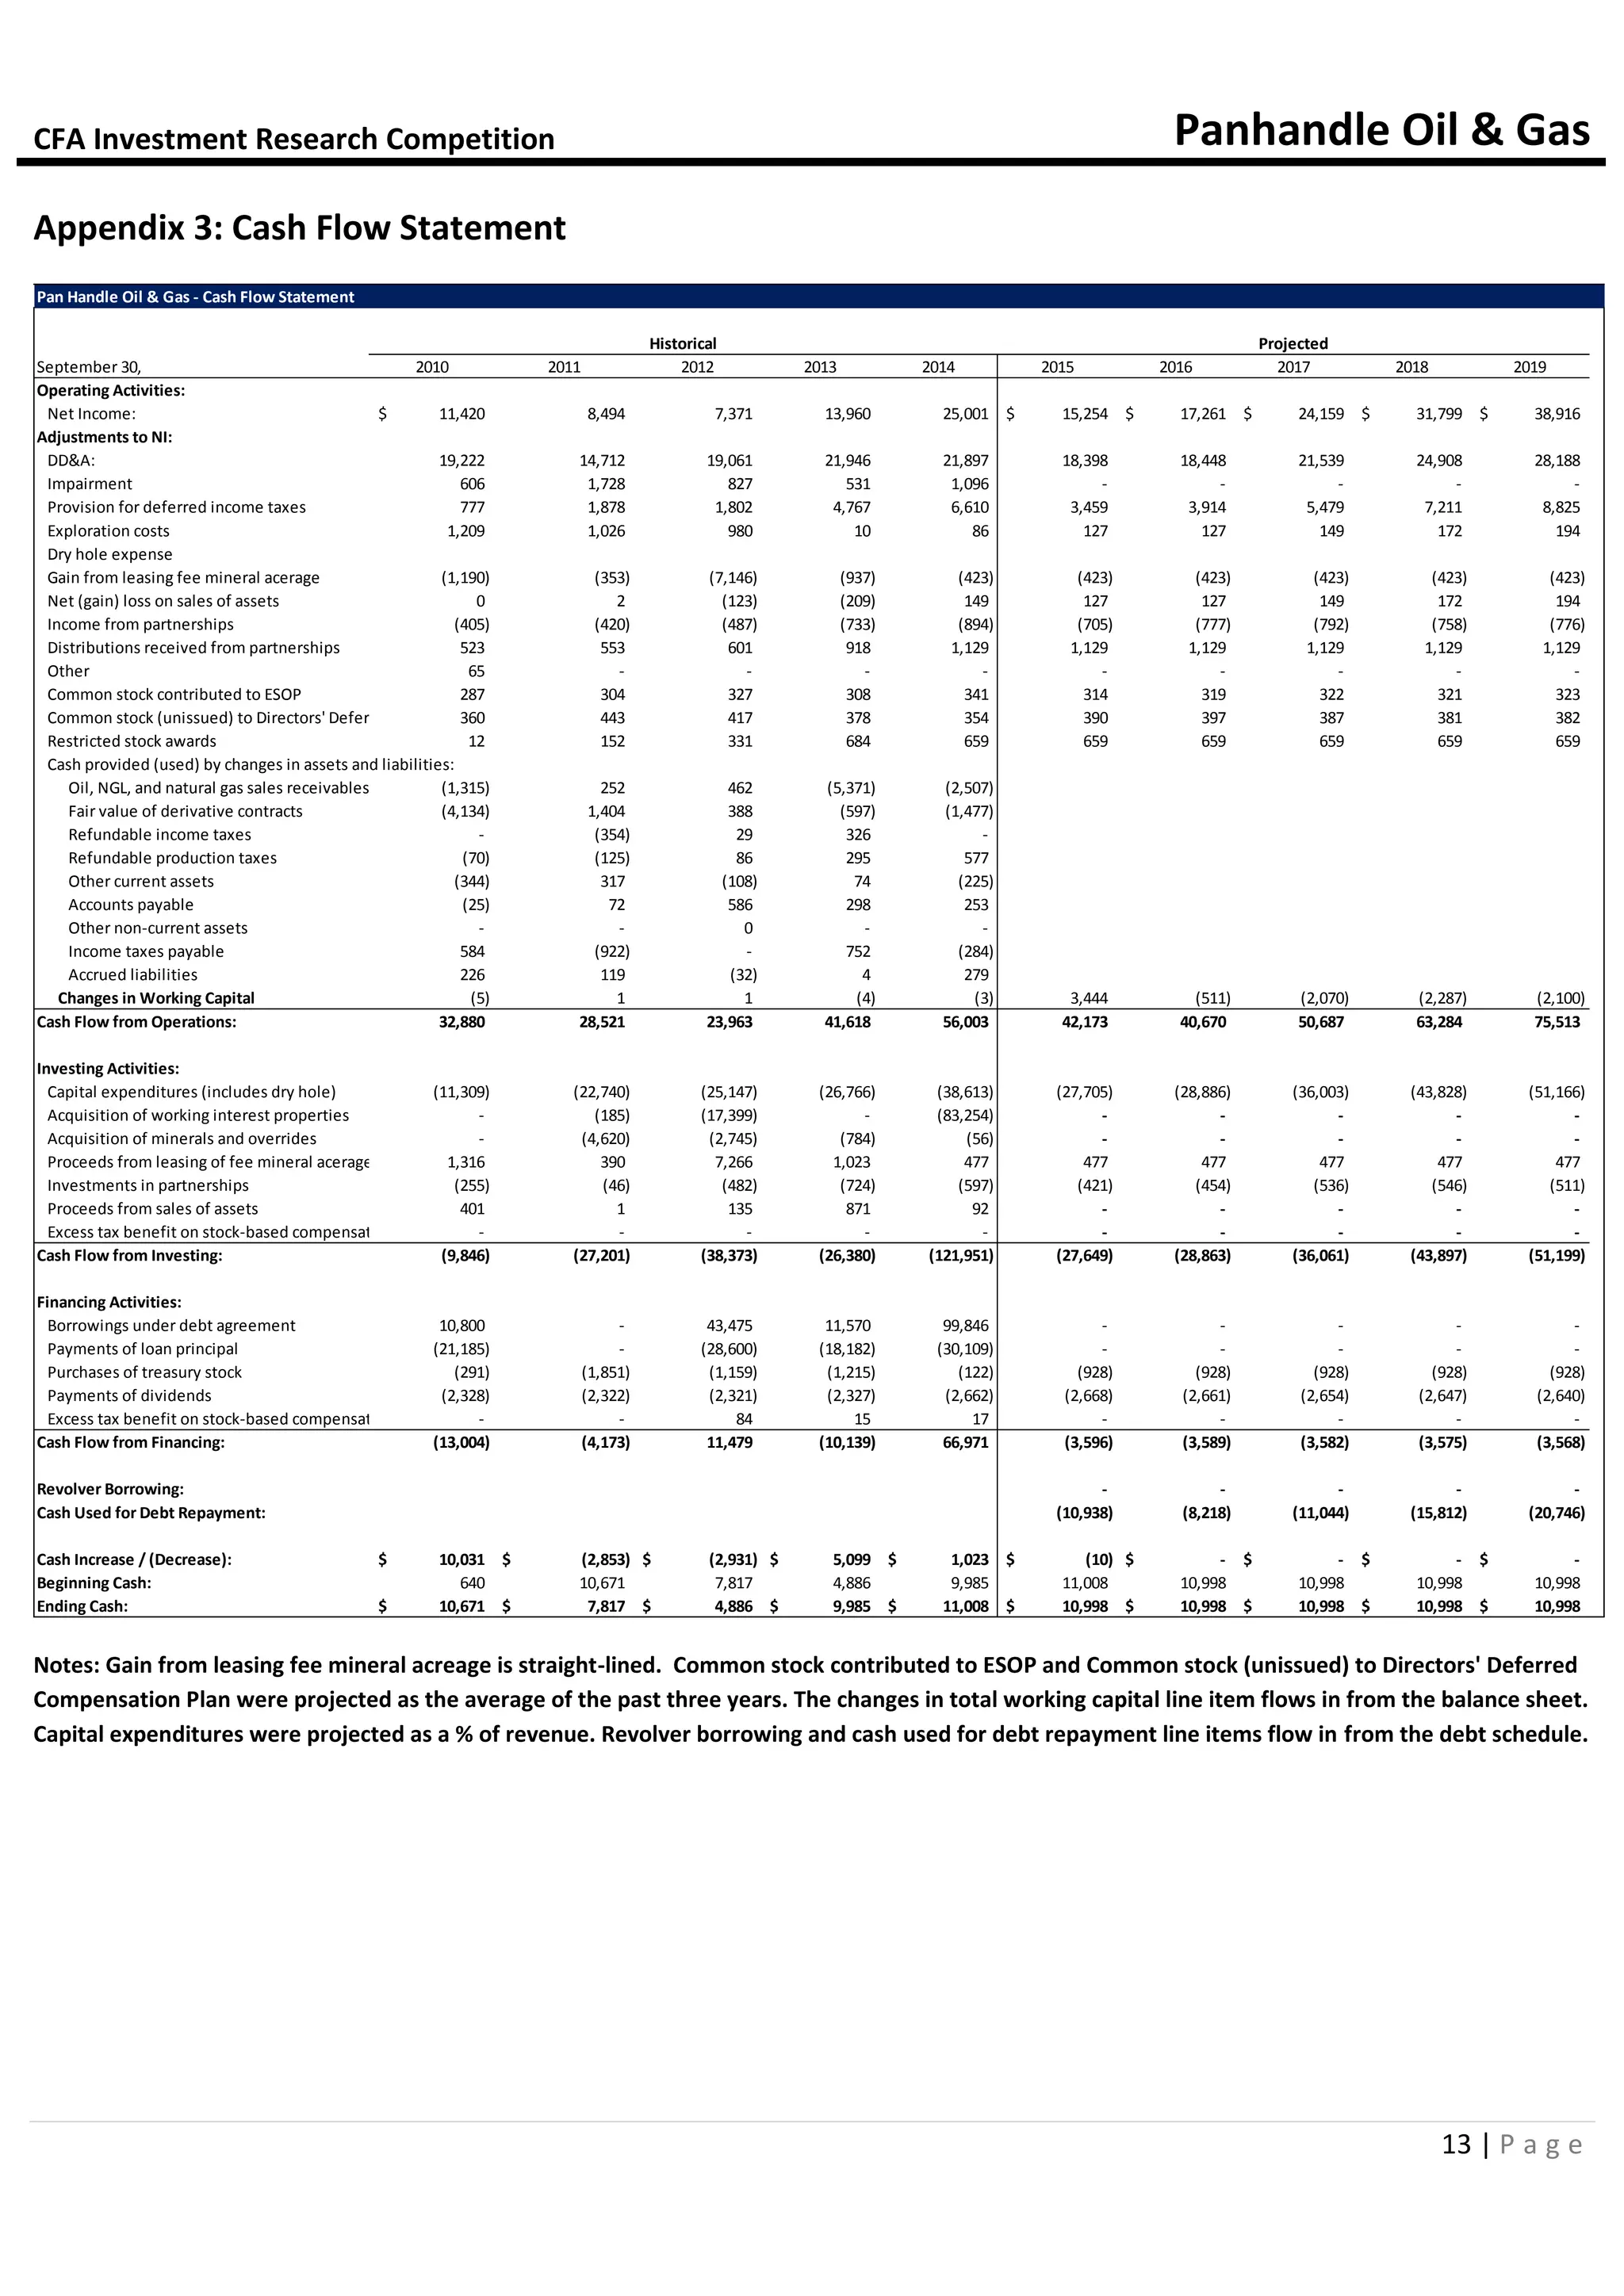
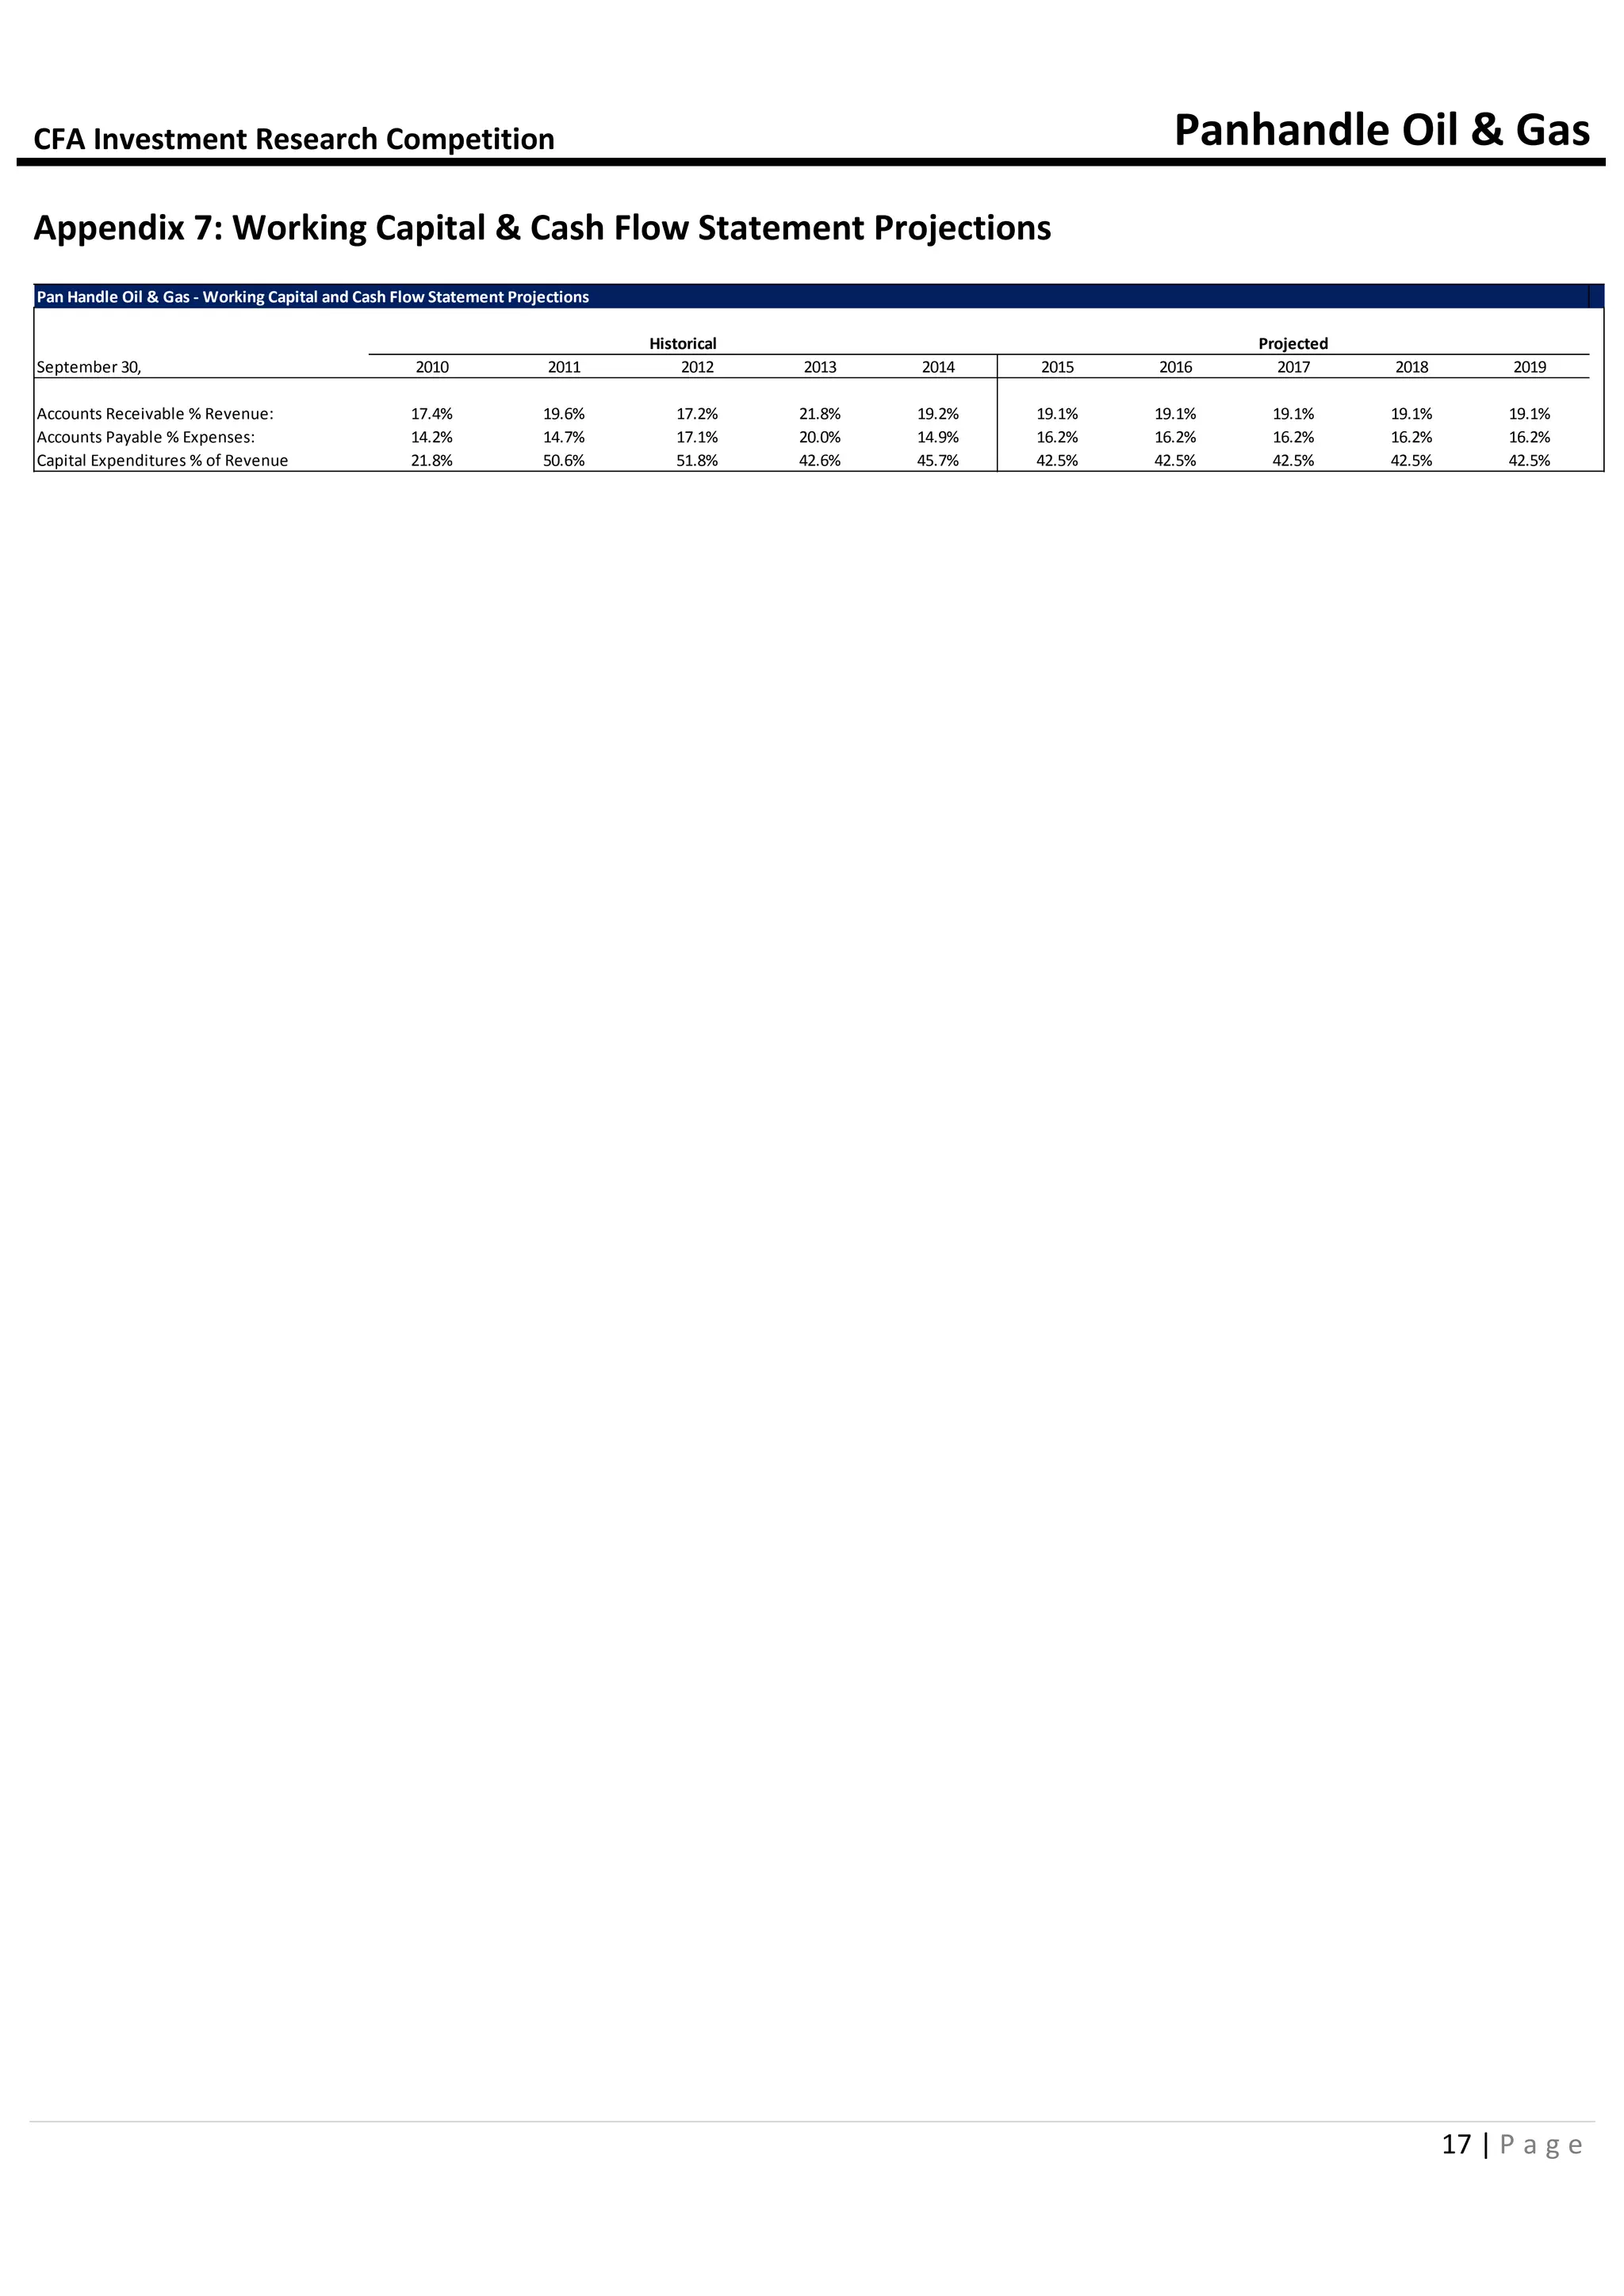
Source: Appendix 23
facing possible deflation, and is struggling to keep the monetary union afloat while being burdened by
sanctions imposed on Russia. In Latin America, countries such as Brazil and Venezuela rely on oil prices to
sustain budget deficits. In light of recent events both countries are now battling budget deficits and this has
had negative consequences on their respective economies. Lastly, China’s growth has seemed to slow
down, and while the country has maintained a 7.5% growth target, real numbers seem to be significantly
lower. All of these factors create a troubling economic outlook in the near future.
Price Assumptions Given Economic Backdrop:
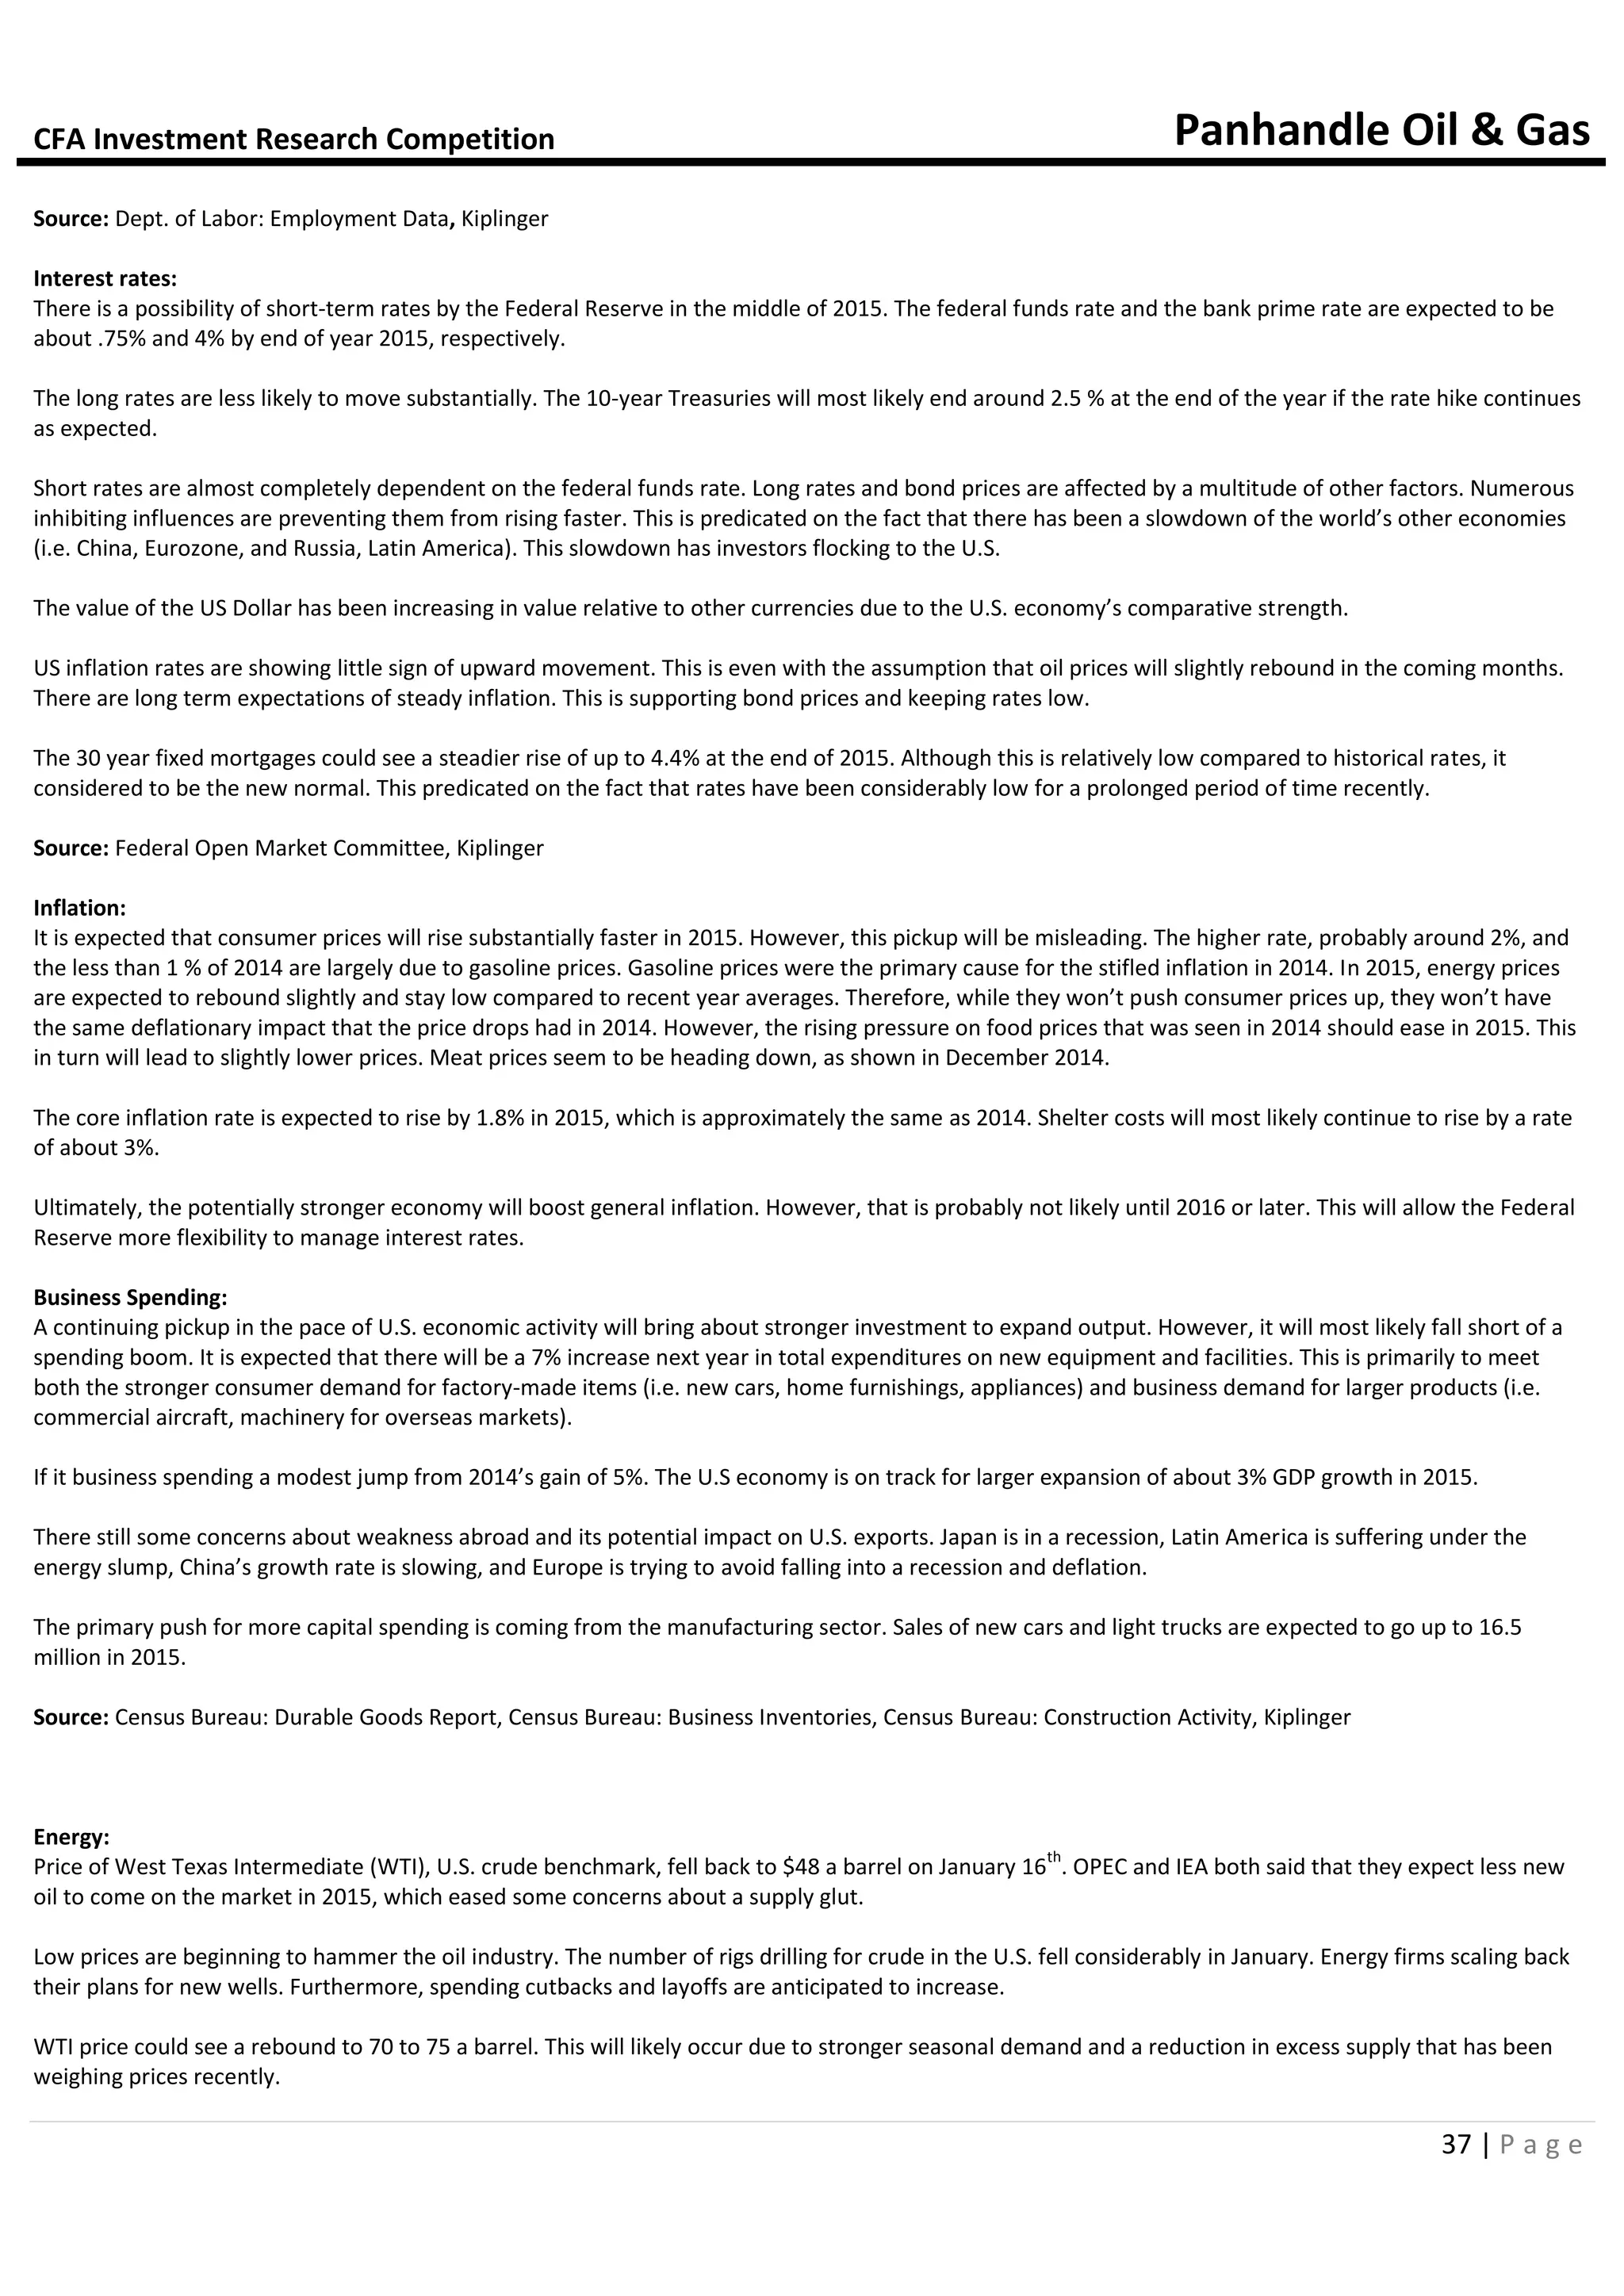
The price assumptions for the report are based on the January 13 forecast made by the U.S. Energy
Information Administration (EIA). The rationale for this is that the EIA report not only includes future pricing
in their forecasts, but also global supply and demand, GDP growth, and other economic factors. We believe
that relying on this multifactor assumption is the best method to encompass all foreseeable price risks in
our analysis.
Industry Overview & Competitive Positioning
Industry Overview
Possible E&P Liquidity Crunch
Exploration and Production (E&P) companies face larger than average capital expenditures to maintain their
operations. As such, it is not surprising that the sector takes on more debt on average than other industries.
As energy prices fall, the value of the reserves securing debt has decreased. Oil and gas companies that
have minimum cash balances and debt maturing soon may face considerable distress. Twice a year, the
lending bank will reassess each energy company’s borrowing capacity. Panhandle just had its borrowing
base reaffirmed in October and given their ability to use more land to secure debt, should pass through any
industry liquidity troubles unscathed.
Drilling and Production Costs Changing
Several factors indicate that oil and gas service providers might shrink costs in the future. The recent
consolidation of Baker Hughes and Halliburton might lead to lower service costs in the long-run if cost
synergies are realized. The merger of the second and third largest firms in the Oil Field Services industry will
take some time, so the decreased pricing effect will not be immediate. The current energy prices will affect
the prices that the company will charge in the near term quicker. In the 3
rd
quarter conference call, the
current CEO of Occidental (OXY) said, “[OXY] also expects that since service companies were happy to raise
prices when oil was going up that they would have been just as happy to have their prices lower in the
future”.
Declining Growth of New Wells
Drilling new wells to maintain production is vital for most companies to retain market share. In recent
weeks, we have seen a stark drop in rotary rig counts (the drilling equipment required drilling a new well).
Rotary rigs are only needed in the beginning stages of drilling and can be used for months on end depending
on the depth of the well. The rig count provided by Baker Hughes is a forward indicator regarding the
amount of new production being brought online. The rig count has dropped 20% since October, and as
more continuing projects are completed and fewer are started, we can expect this number to decline.
Competitive Positioning
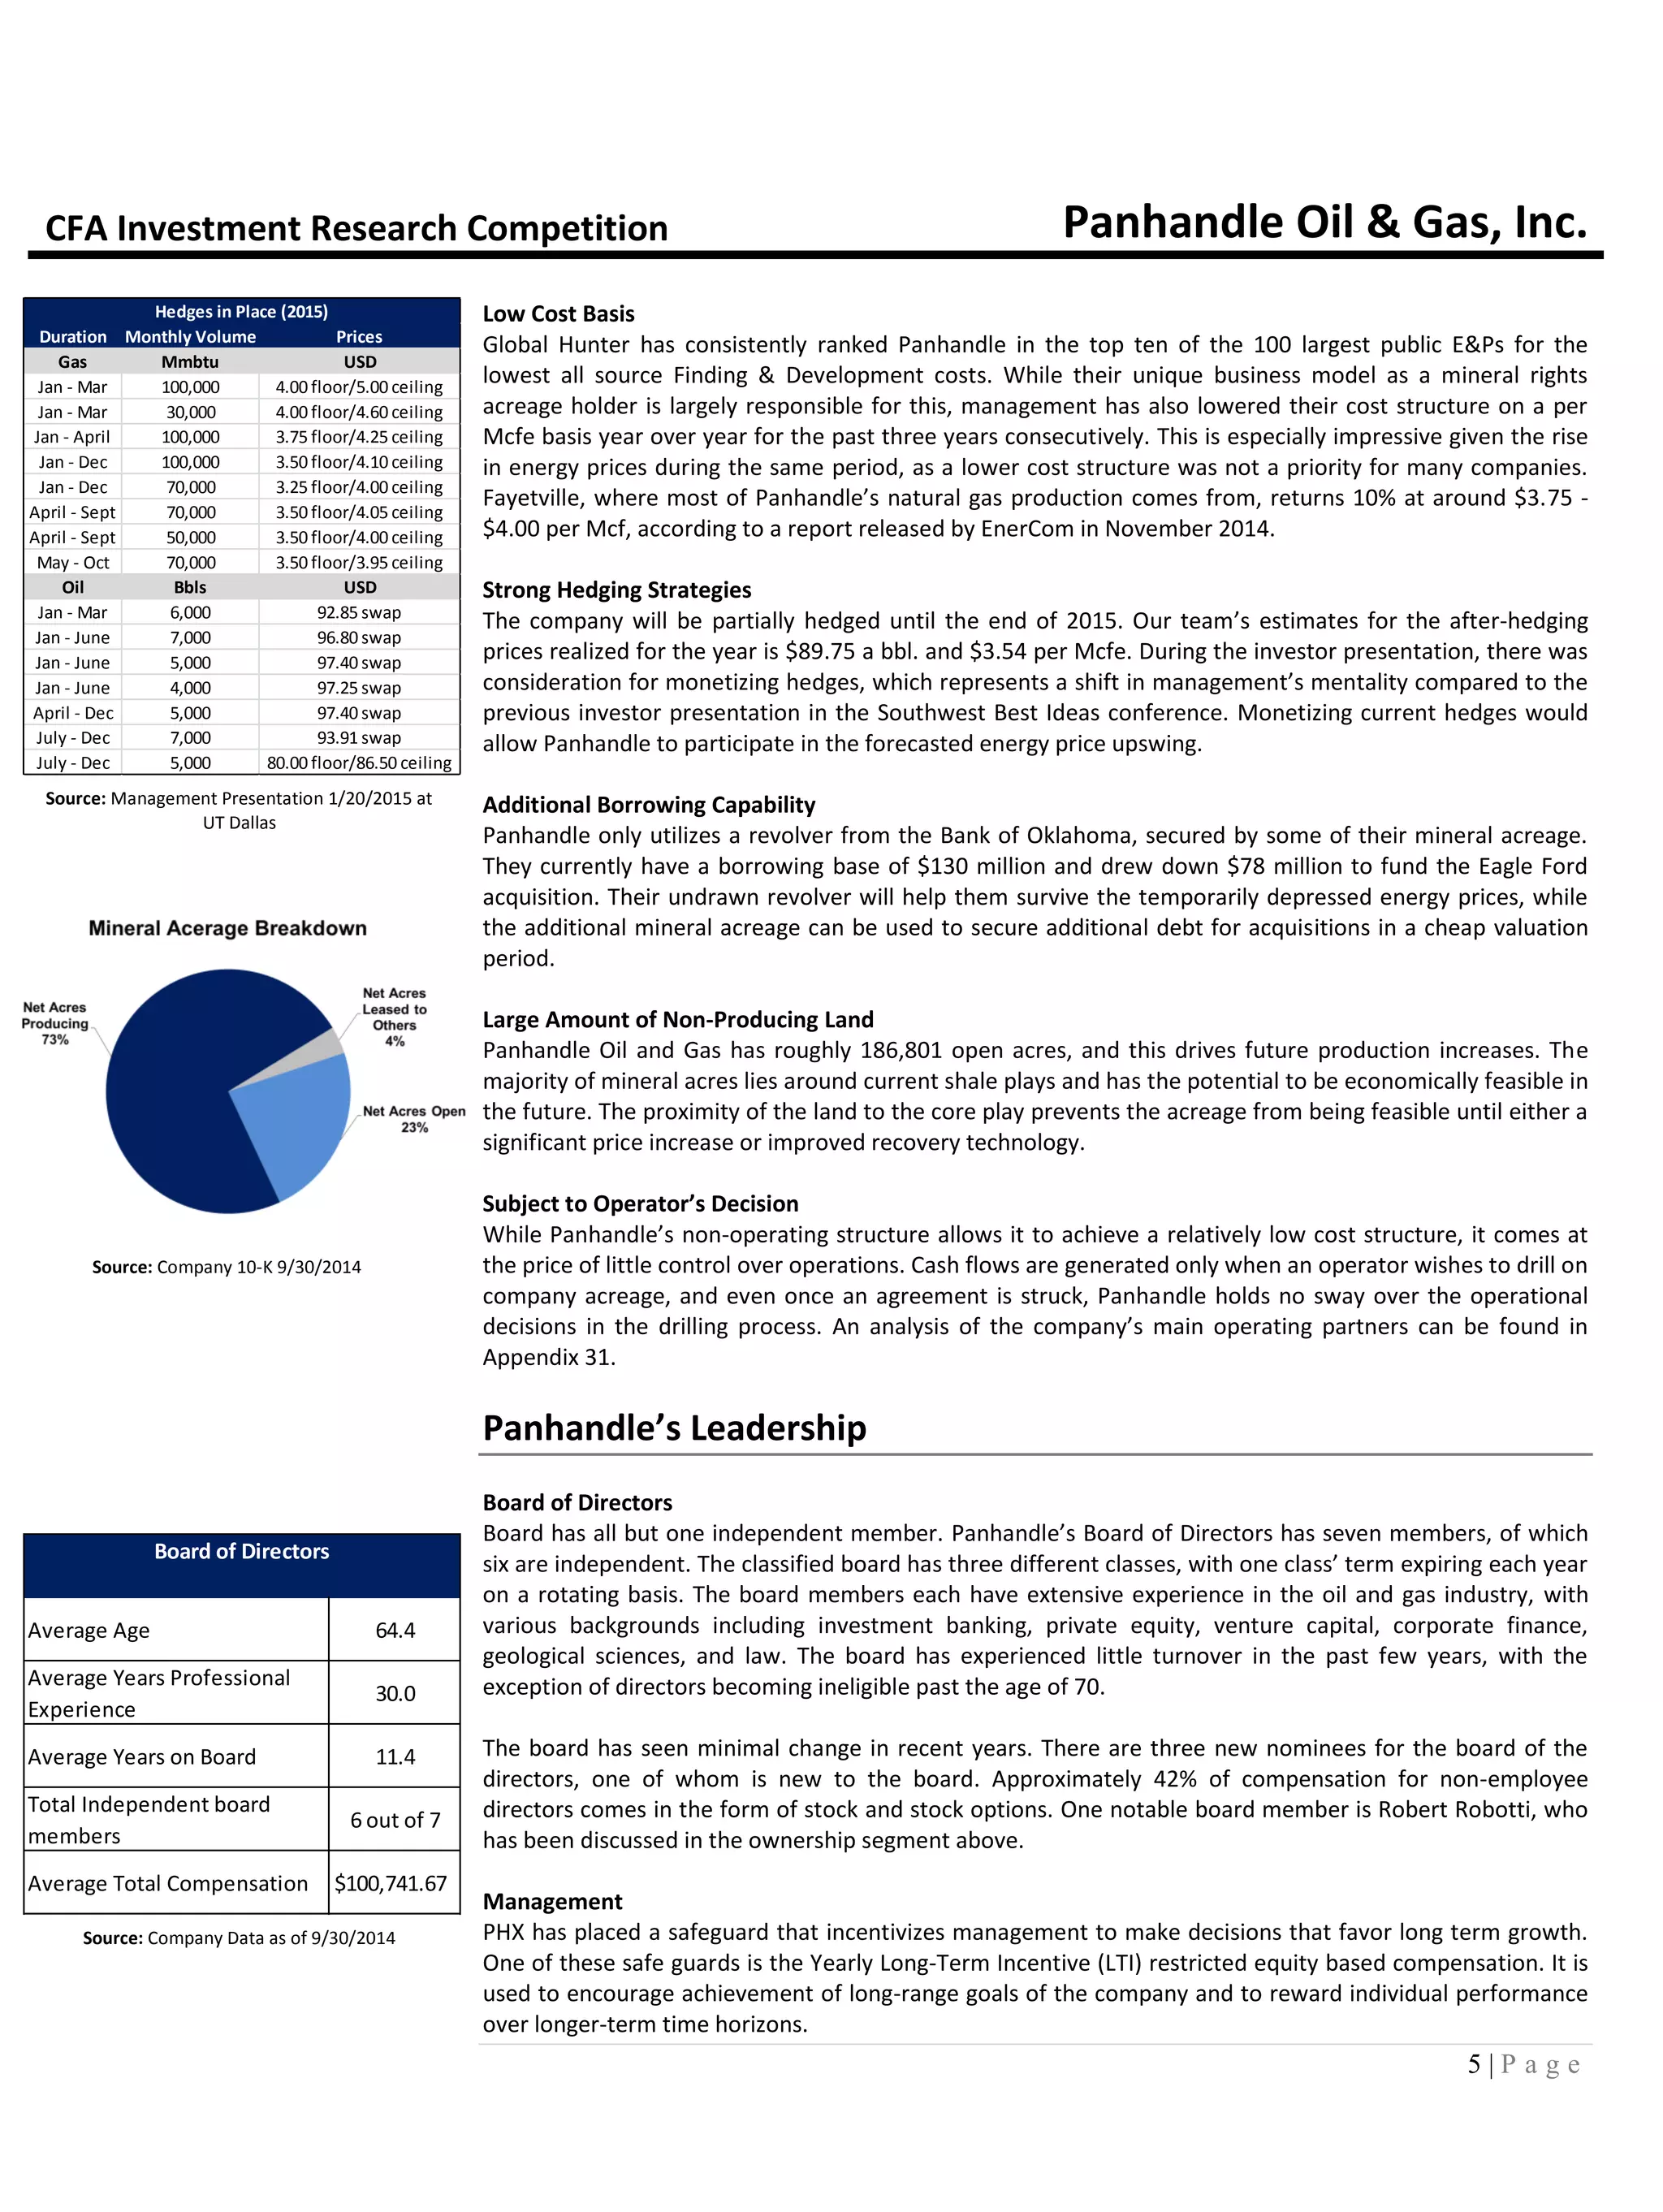
Unparalleled Flexibility
Panhandle enjoys the luxury of choice in its operations. They receive a royalty interest from each well using
their mineral acreage, but they also have the protected right to choose to take a working interest in the
well. This gives Panhandle the ability to judge each well given current and future economic conditions to
ensure a reliable return on capital. If the project does not meet the 20% pre-tax IRR management threshold,
they can simply receive their royalty interest on a small cost basis.
Porter’s 5 Forces](https://image.slidesharecdn.com/364e21ce-01a0-4e4c-8937-6174300075d0-150223020445-conversion-gate02/75/UT-Dallas-CFA-IRC-2015-5-2048.jpg)

![CFA Investment Research Competition Panhandle Oil & Gas
46 | P a g e
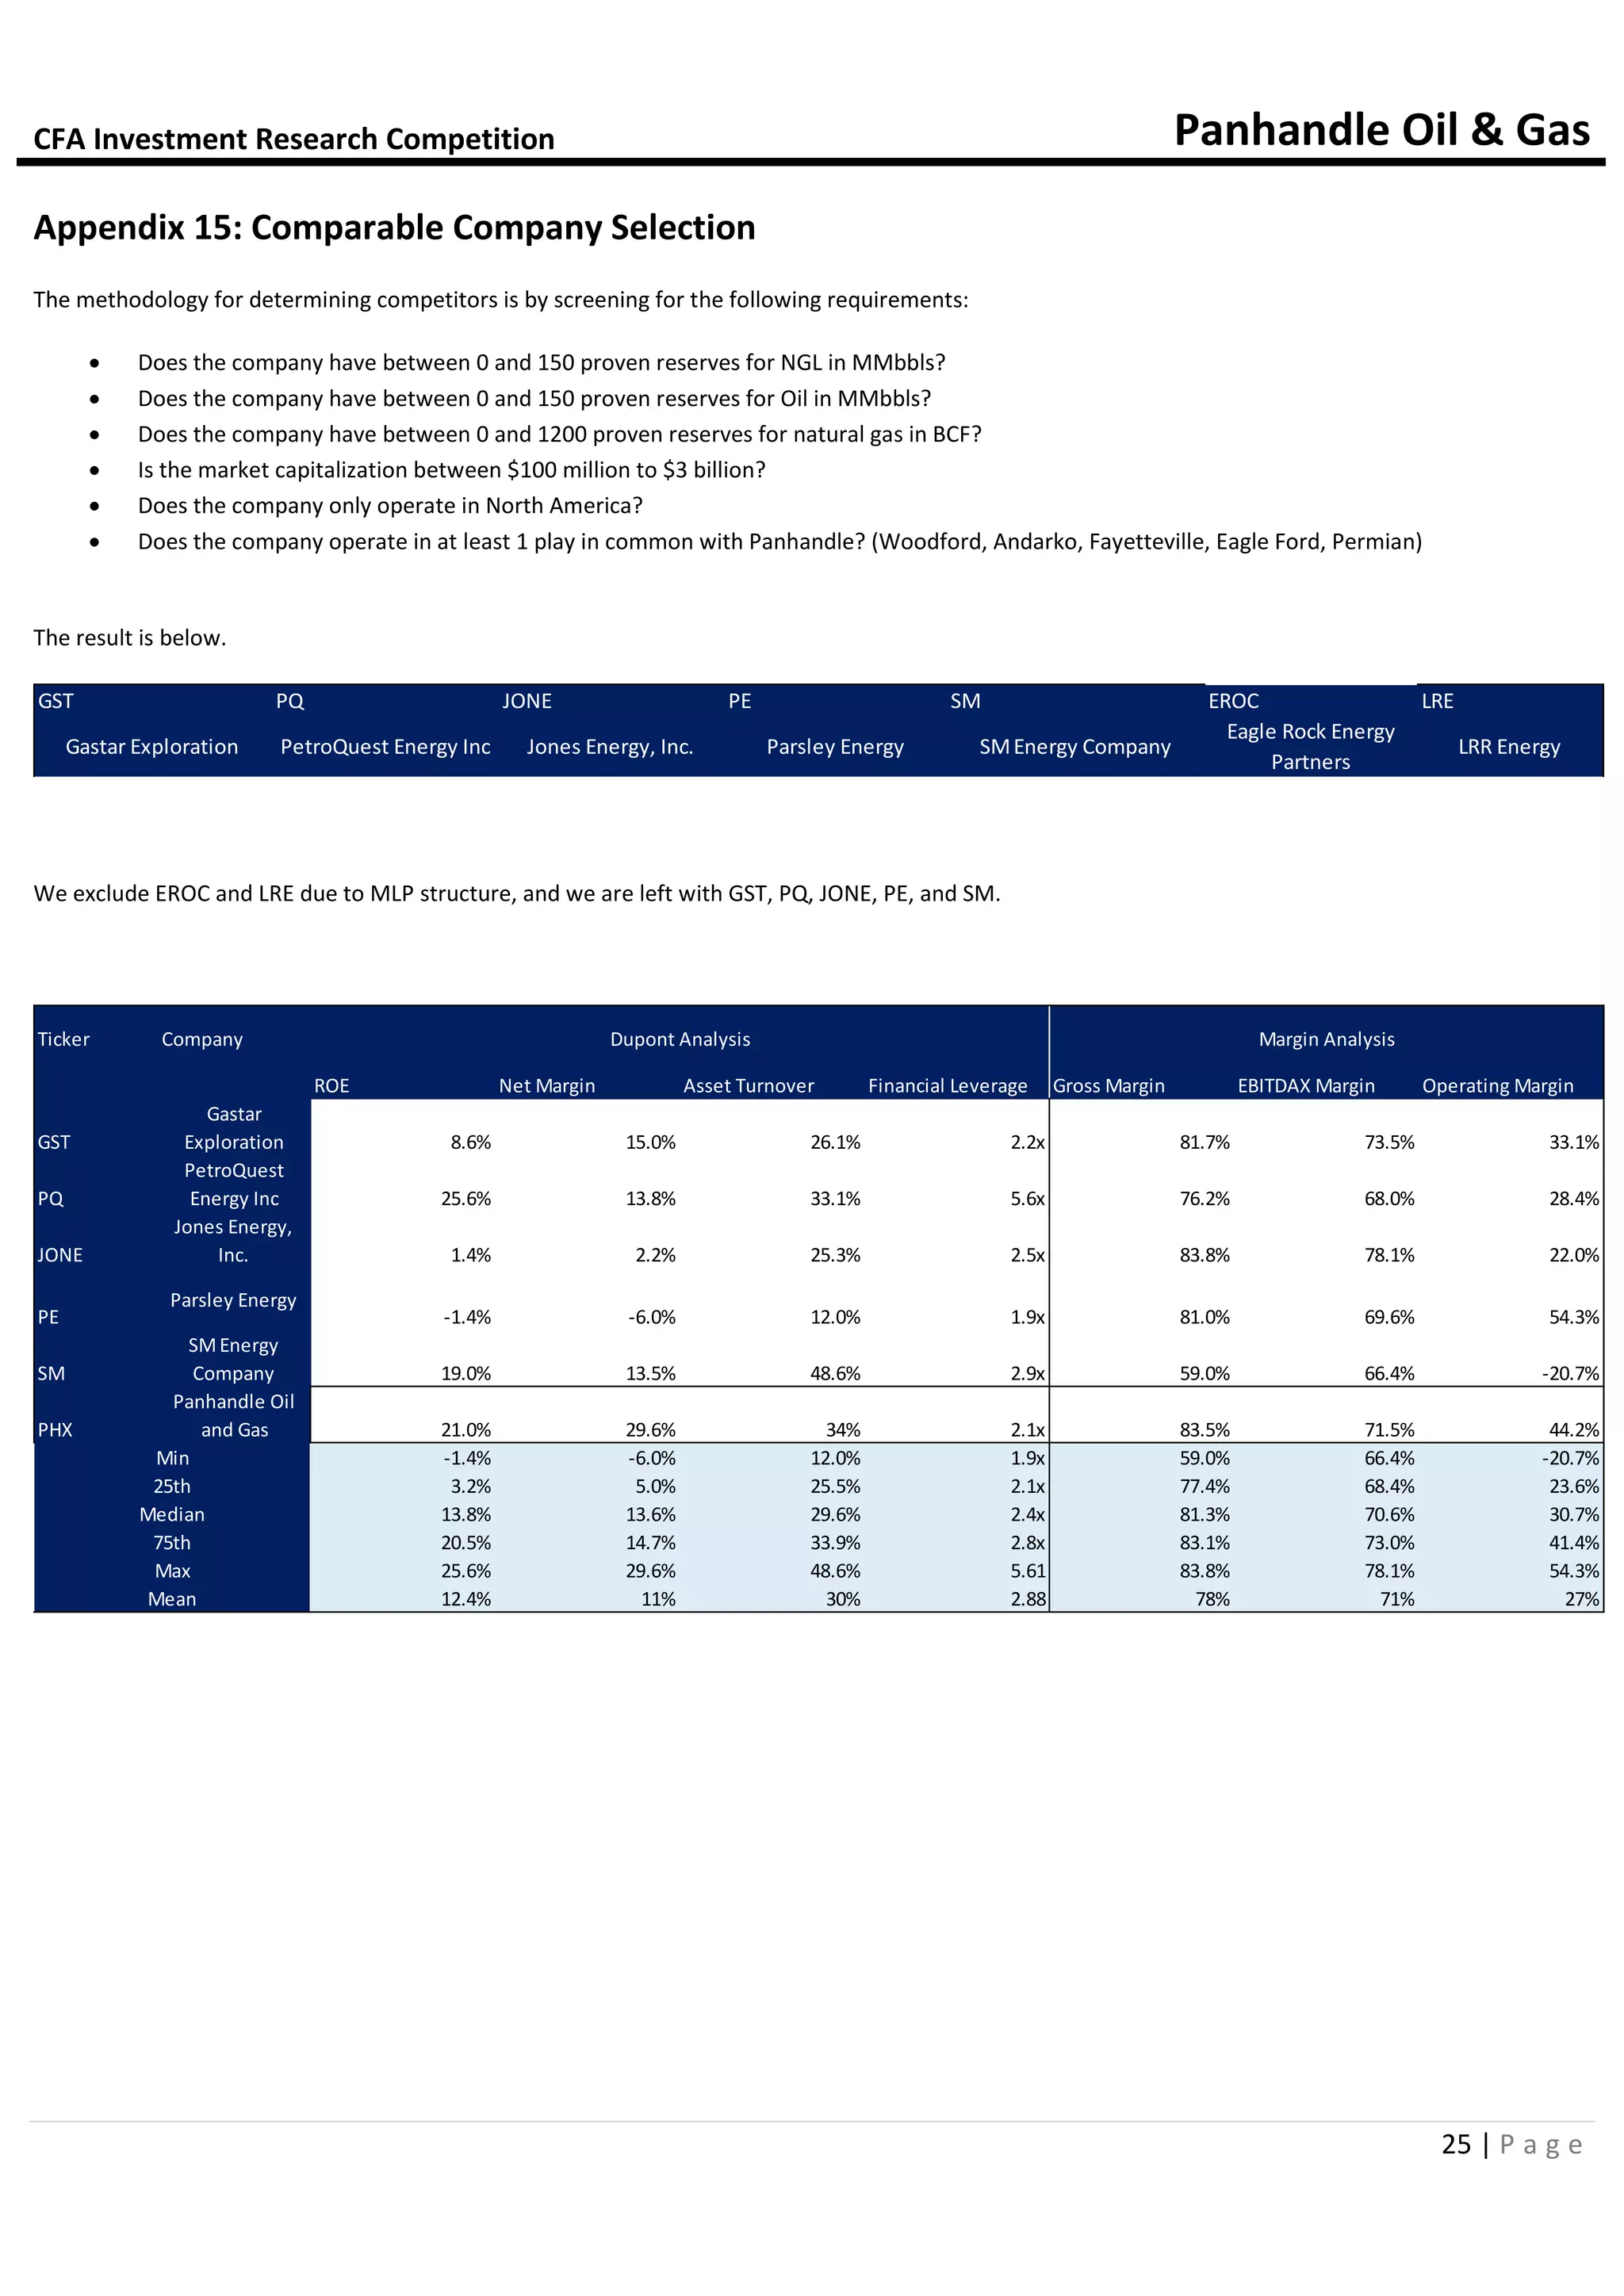
Screening Criteria
1) Industry Classifications: Oil and Gas Exploration and Production (Primary)
2) Geographic Locations: United States of America (Primary)
3) Company Type: Public Company
4) Market Capitalization [Latest] ($USDmm, Historical rate): is greater than 50](https://image.slidesharecdn.com/364e21ce-01a0-4e4c-8937-6174300075d0-150223020445-conversion-gate02/75/UT-Dallas-CFA-IRC-2015-47-2048.jpg)


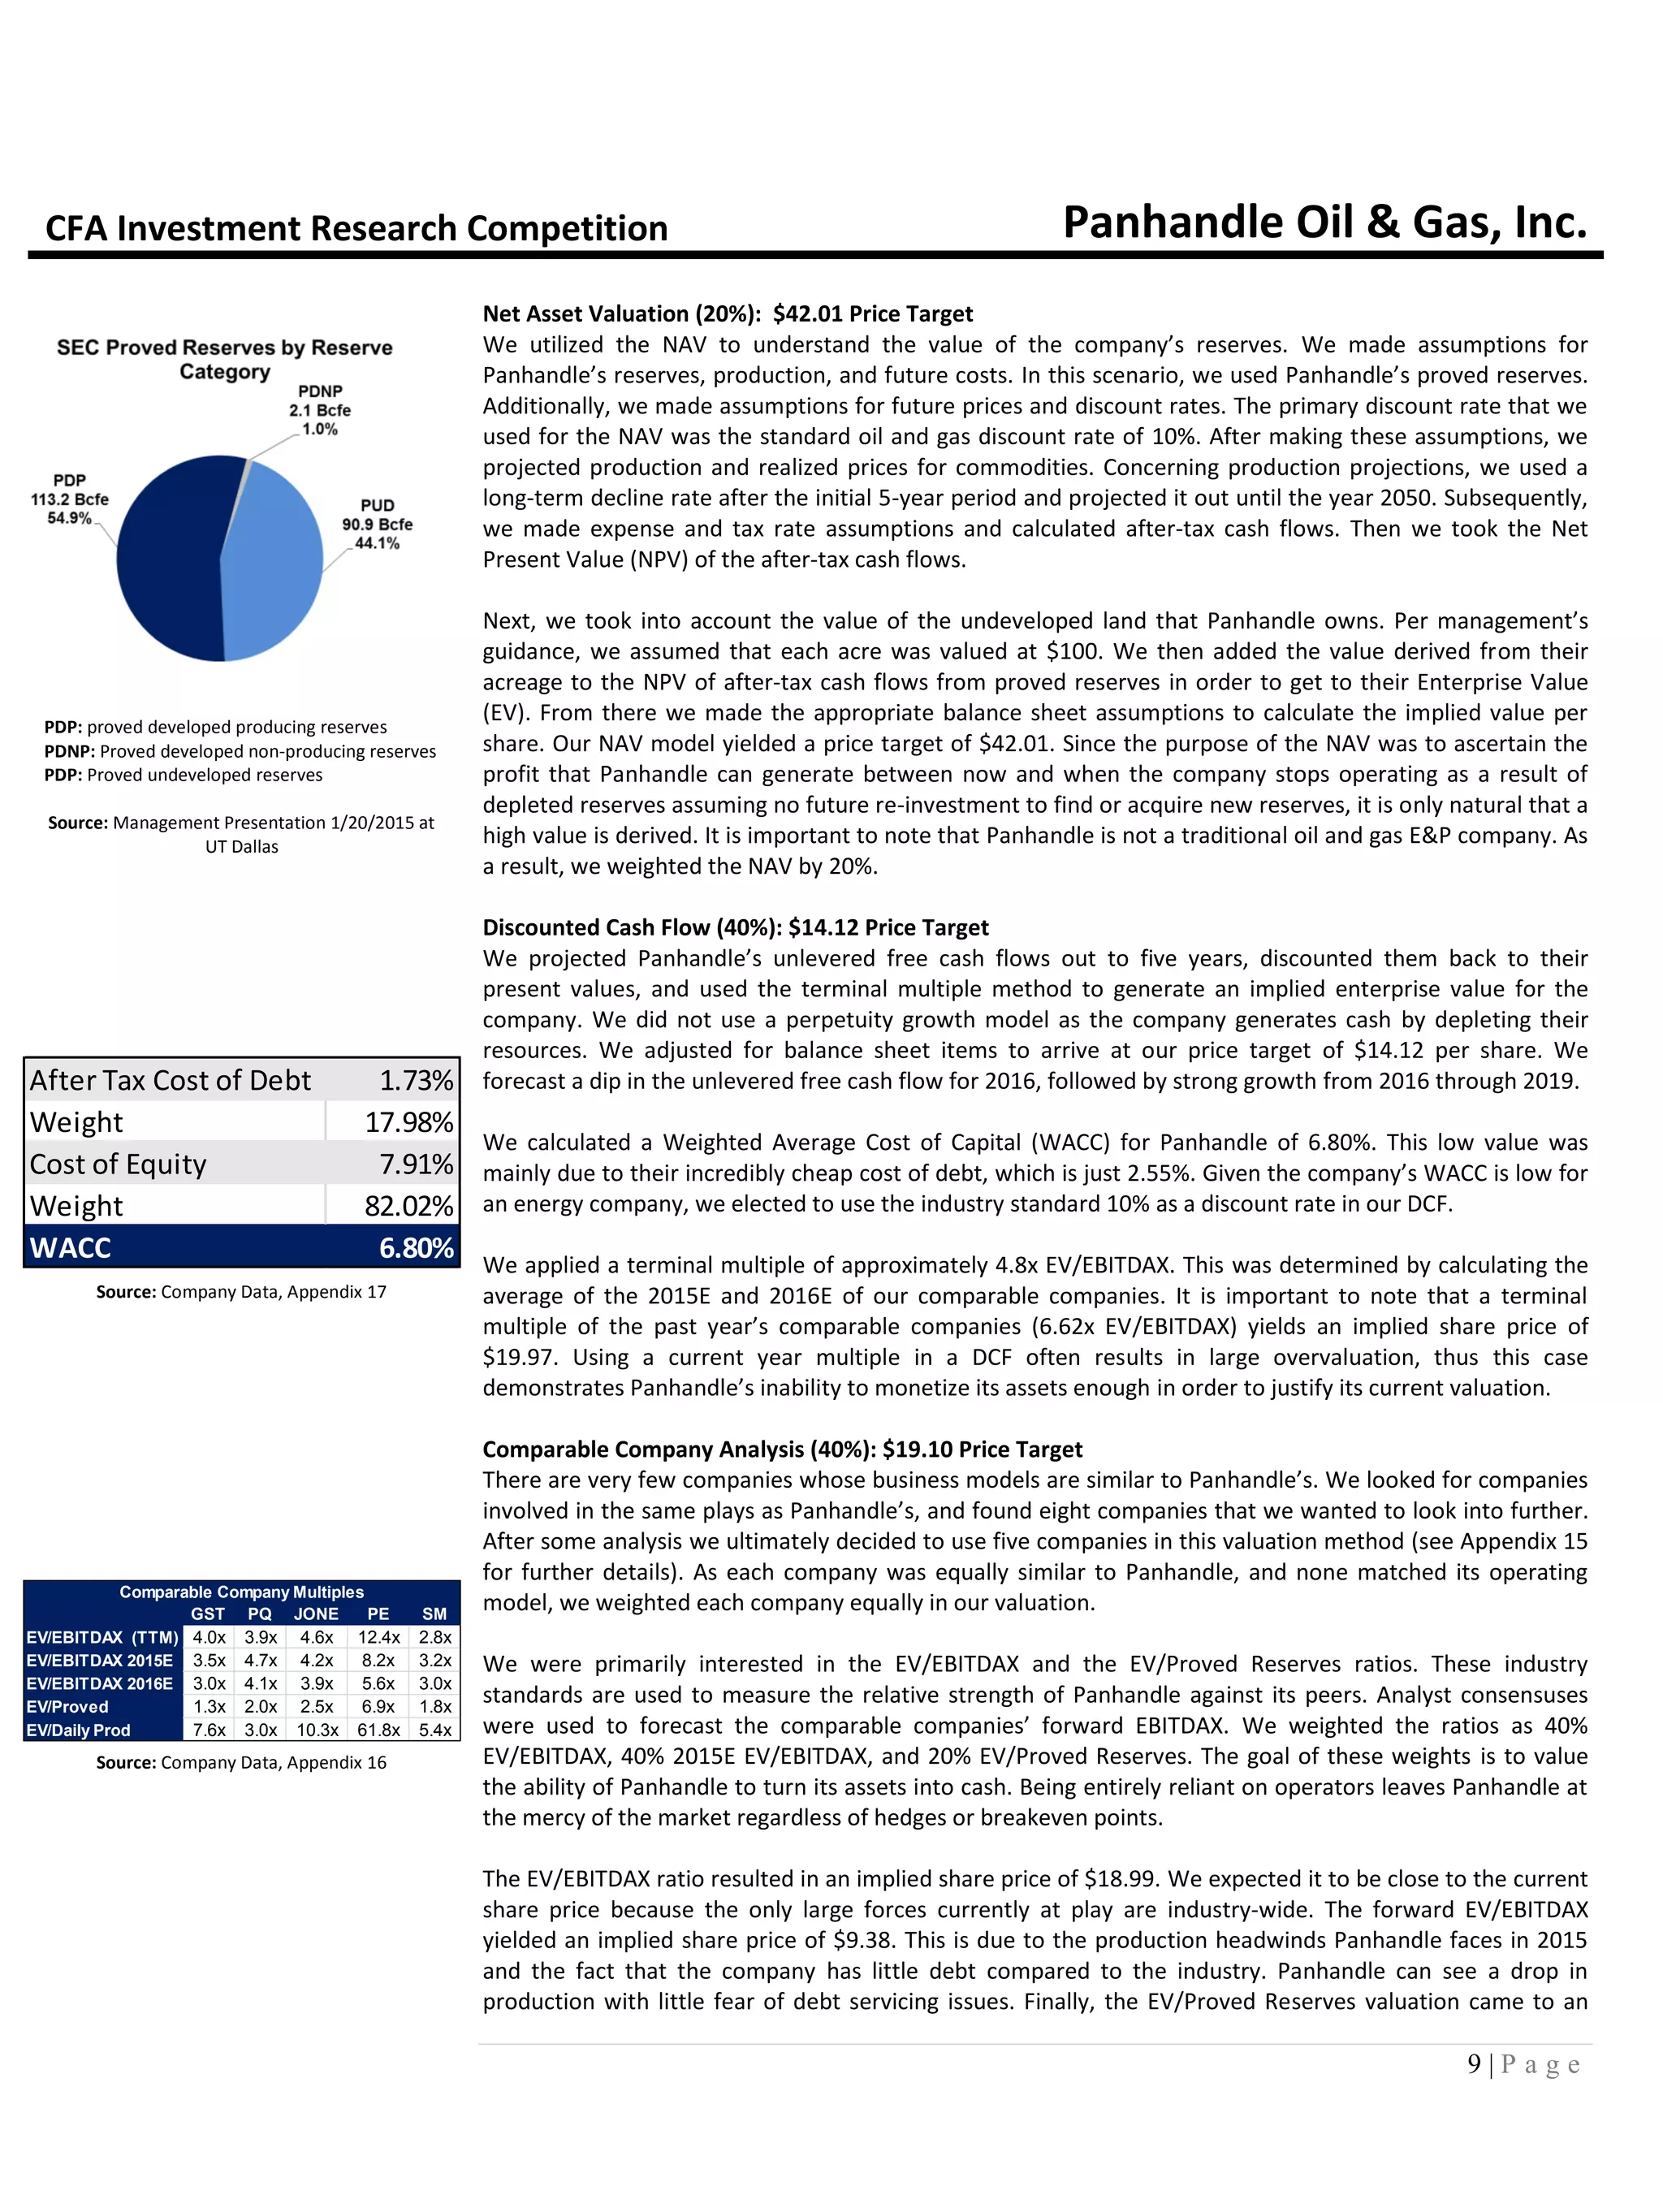
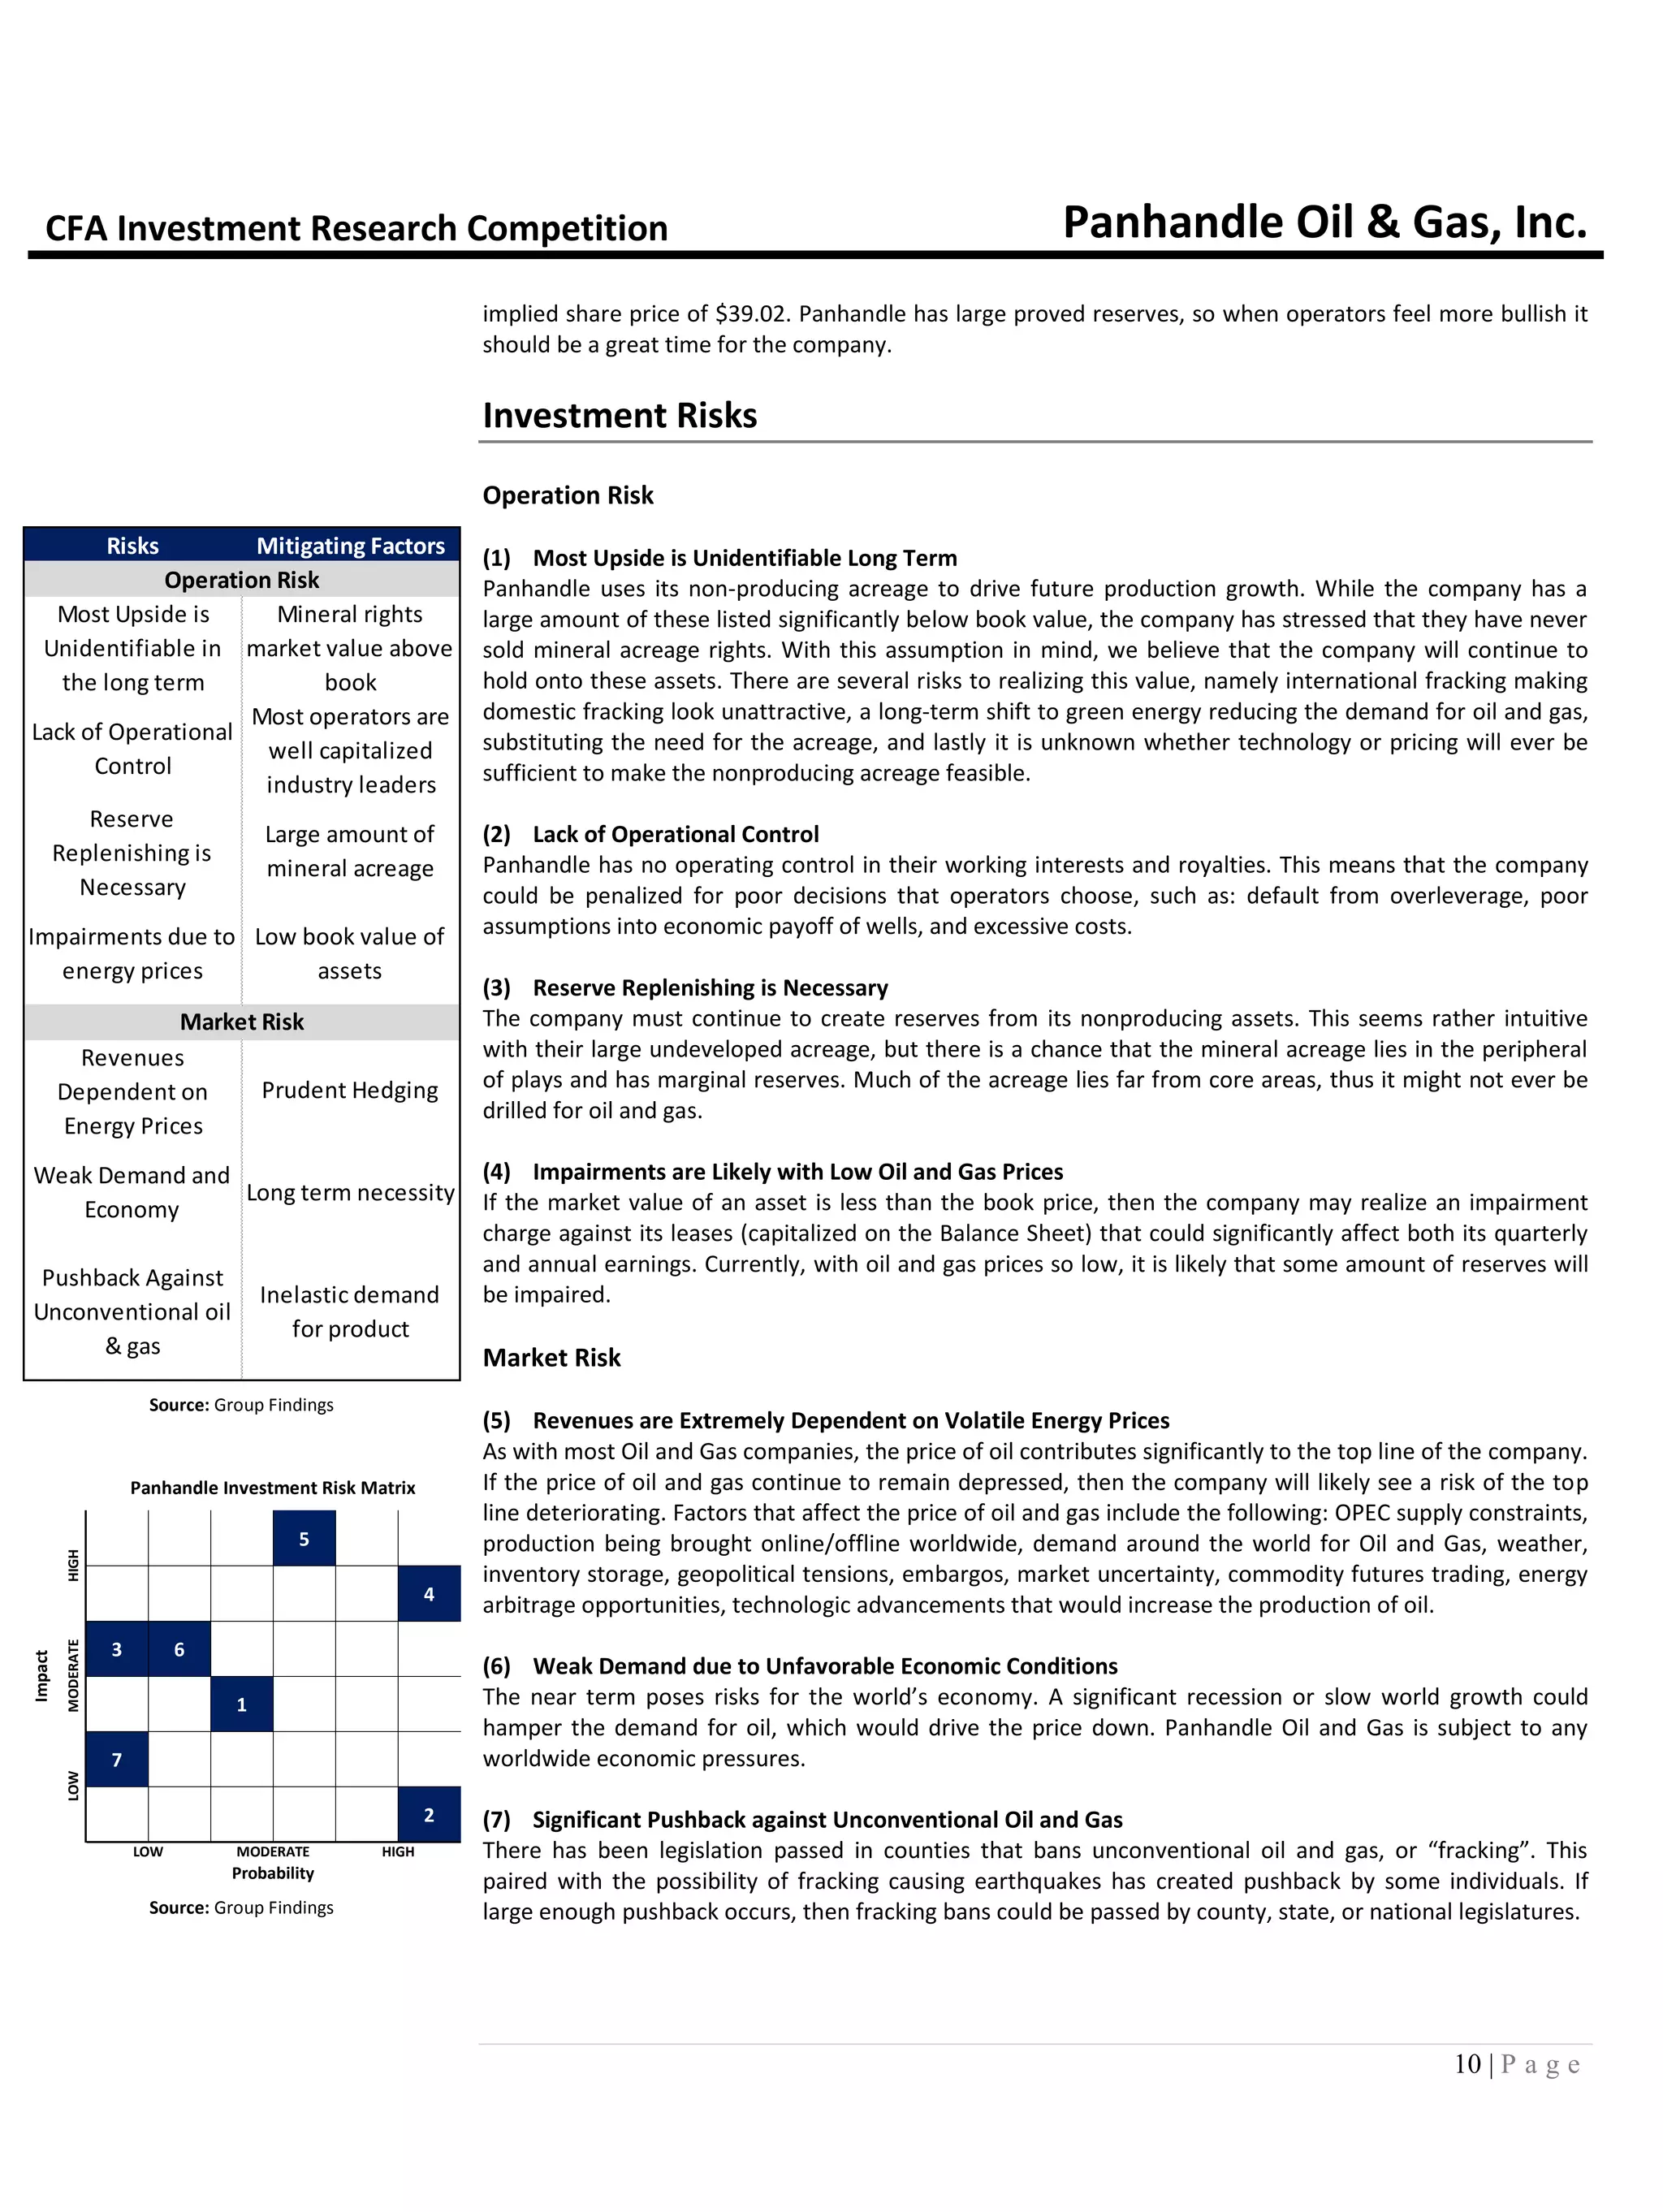
The document provides an overview of Panhandle Oil & Gas Inc. including its business model, assets, financials, and the macroeconomic outlook for oil and natural gas prices. Panhandle owns mineral rights that it can elect to receive royalties or working interests from. It has a large amount of low-cost mineral acreage but lacks control over operations to monetize assets. The company is well positioned to weather a downturn due to its strong balance sheet and ability to acquire additional assets. However, its revenue is entirely dependent on energy prices which are facing oversupply issues and weak demand internationally.


