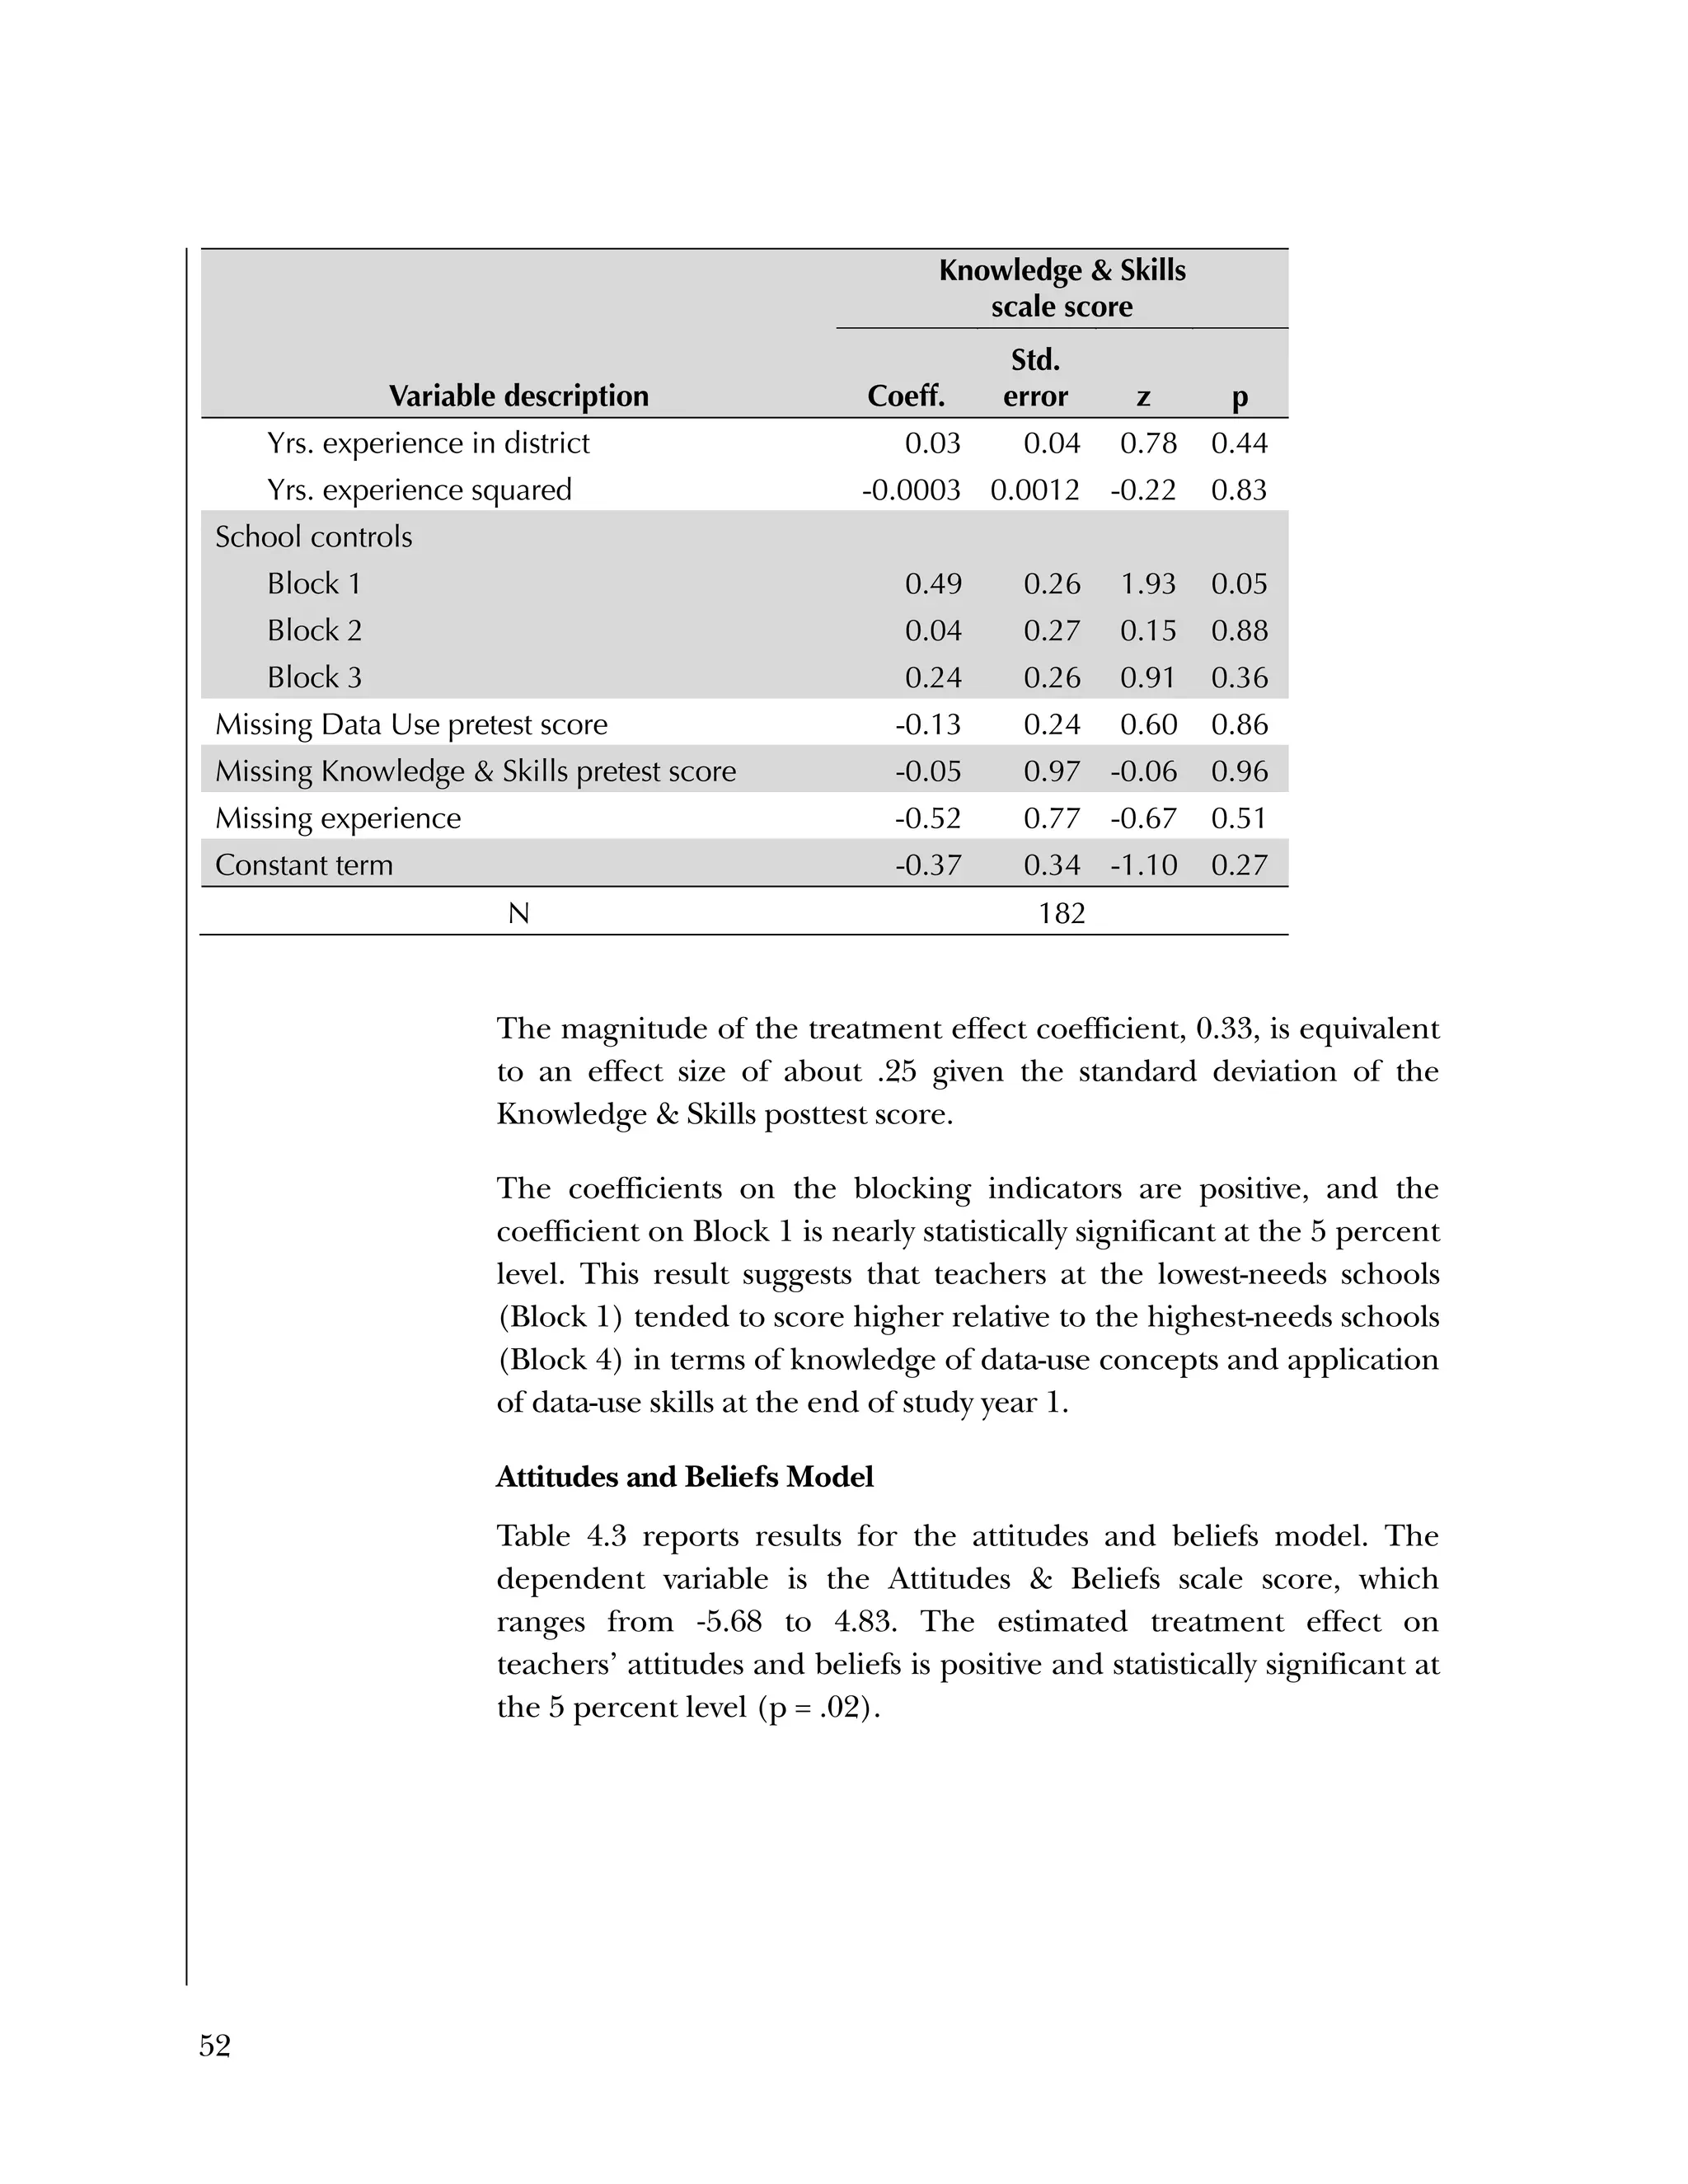
This randomized controlled trial evaluated the efficacy of the Using Data program in improving teacher practices and student achievement in mathematics. Sixty schools were randomly assigned to treatment and control conditions. The study found that after one year, teachers in the treatment schools reported more frequent data use, greater data literacy, and more positive attitudes towards using data compared to the control teachers. For students, no overall effect was found after two years. However, students of teachers in the lowest performing schools at baseline who received the intervention showed moderate improvements in mathematics achievement. The study provides preliminary evidence that the Using Data program can improve teacher practices and student outcomes in high-needs schools.


![Used to identify
Classification level
37
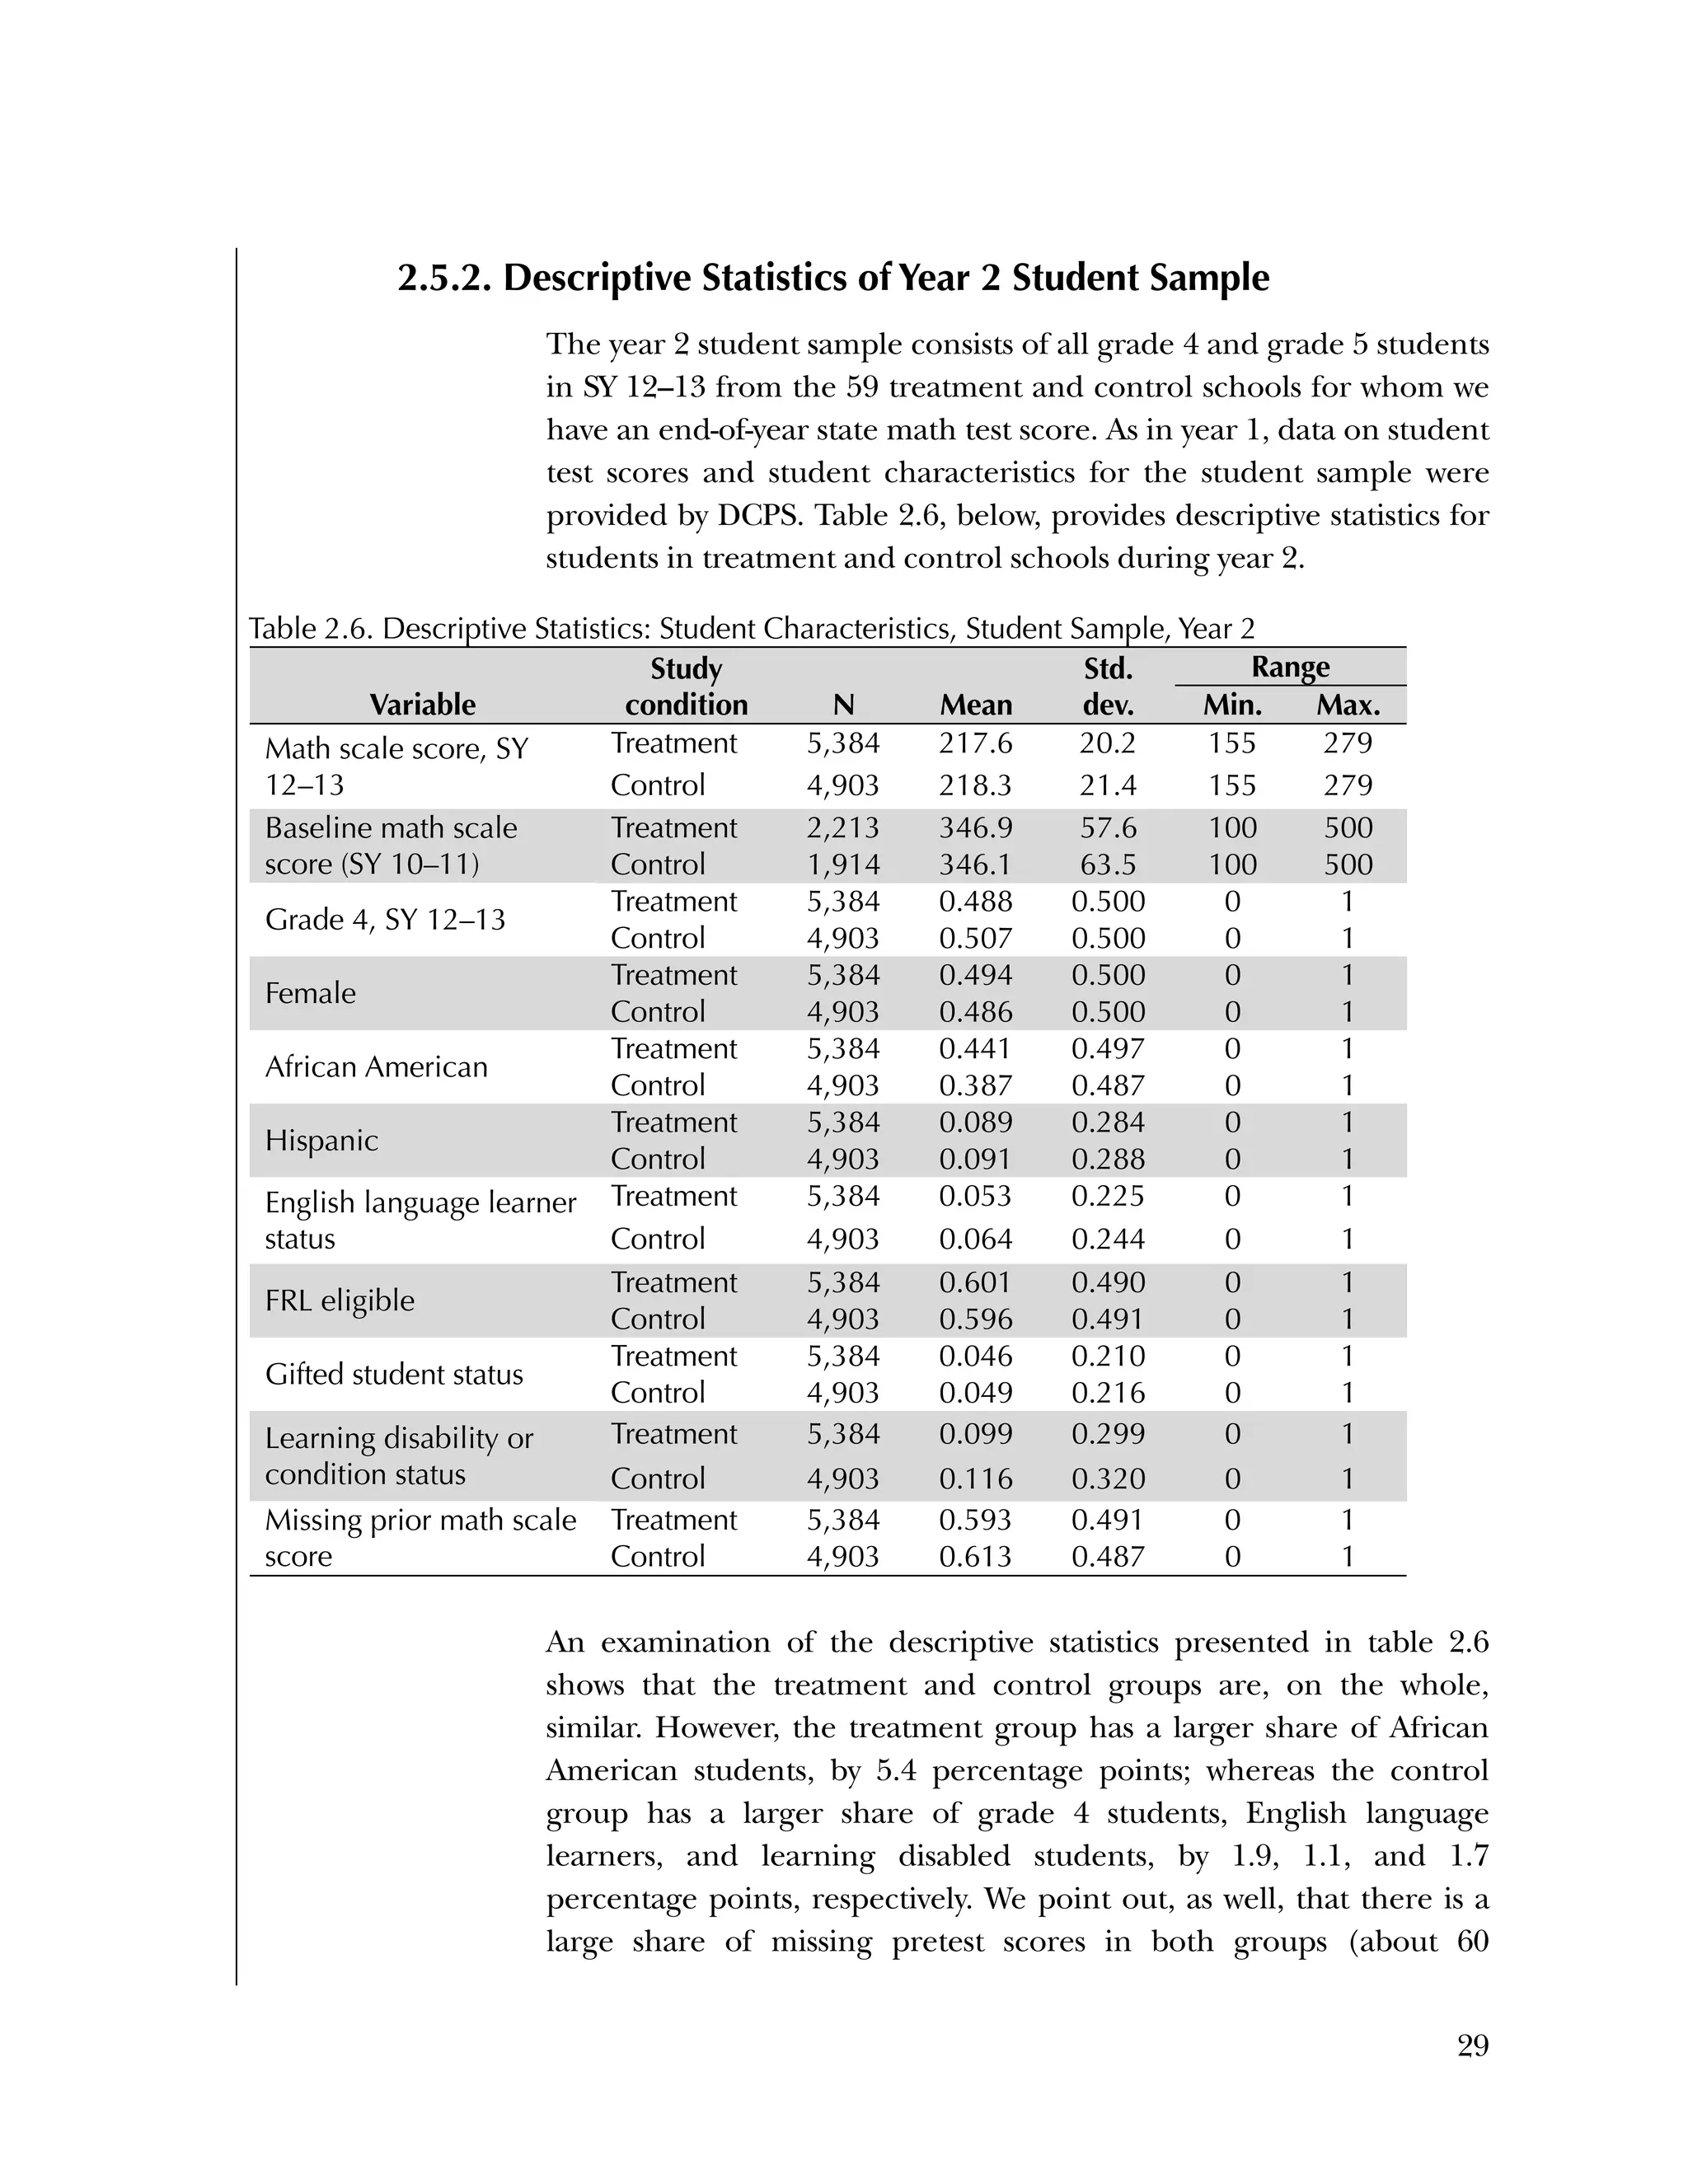
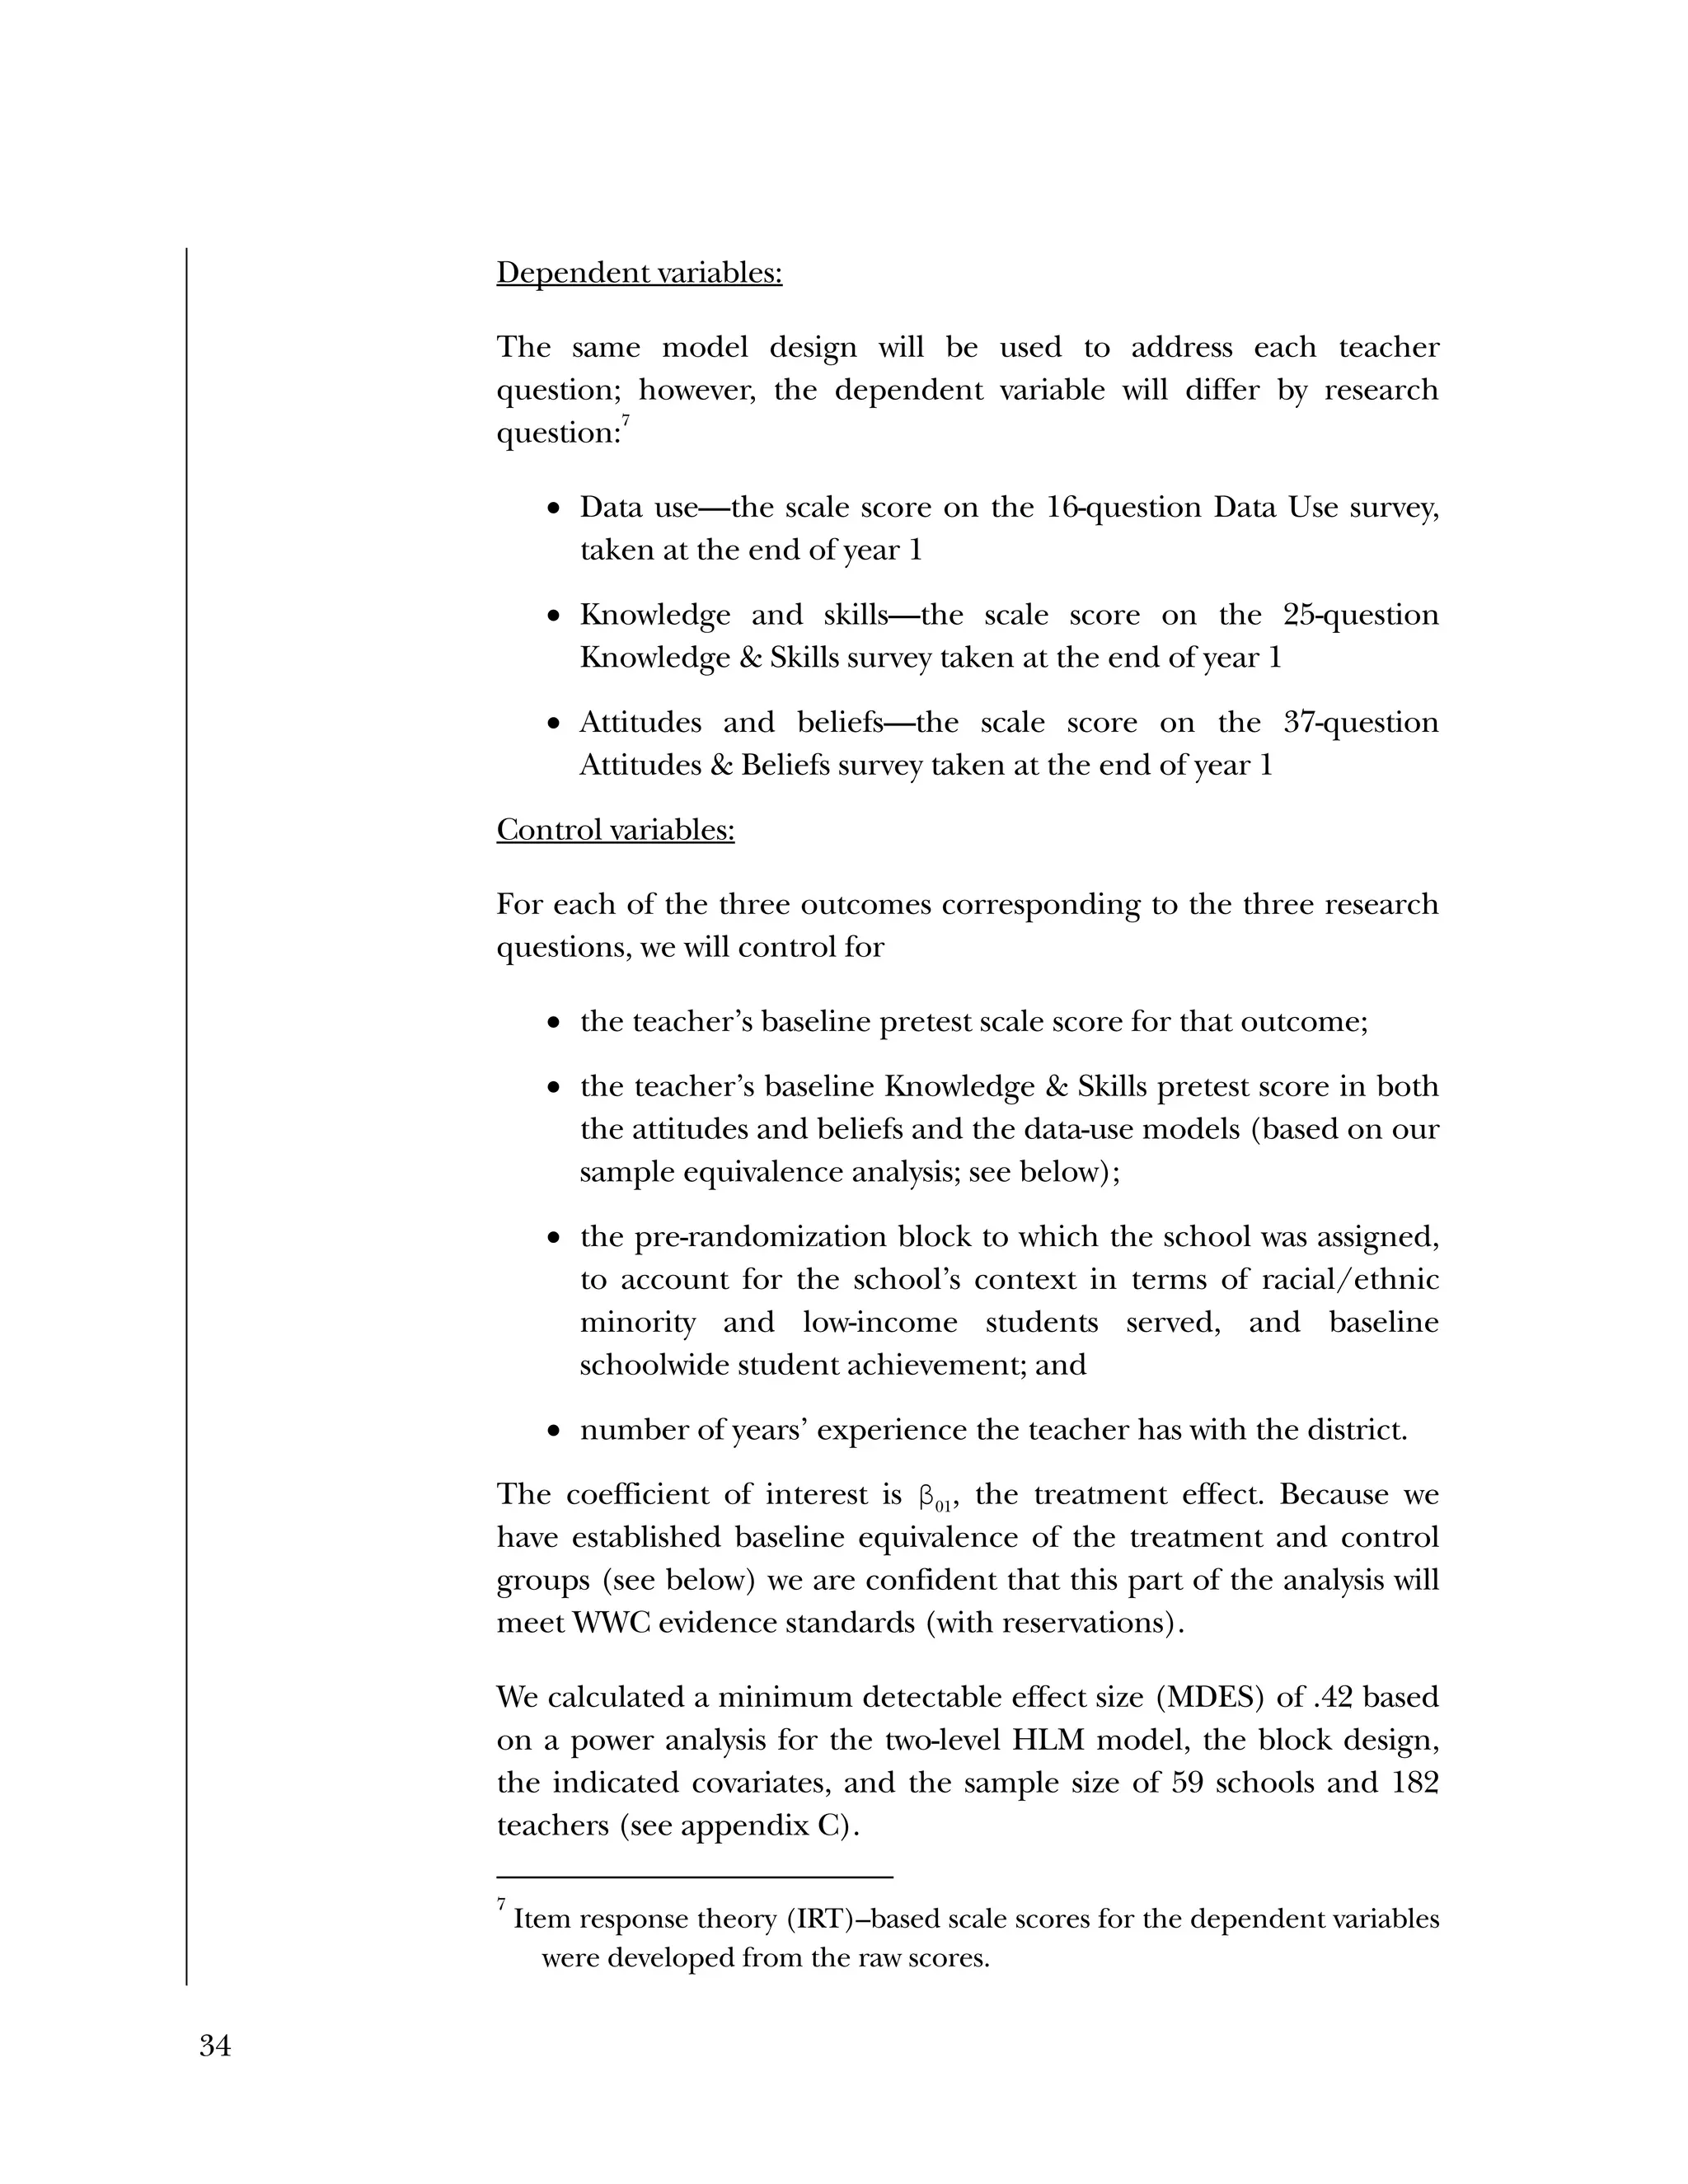
Tj
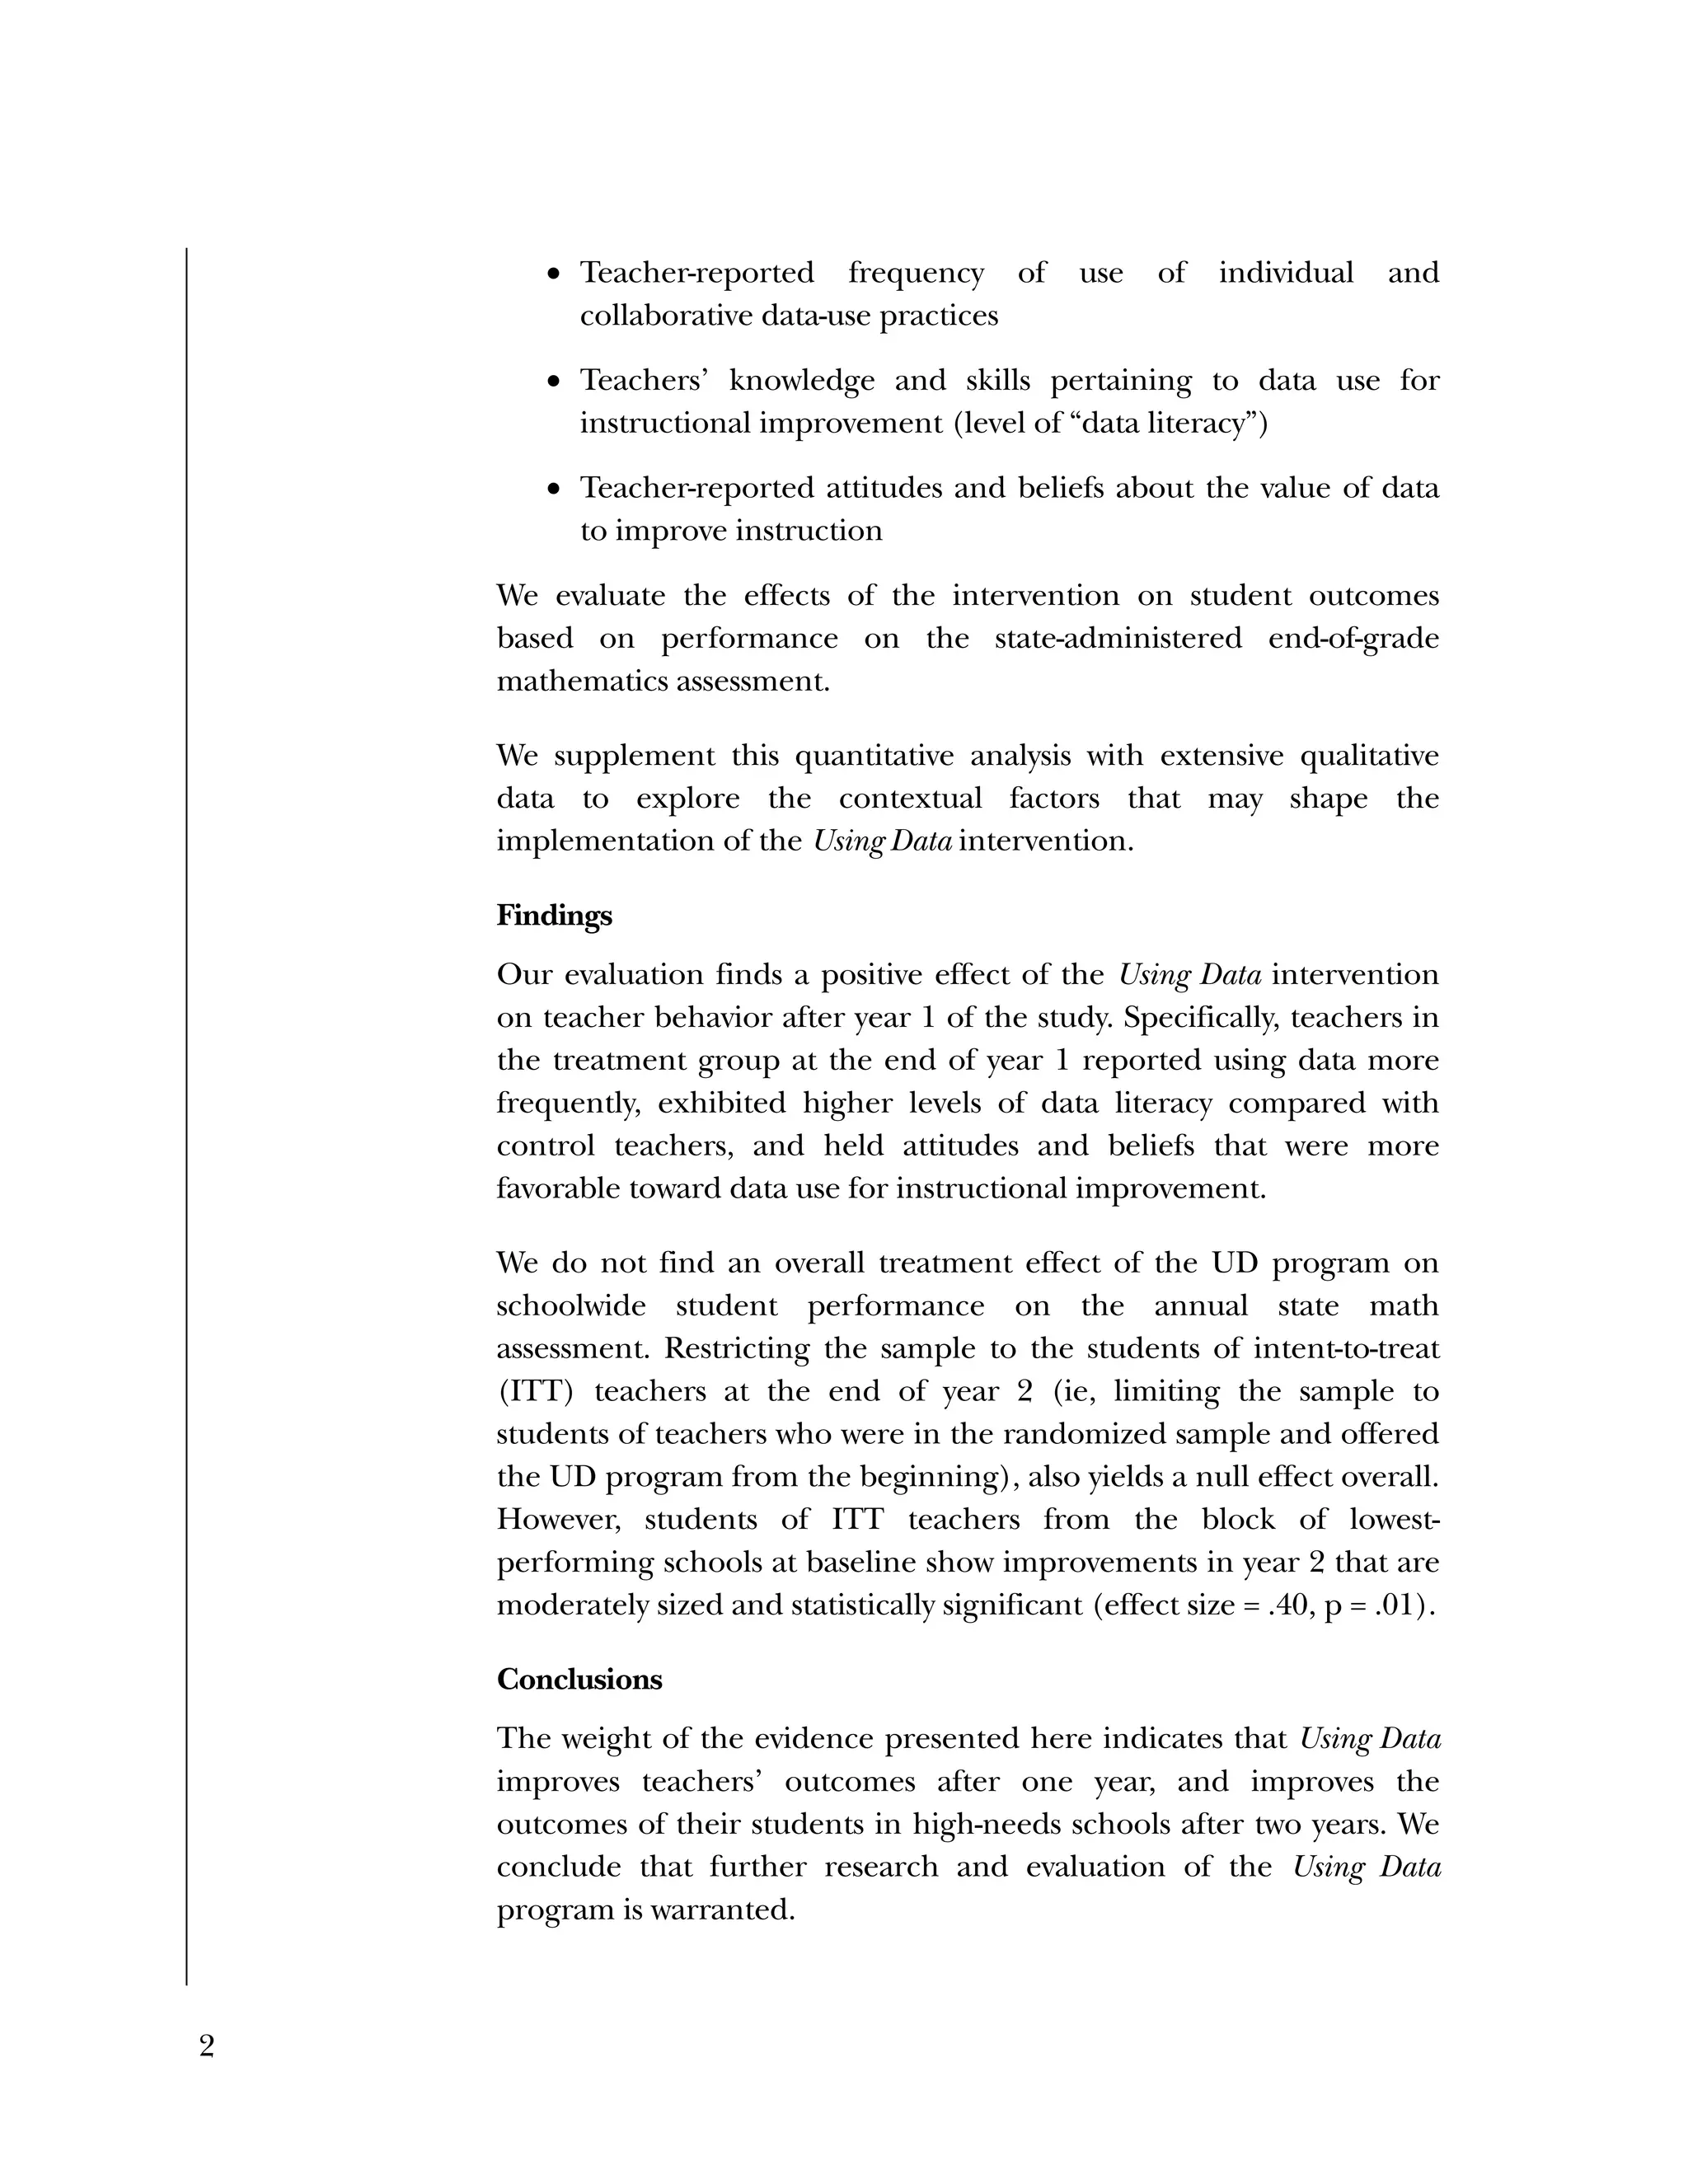
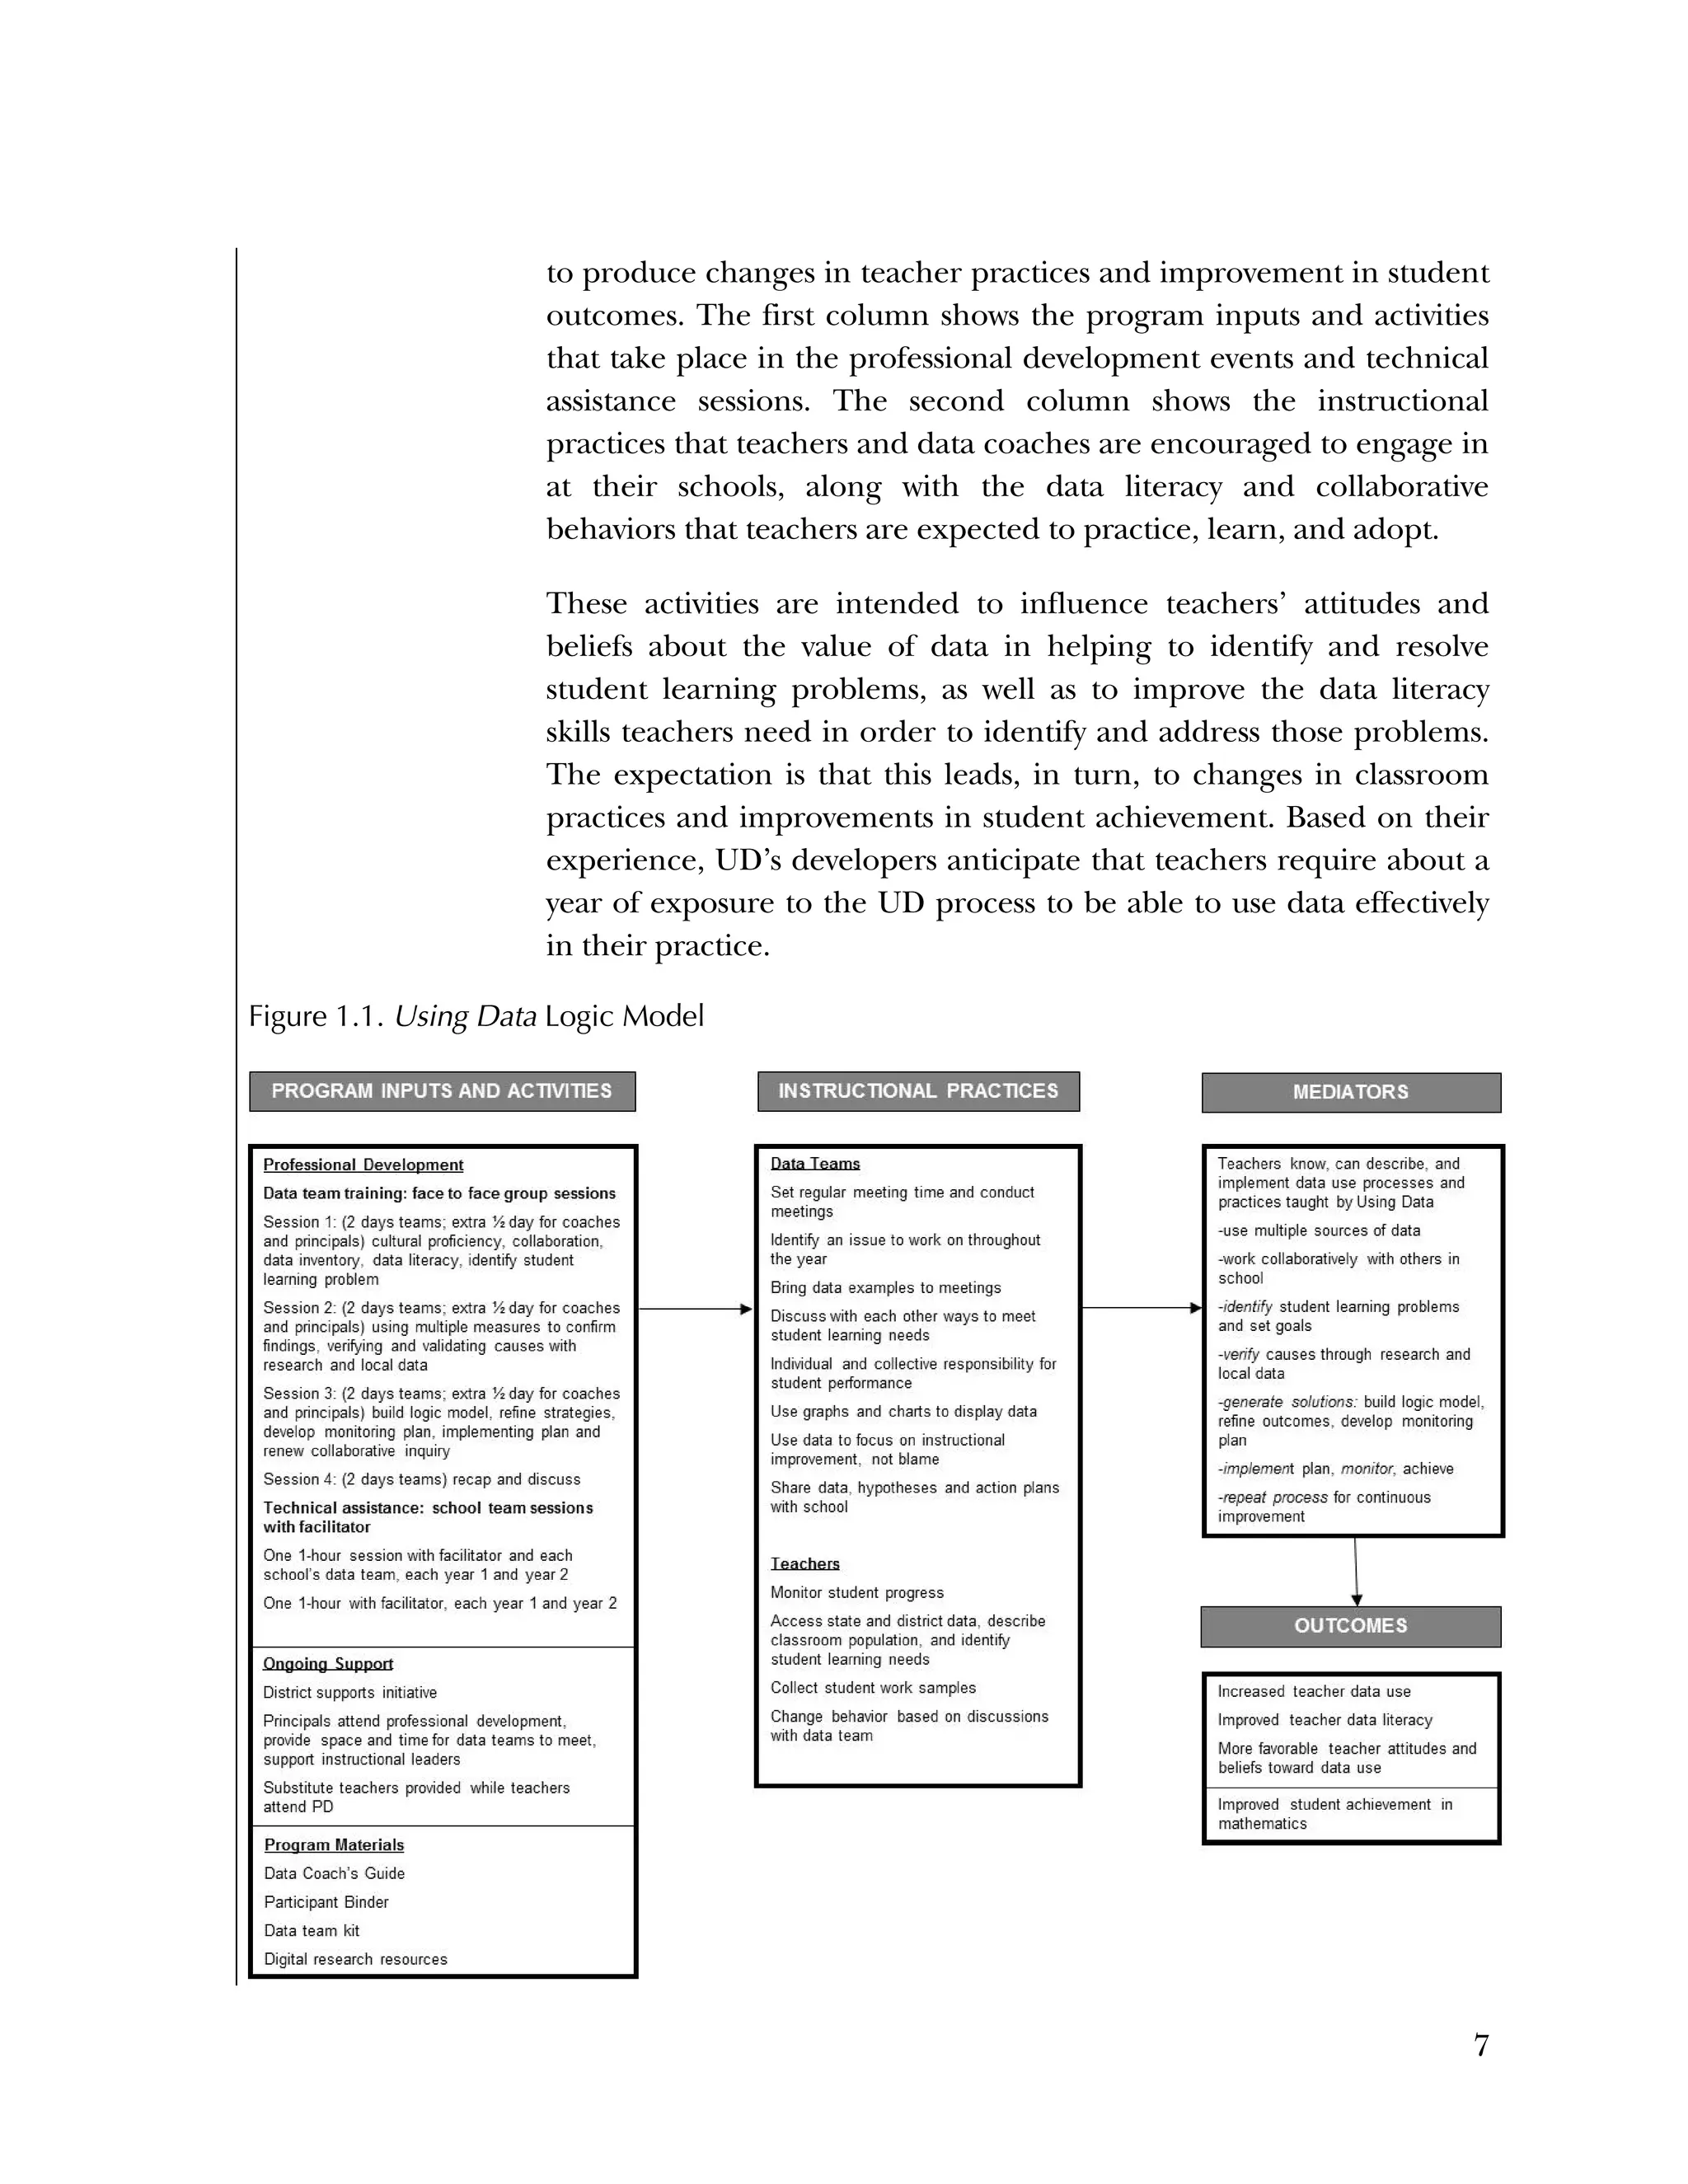
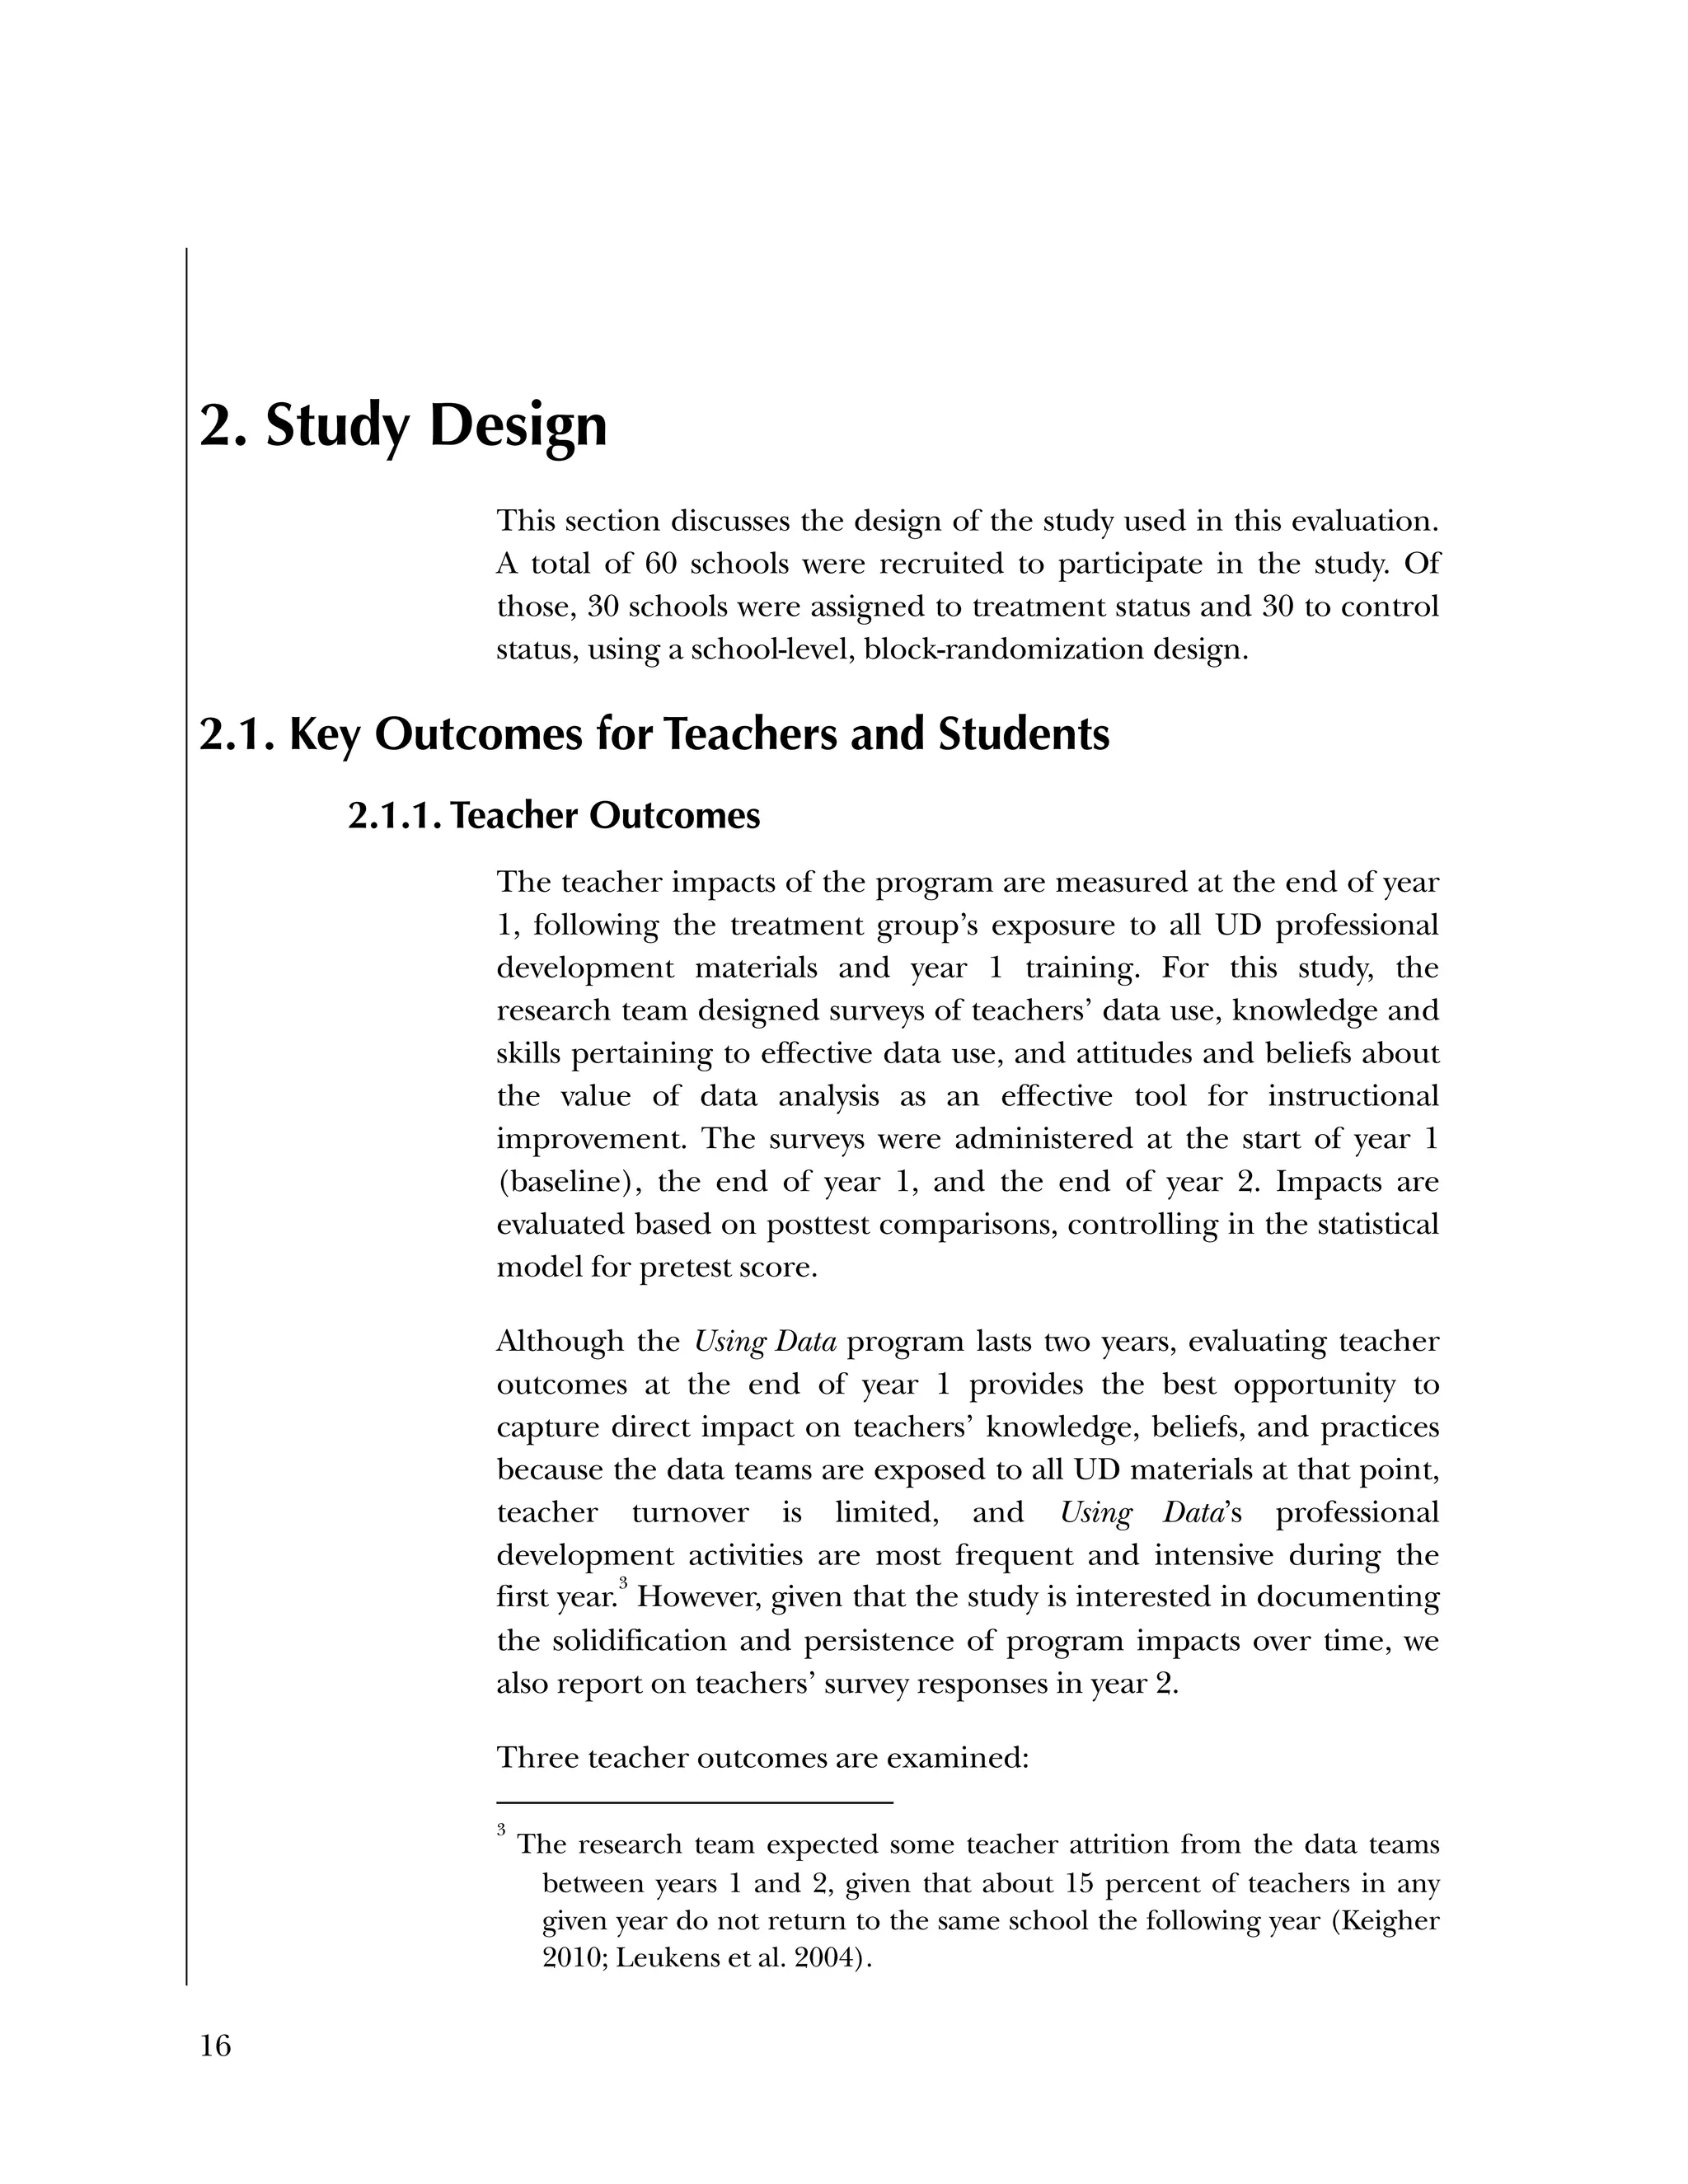
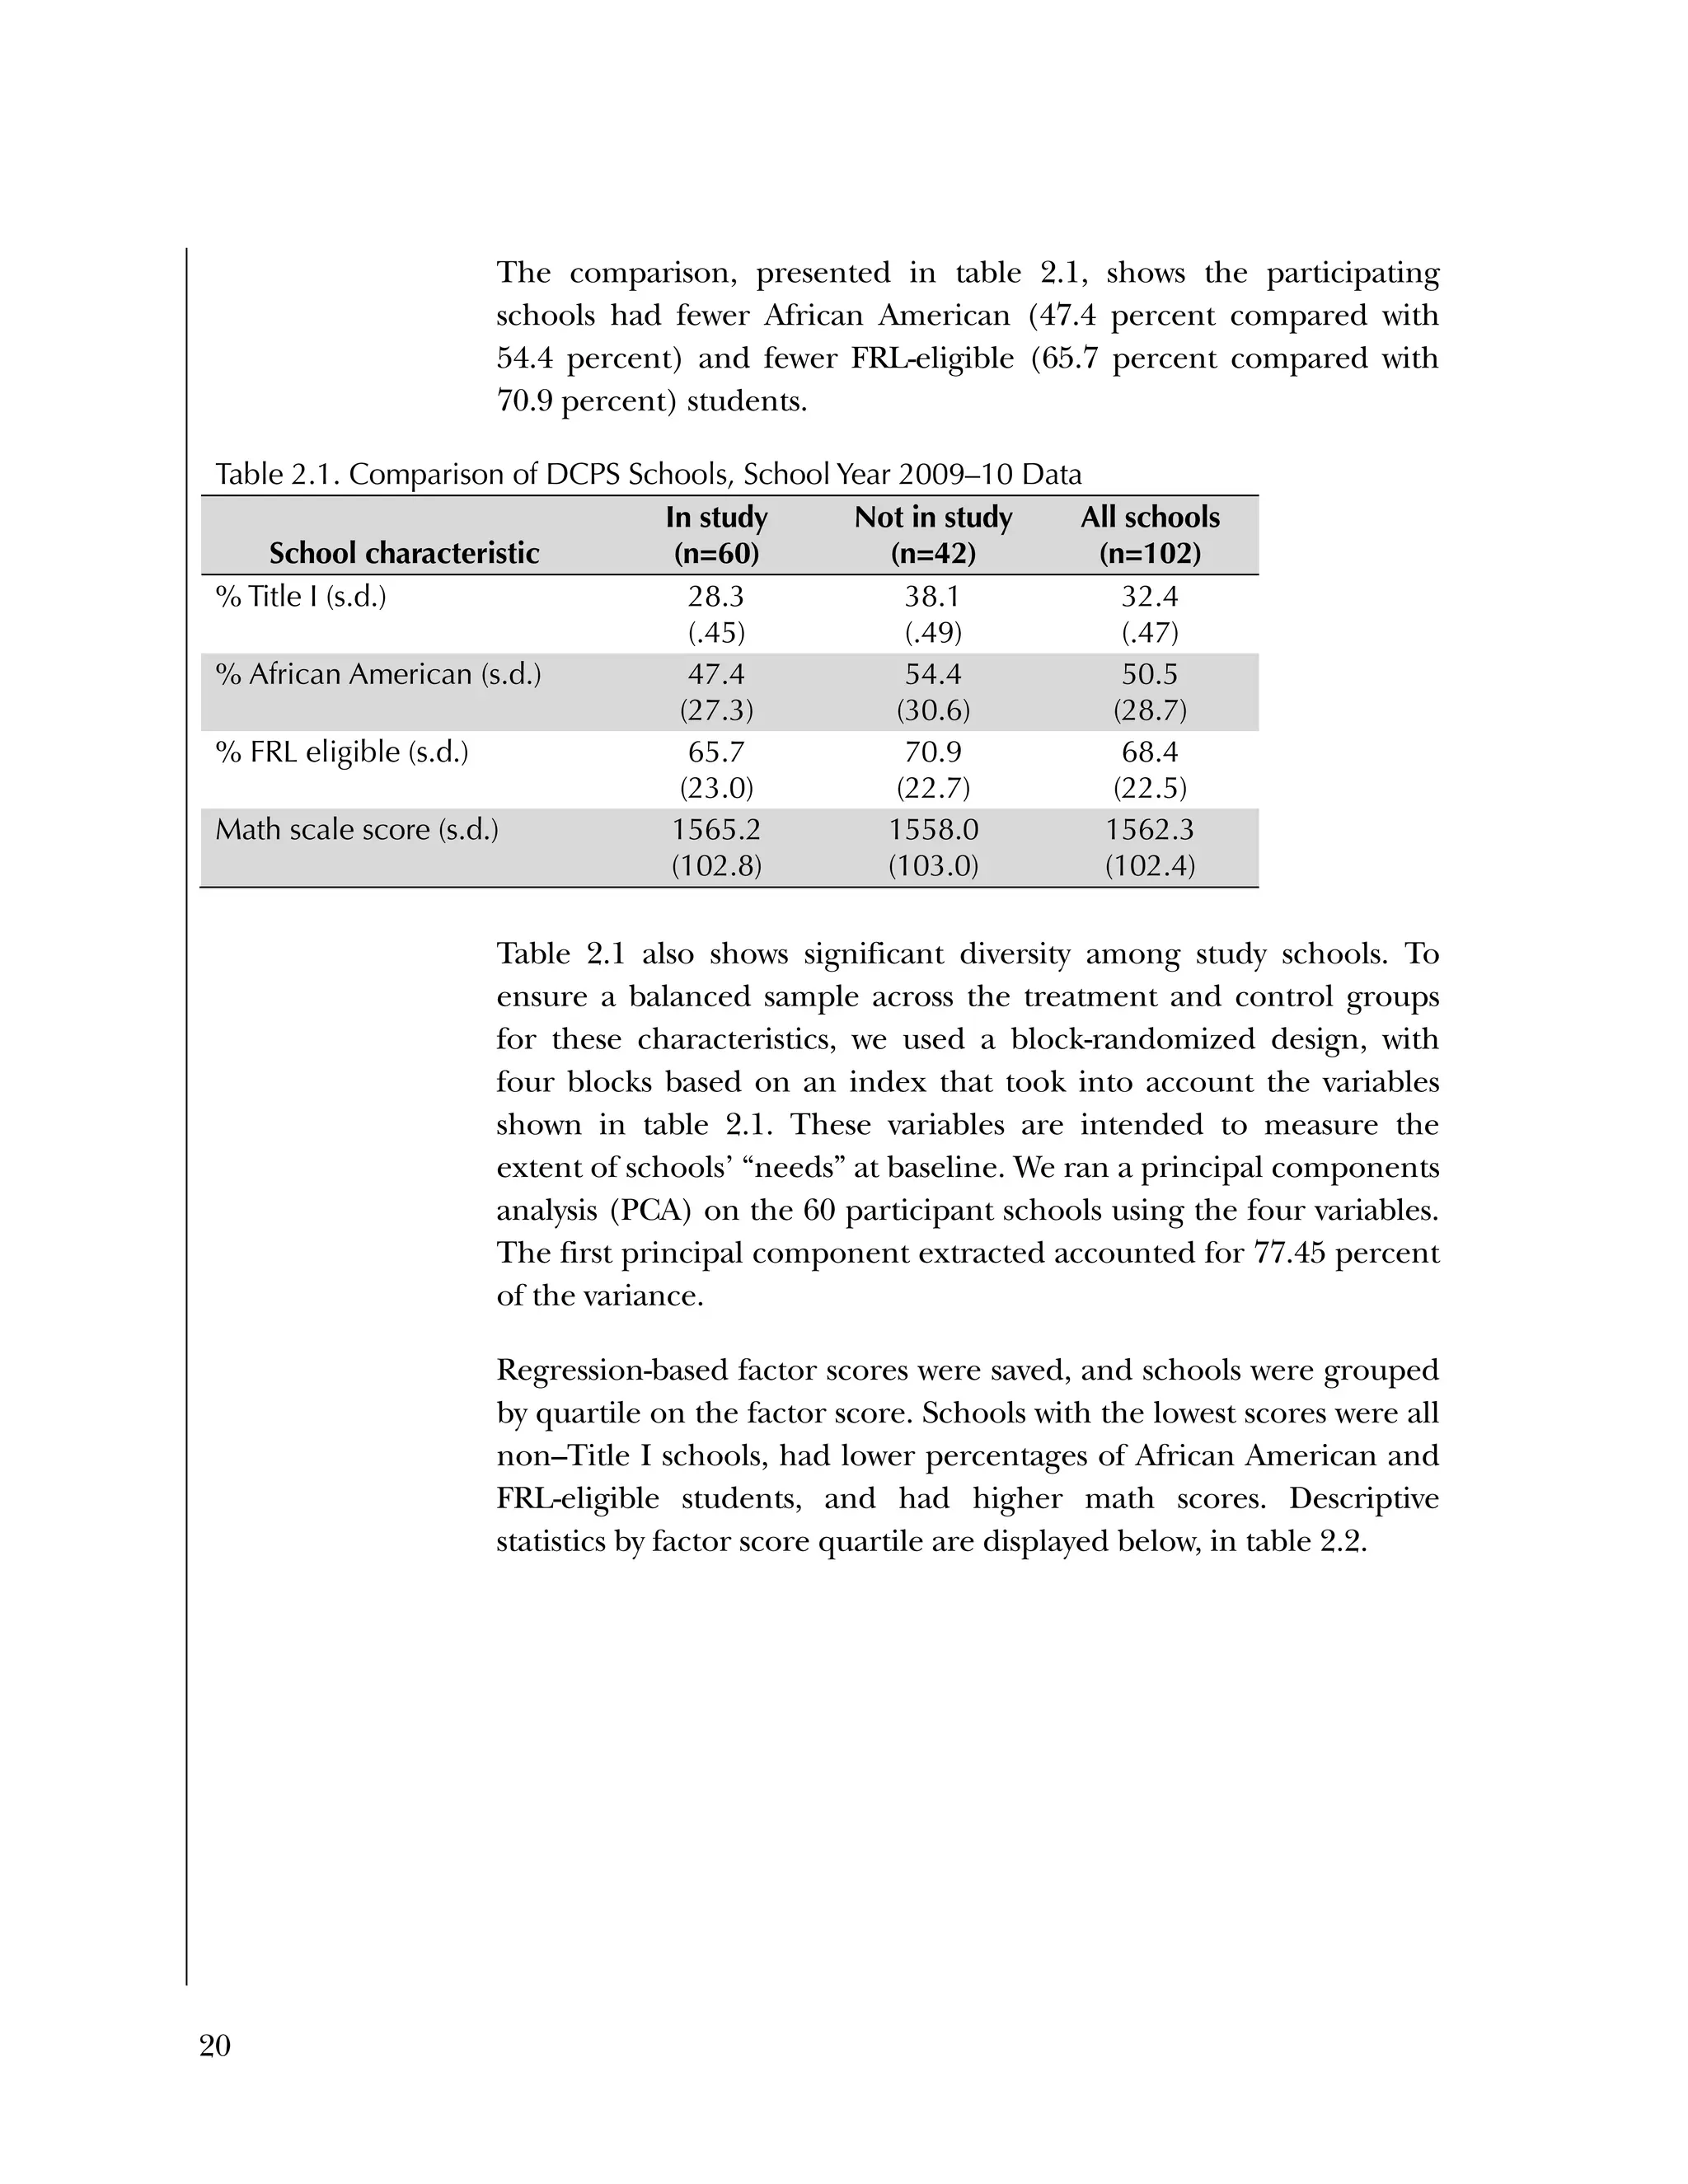
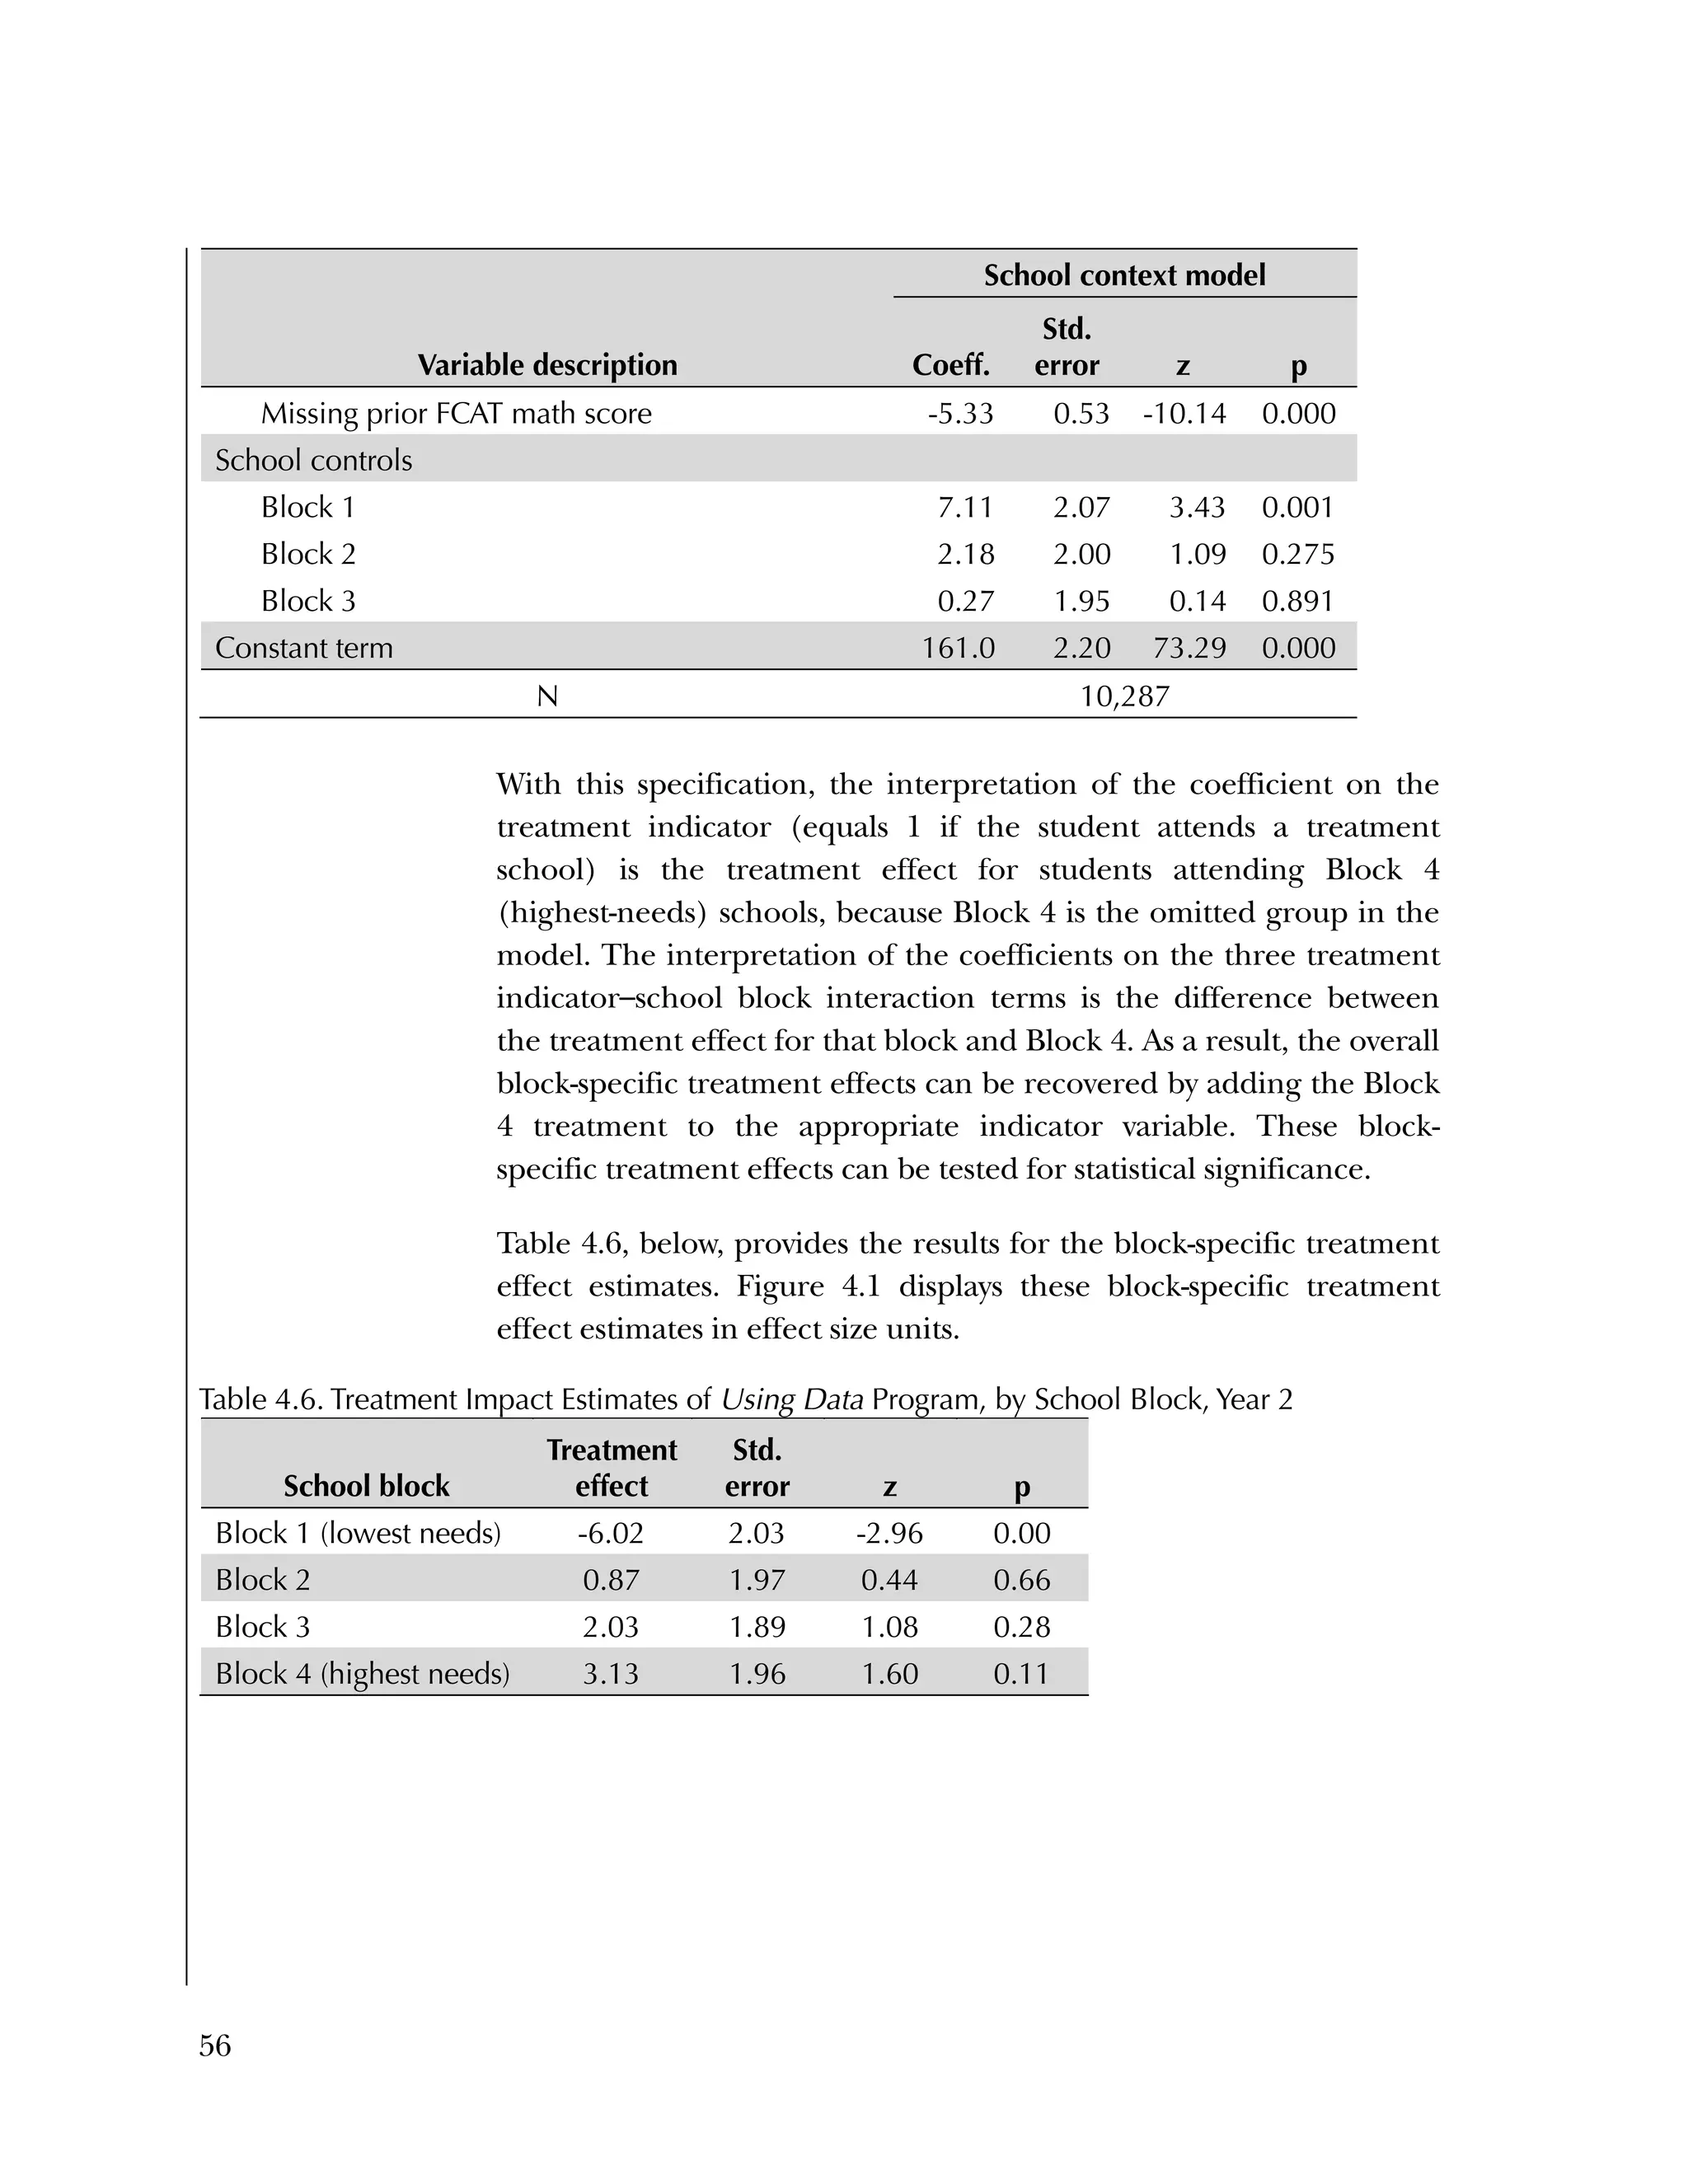
indicates whether the student attended in year 2 a school that was
assigned at randomization as a treatment school (T=1) or a
control school (T=0)
Sj
is a set of three dummy variables (n = 1, . . . , 3) corresponding to
three of the four blocks to which schools were assigned pre-
randomization
β0j
is the outcome mean for students in school j
γ00
is theschool-level intercept for school j
µ0j
is a school-level random effect
εij
is the student-level error term
The coefficient of interest is γ01
, which captures the effect of the
program on students after two years of program implementation in
schools, compared with students in control schools in year 2. Effect
sizes based on estimated treatment effects is calculated using Cohen’s
d.
11
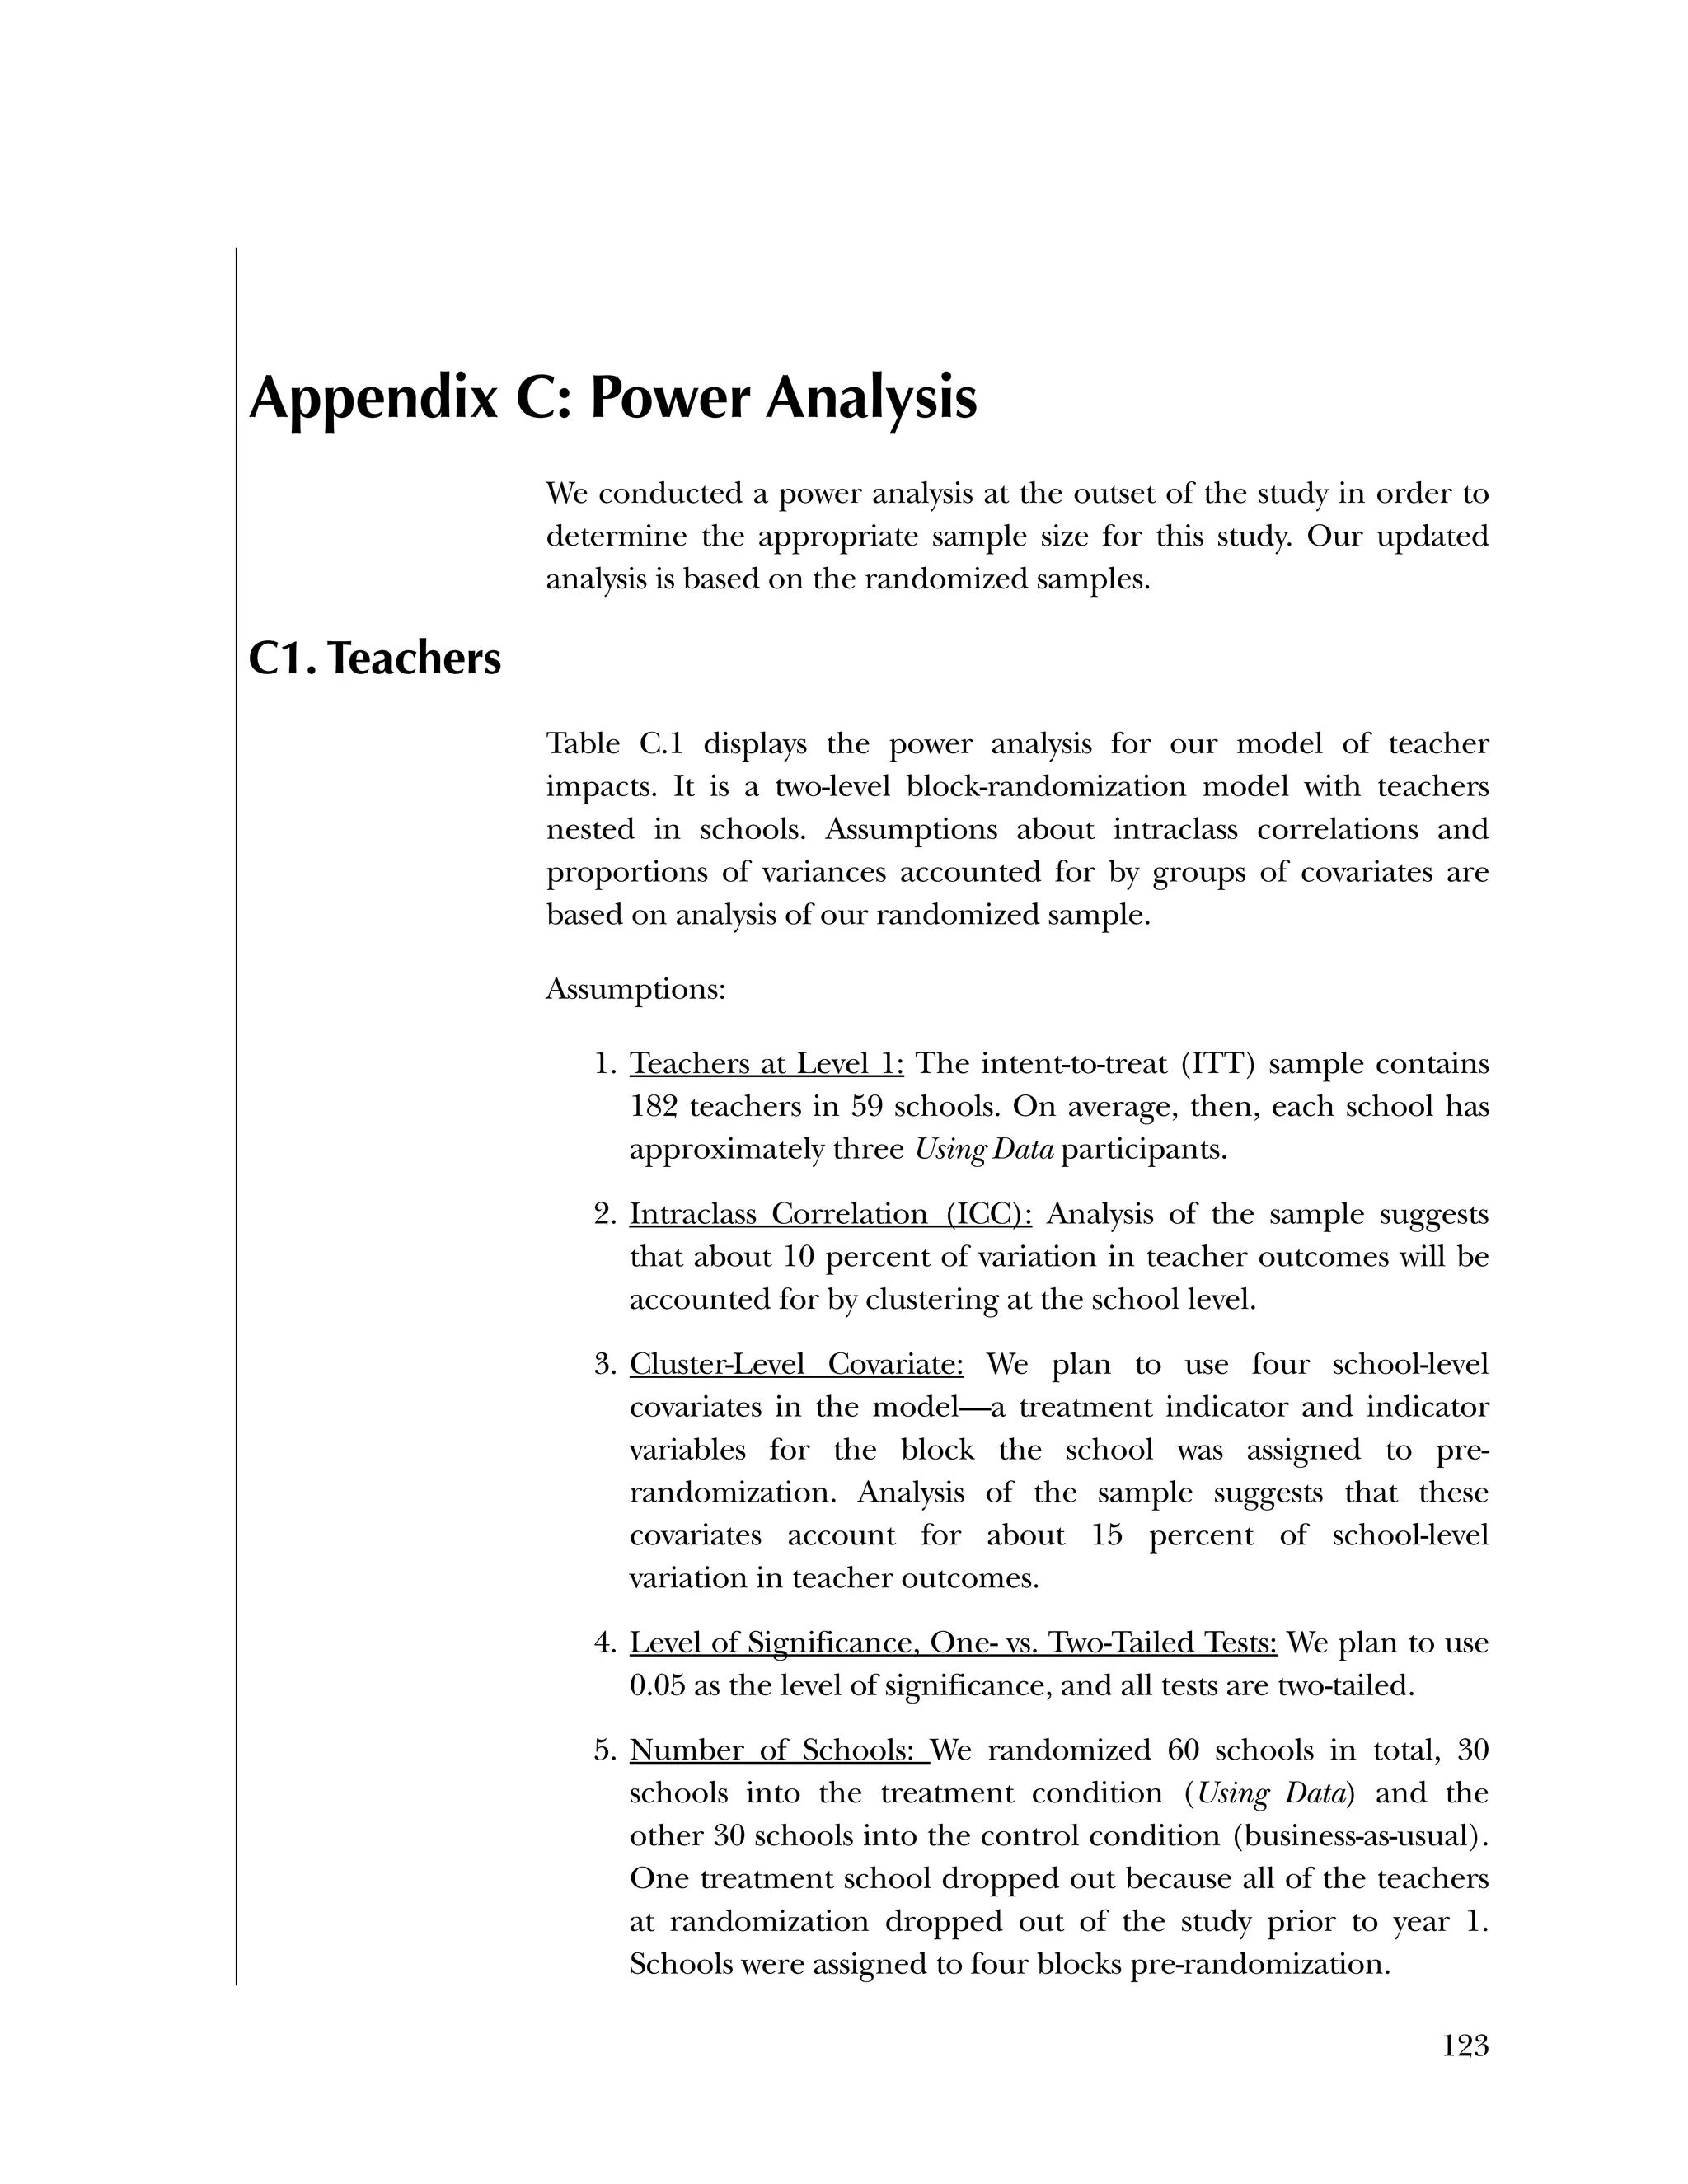
A power analysis conducted based on the two-level HLM, the block
design, the indicated covariates, and the sample size of 10,287
students in 59 schools calculated an MDES of .17 for the year 2
impact model (see appendix C).
Primary Confirmatory Analysis
1. (Primary Confirmatory Analysis) Schoolwide impact model—to
estimate the school-level treatment effect, we use a two-level
HLM with students nested in schools. This is our primary
confirmatory analysis with respect to the effects of Using Data
on student achievement.
Exploratory Analyses
2. (Exploratory Analysis) School context model—to estimate the
block-specific school-level treatment effects, we add to the two-
11
Cohen’s d takes the treatment effect estimated in the regression model
(the “coefficient of interest”) and converts it to standard deviation units
by dividing the coefficient by the pooled (across treatment and control
groups) standard deviation of the outcome variable. For the student
achievement model described above, d = γ01/{[(nT – 1)sT
2
+ (nC-1)sC
2
]/(nT
+ nC – 2)}
½
where γ01 is the estimated treatment effect (“coefficient of
interest”); sT and sC represent the standard deviations of the outcome
variable for the treatment and control groups, respectively; and nT and
nC represent the sample size for the treatment and control groups.](https://image.slidesharecdn.com/40e478df-c39b-4dd7-8520-f99976663650-151230202544/75/Using-Data-41-2048.jpg)


![72
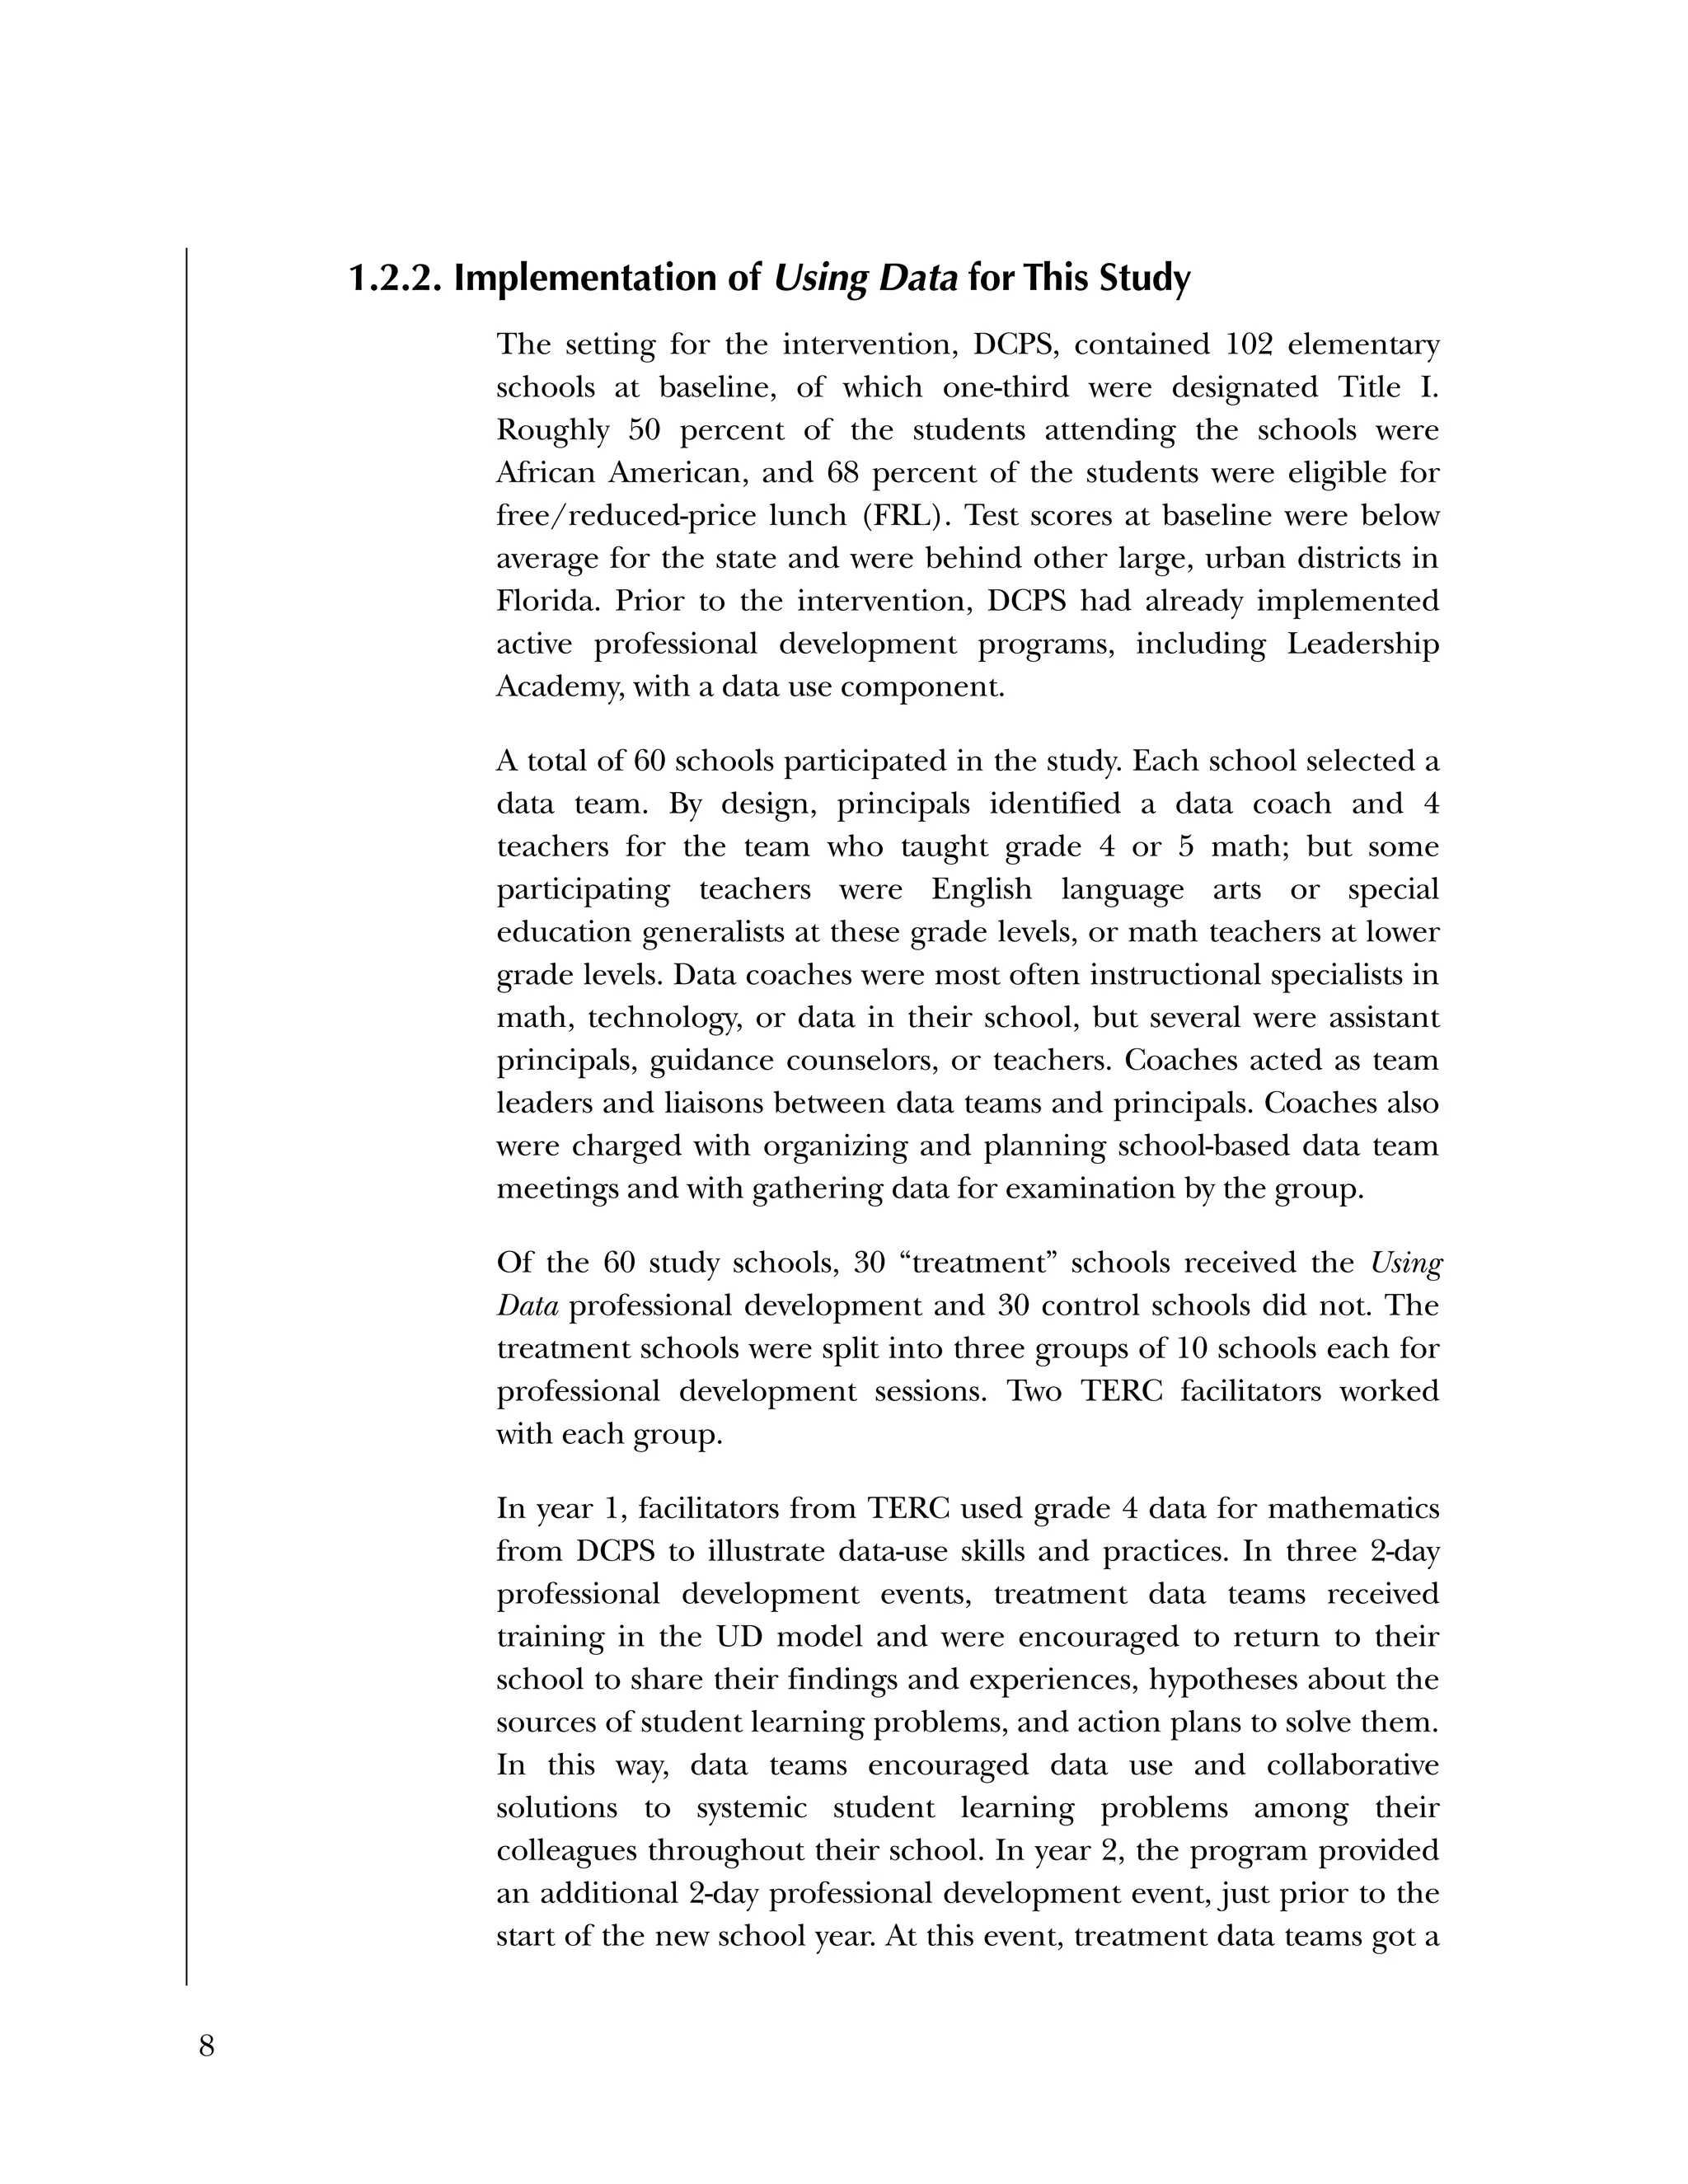
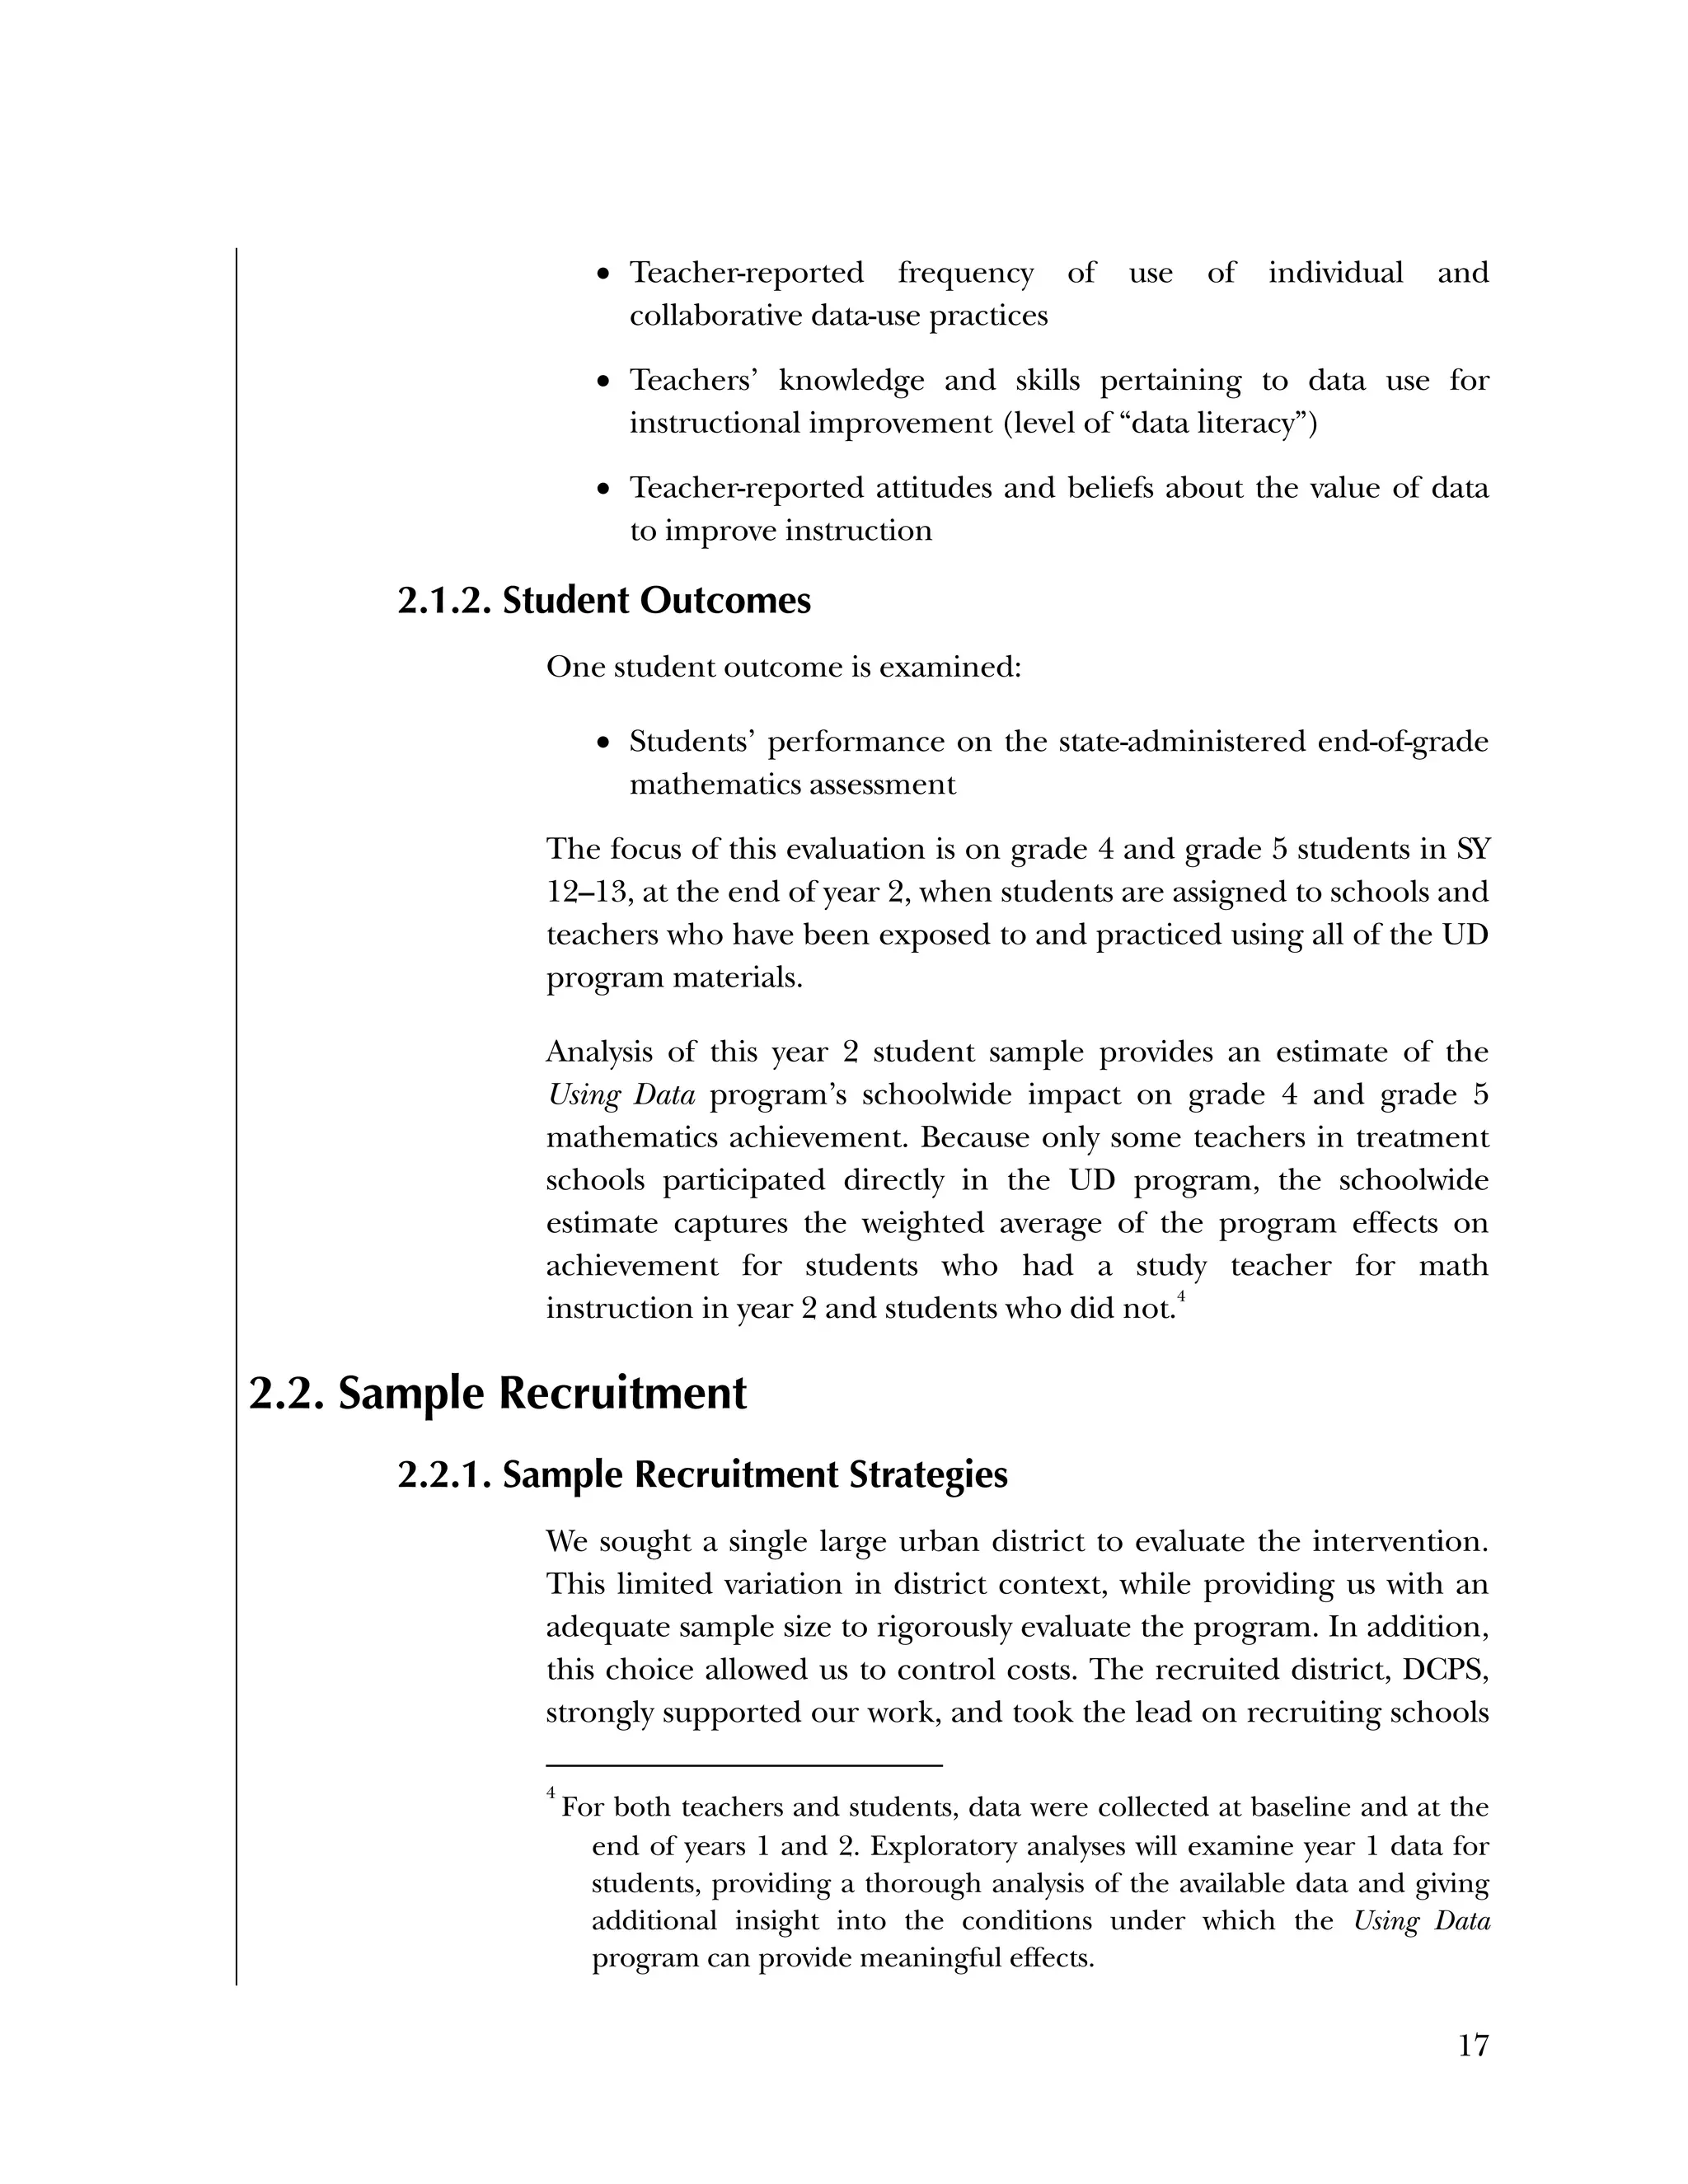
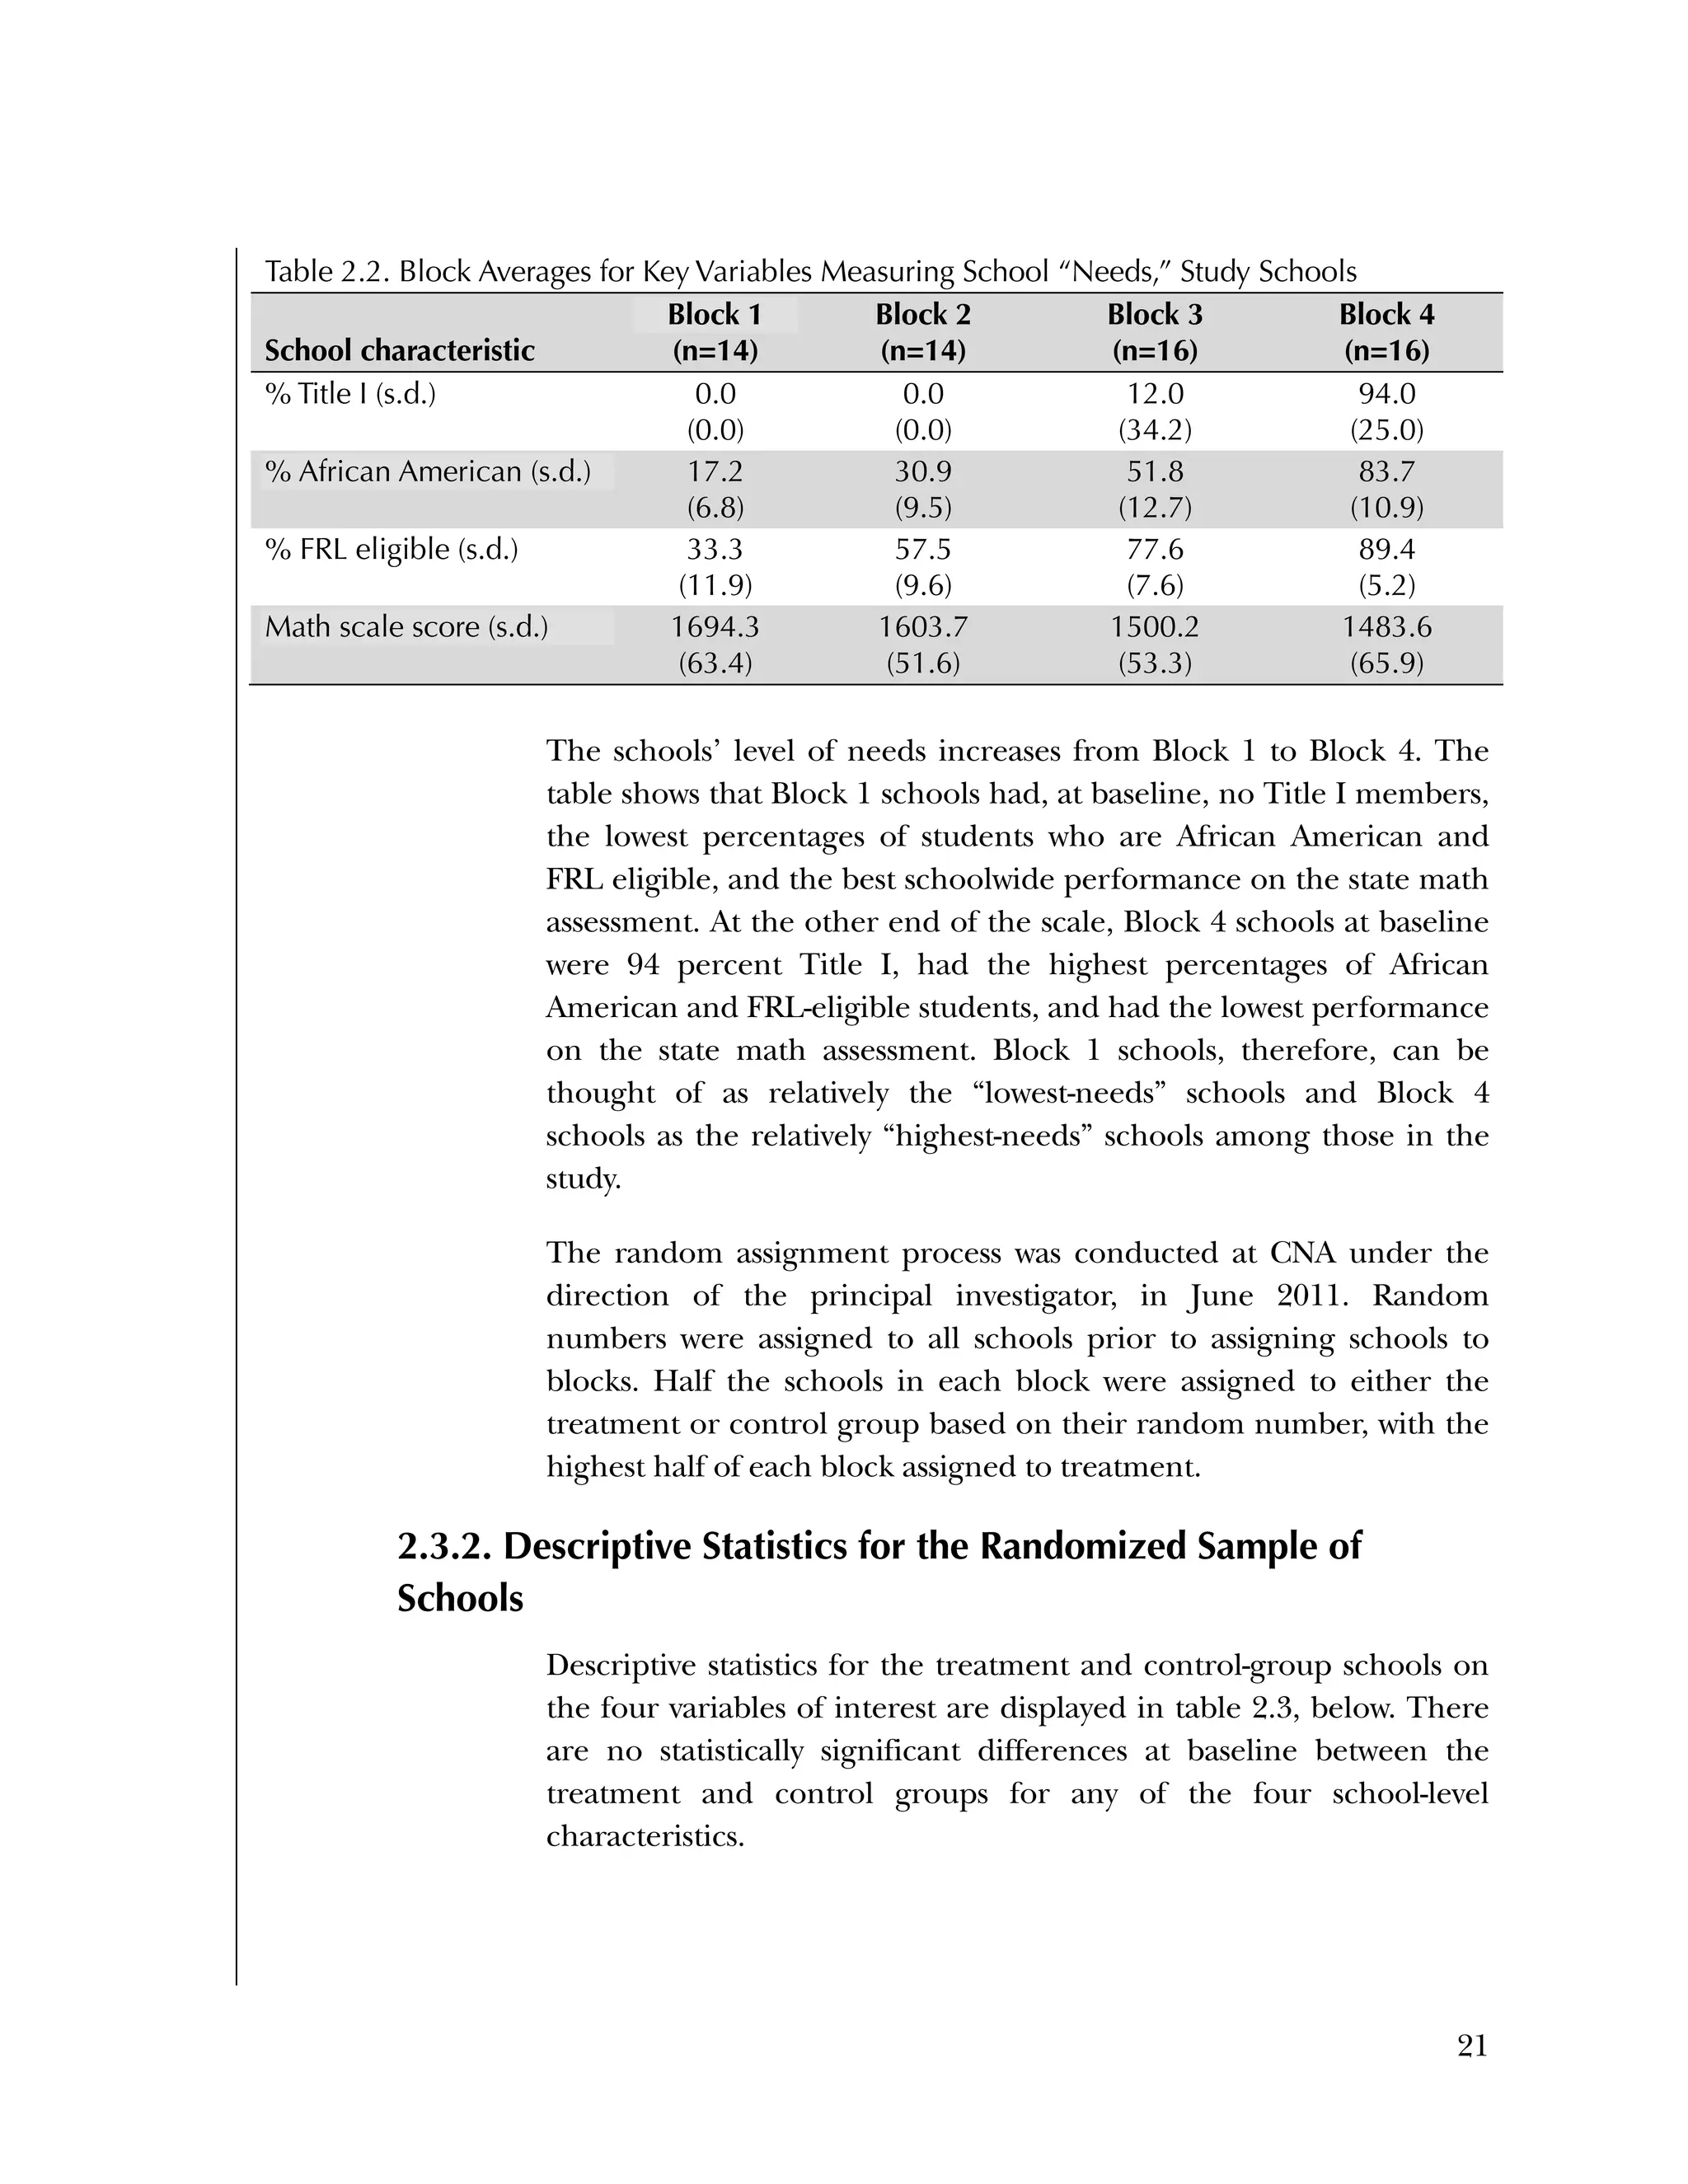
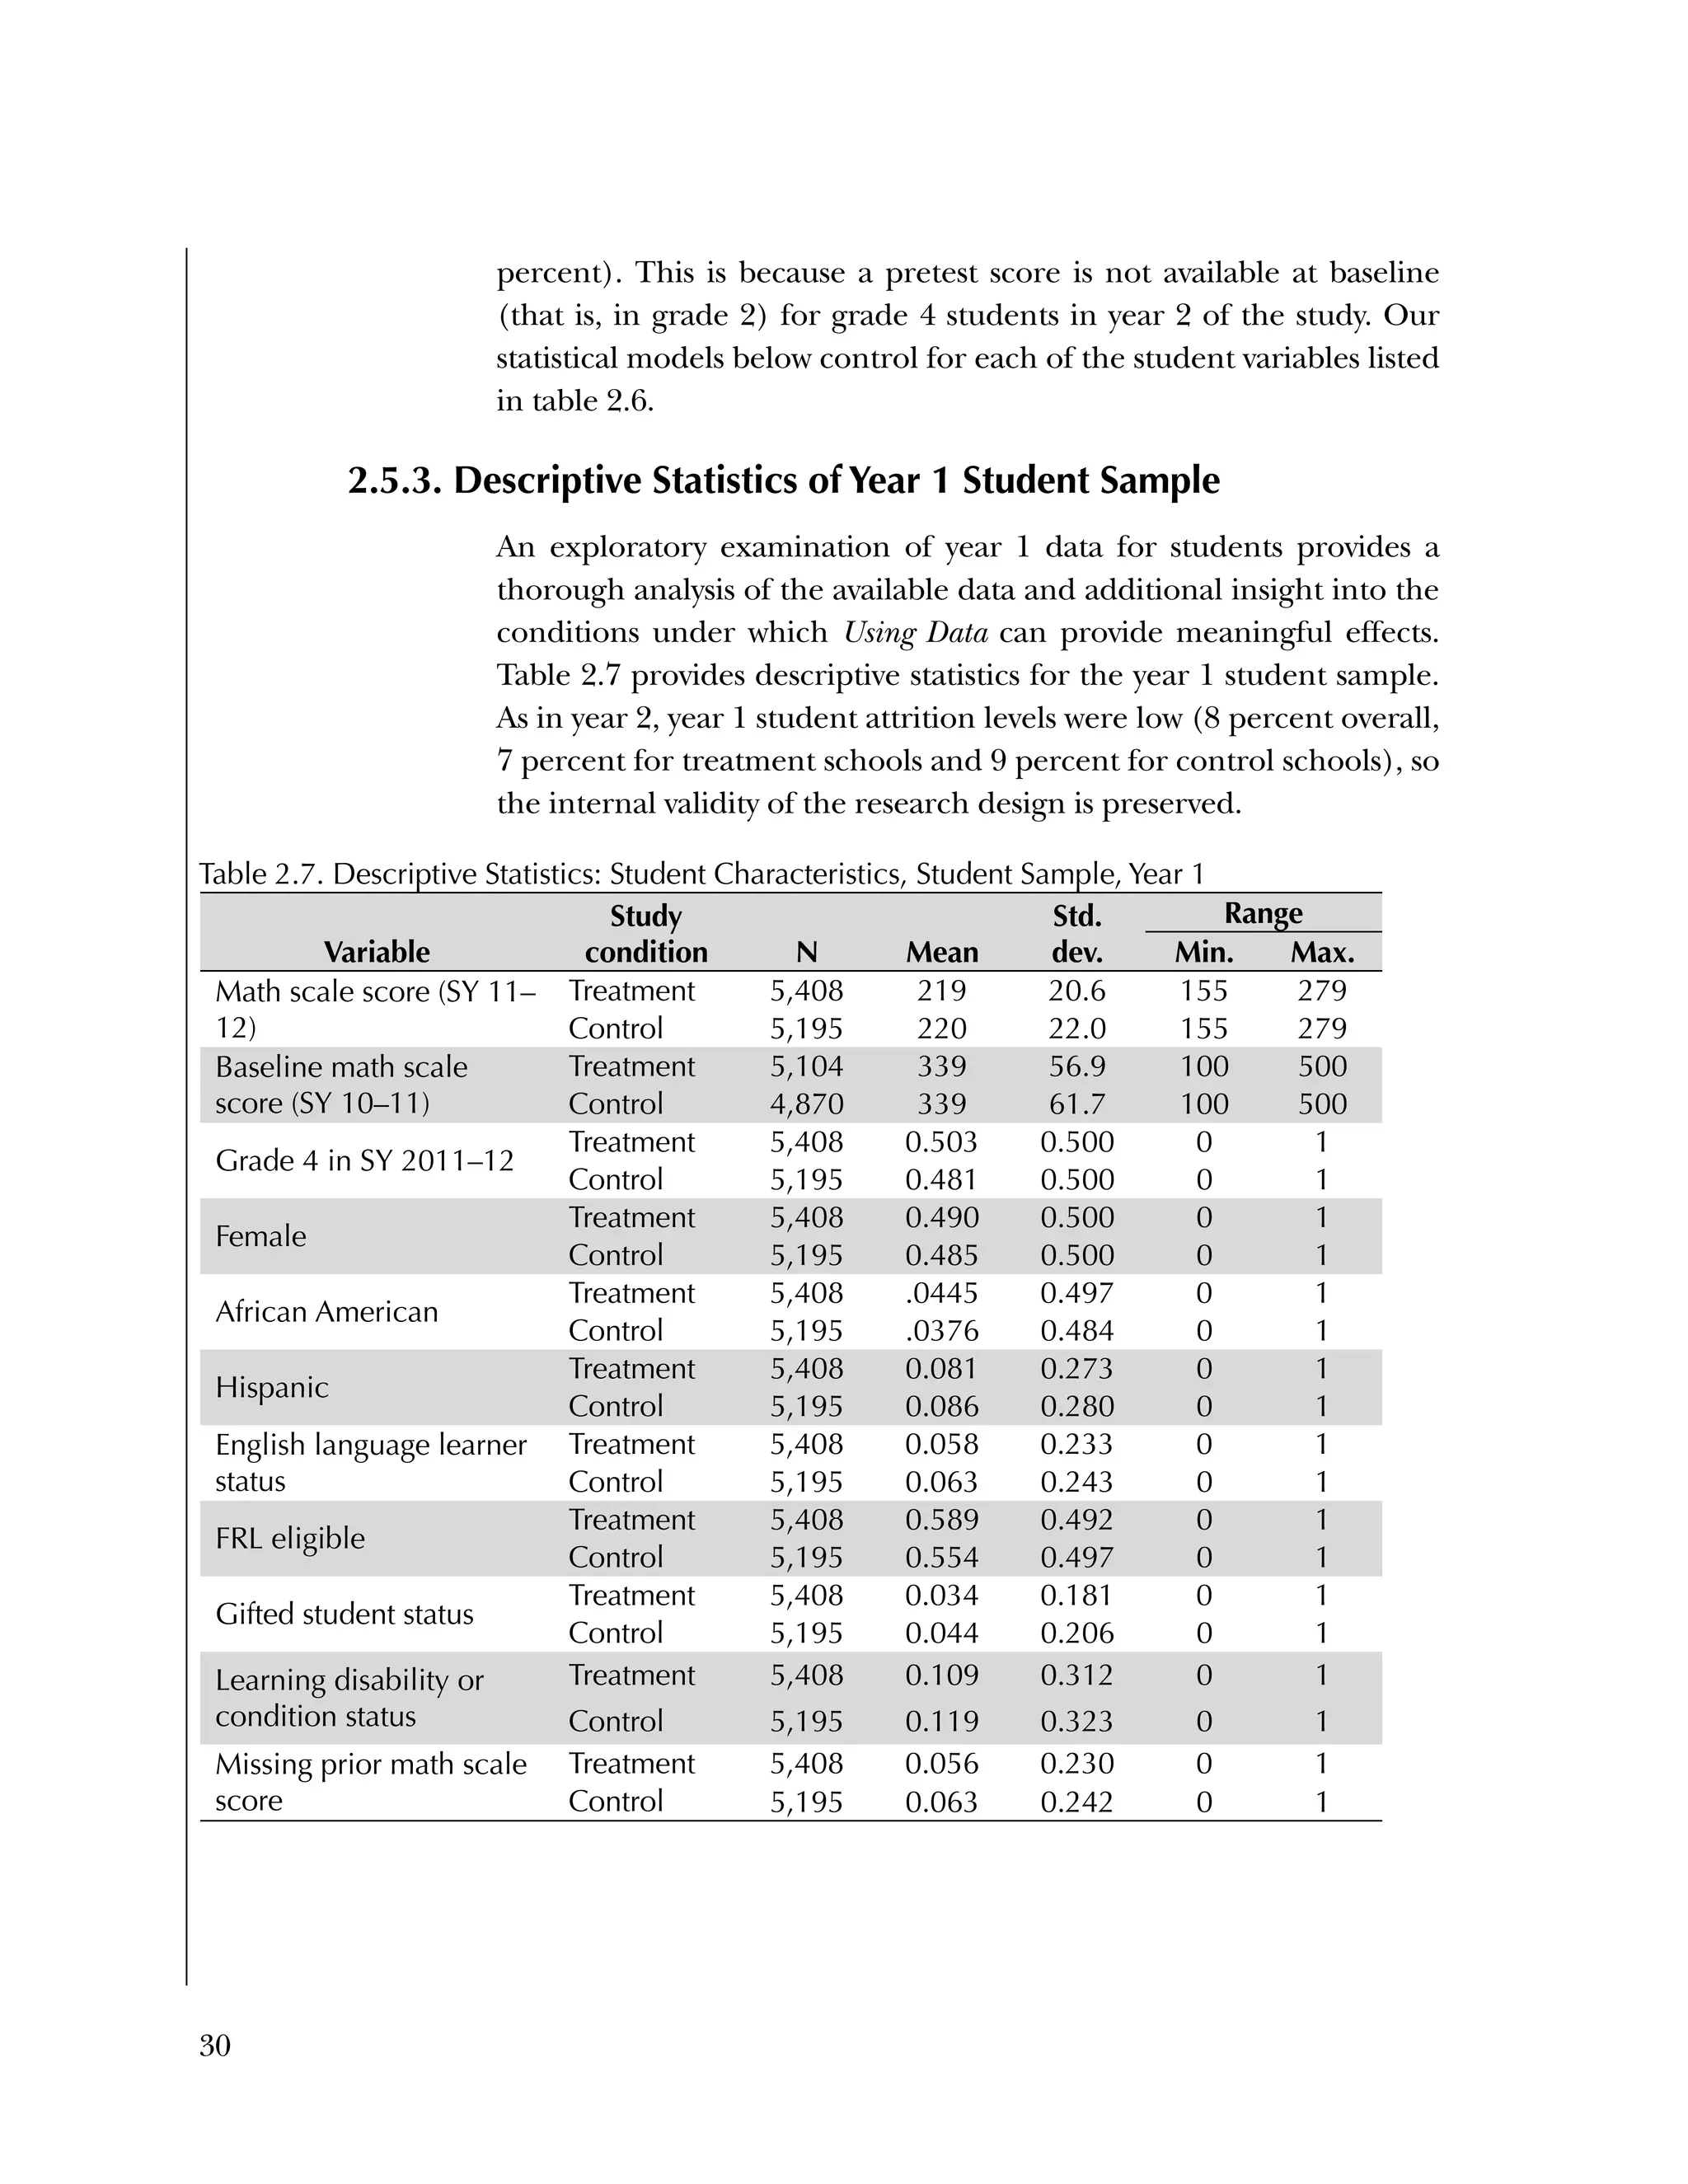
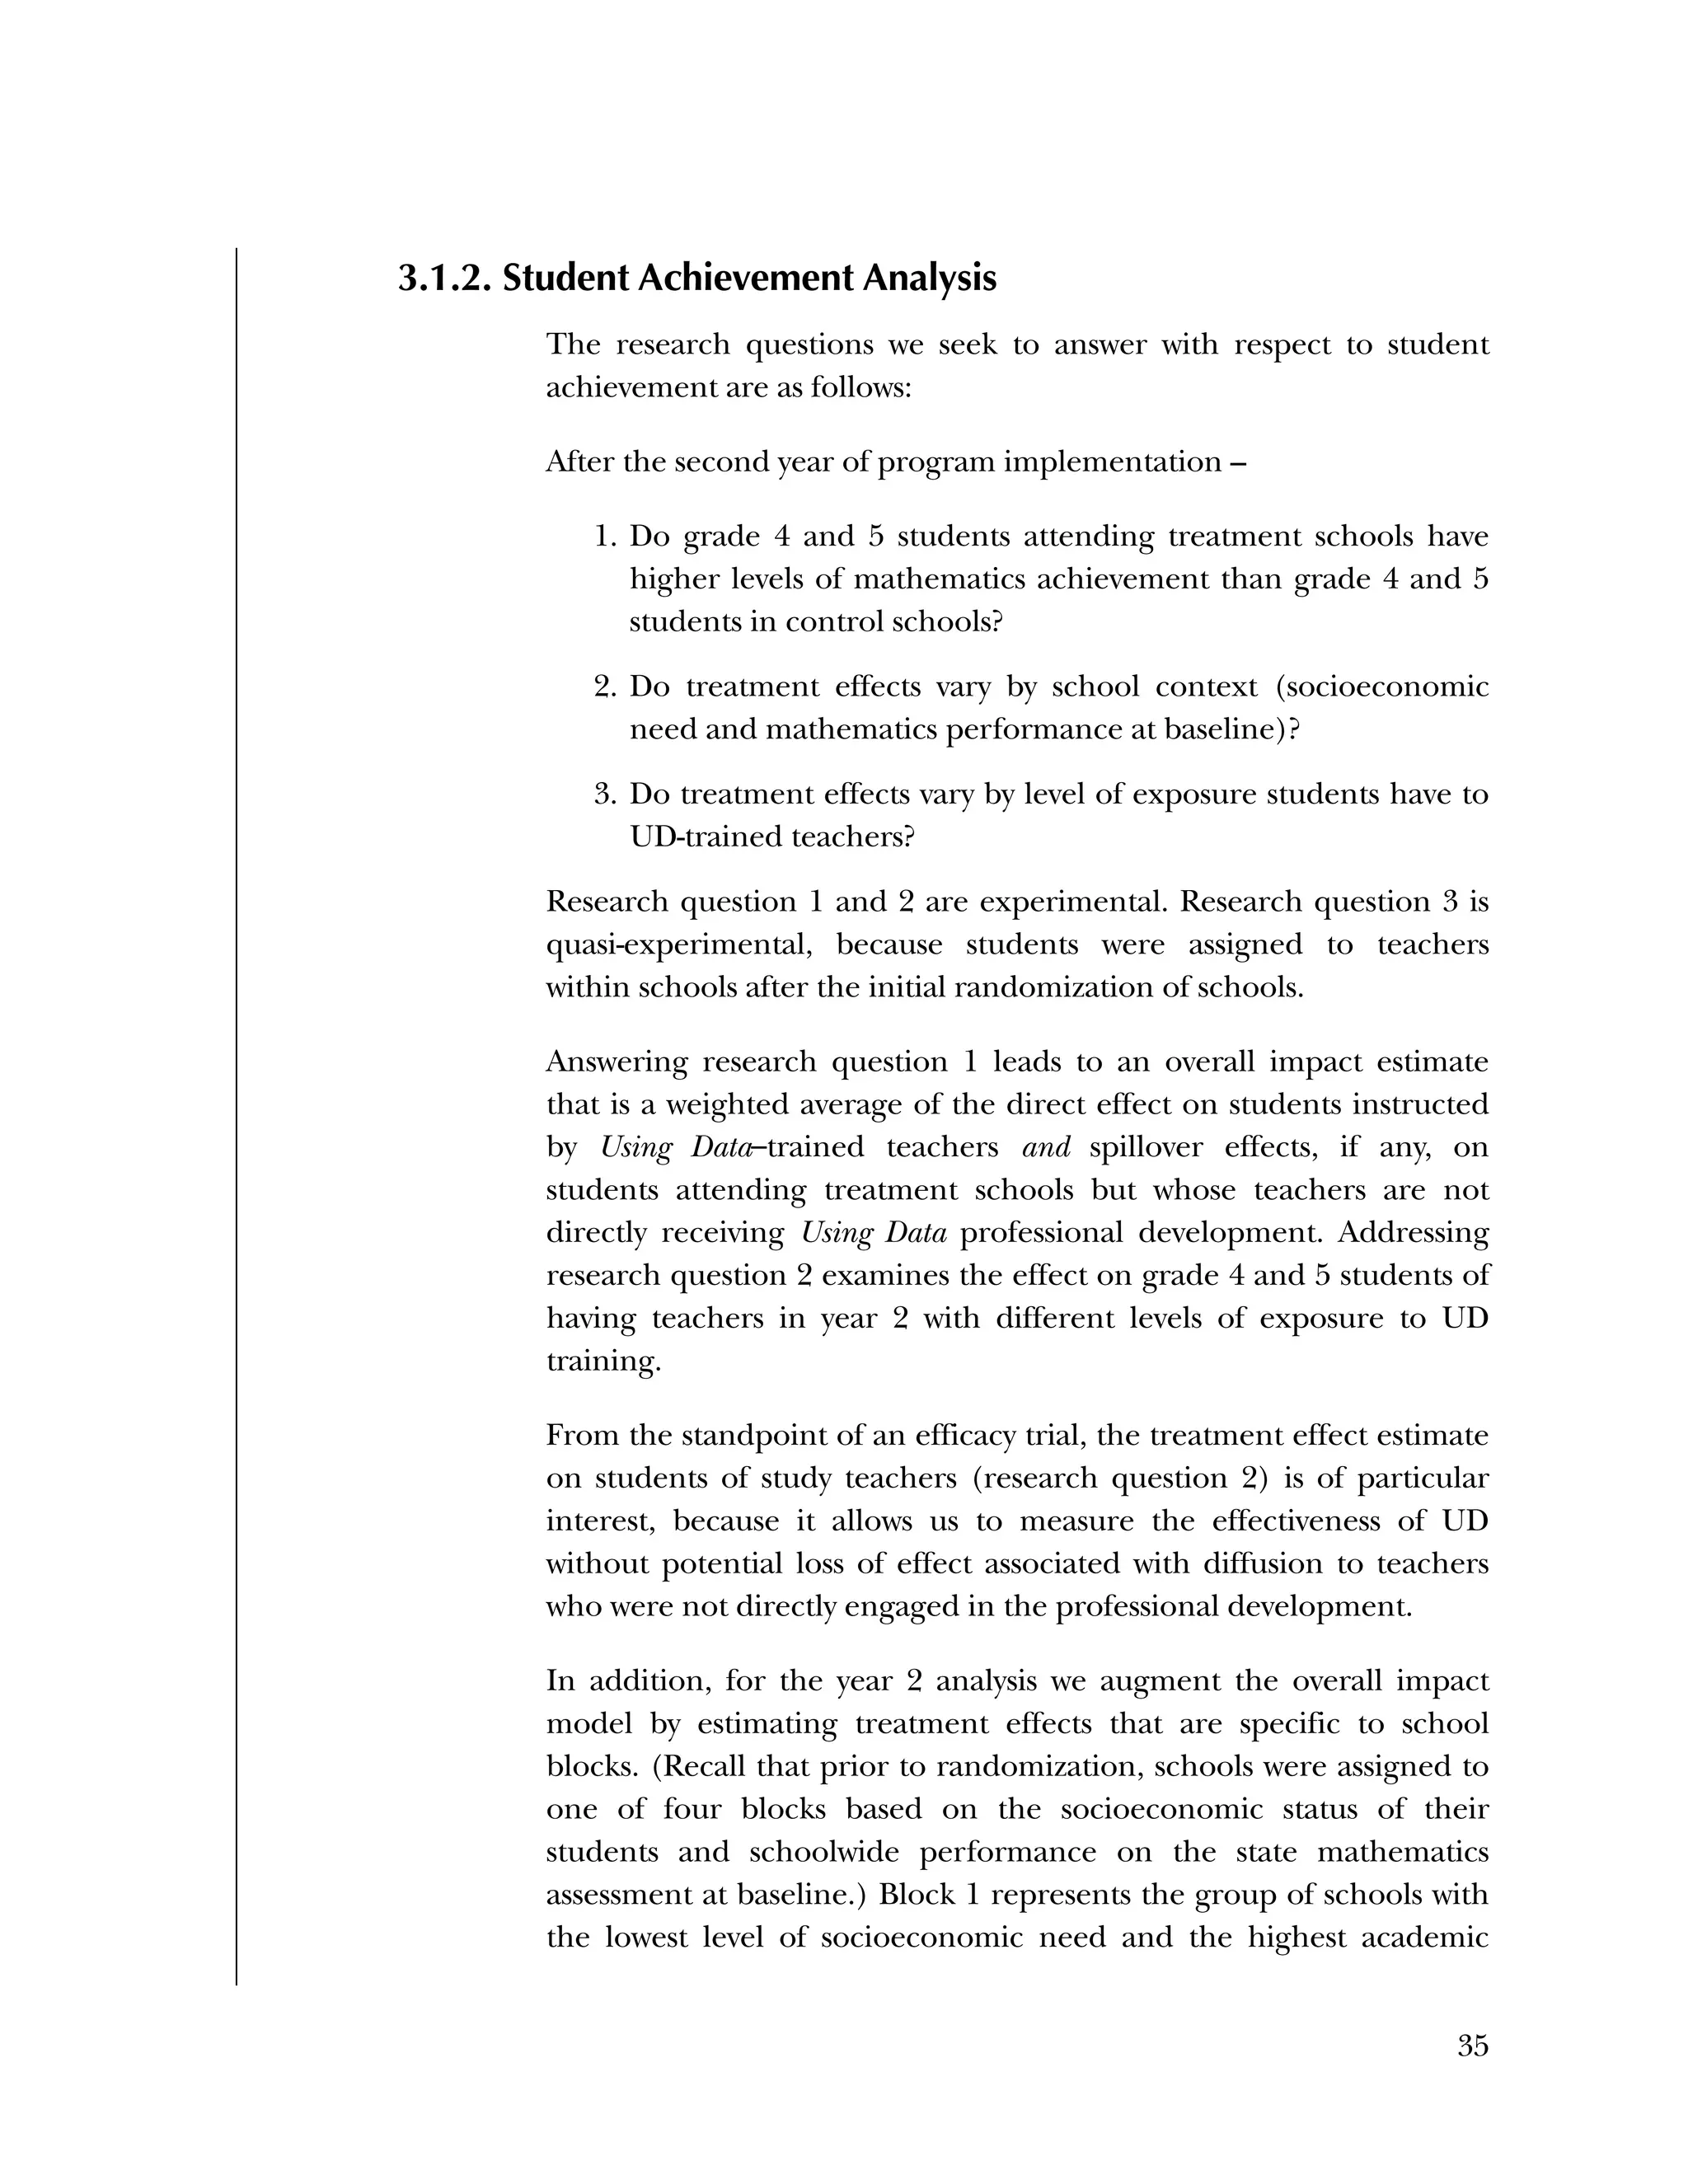
Additionally, in interviews we conducted at a subset of three
treatment schools at the beginning of year 2, teachers in each school
described the challenge of implementing these program
components. Data team members at School 1 confidently analyzed
student data together, but their knowledge of what to do with the
analysis and ability to make a connection to their teaching practices
were evolving. Describing teachers’ difficulty with using data to
change their instruction, the data coach said:
Looking at [data] and driving where the kids are—I think
we’re pretty good at looking at data and seeing. Whether we
change what we do, I don’t know that that’s the case. That’s
the whole point of it. Looking to see where we need to
change things or what we need to continue that worked
with that. I think we’re good looking at it, but whether we
implement change, I don’t know.
The data coach at School 2 expressed,
Teachers are good at pulling and looking at data, but
they're not strong in understanding the causes of student
performance.
A data team member at School 2, who is also a school instructional
coach, believed teachers were not taking this next step because they
might find themselves to be the cause of the student learning
problem:
I think, for some people, it’s still an openness of really
looking at themselves and their own practices and being
afraid that when we really start to break down that data, that
it’s more of a reflection on them—that people aren’t quite
ready for that next step still. I think that they’re opening up
more and more, but it’s still hard for them to reflect on
themselves as a cause for a learning problem.
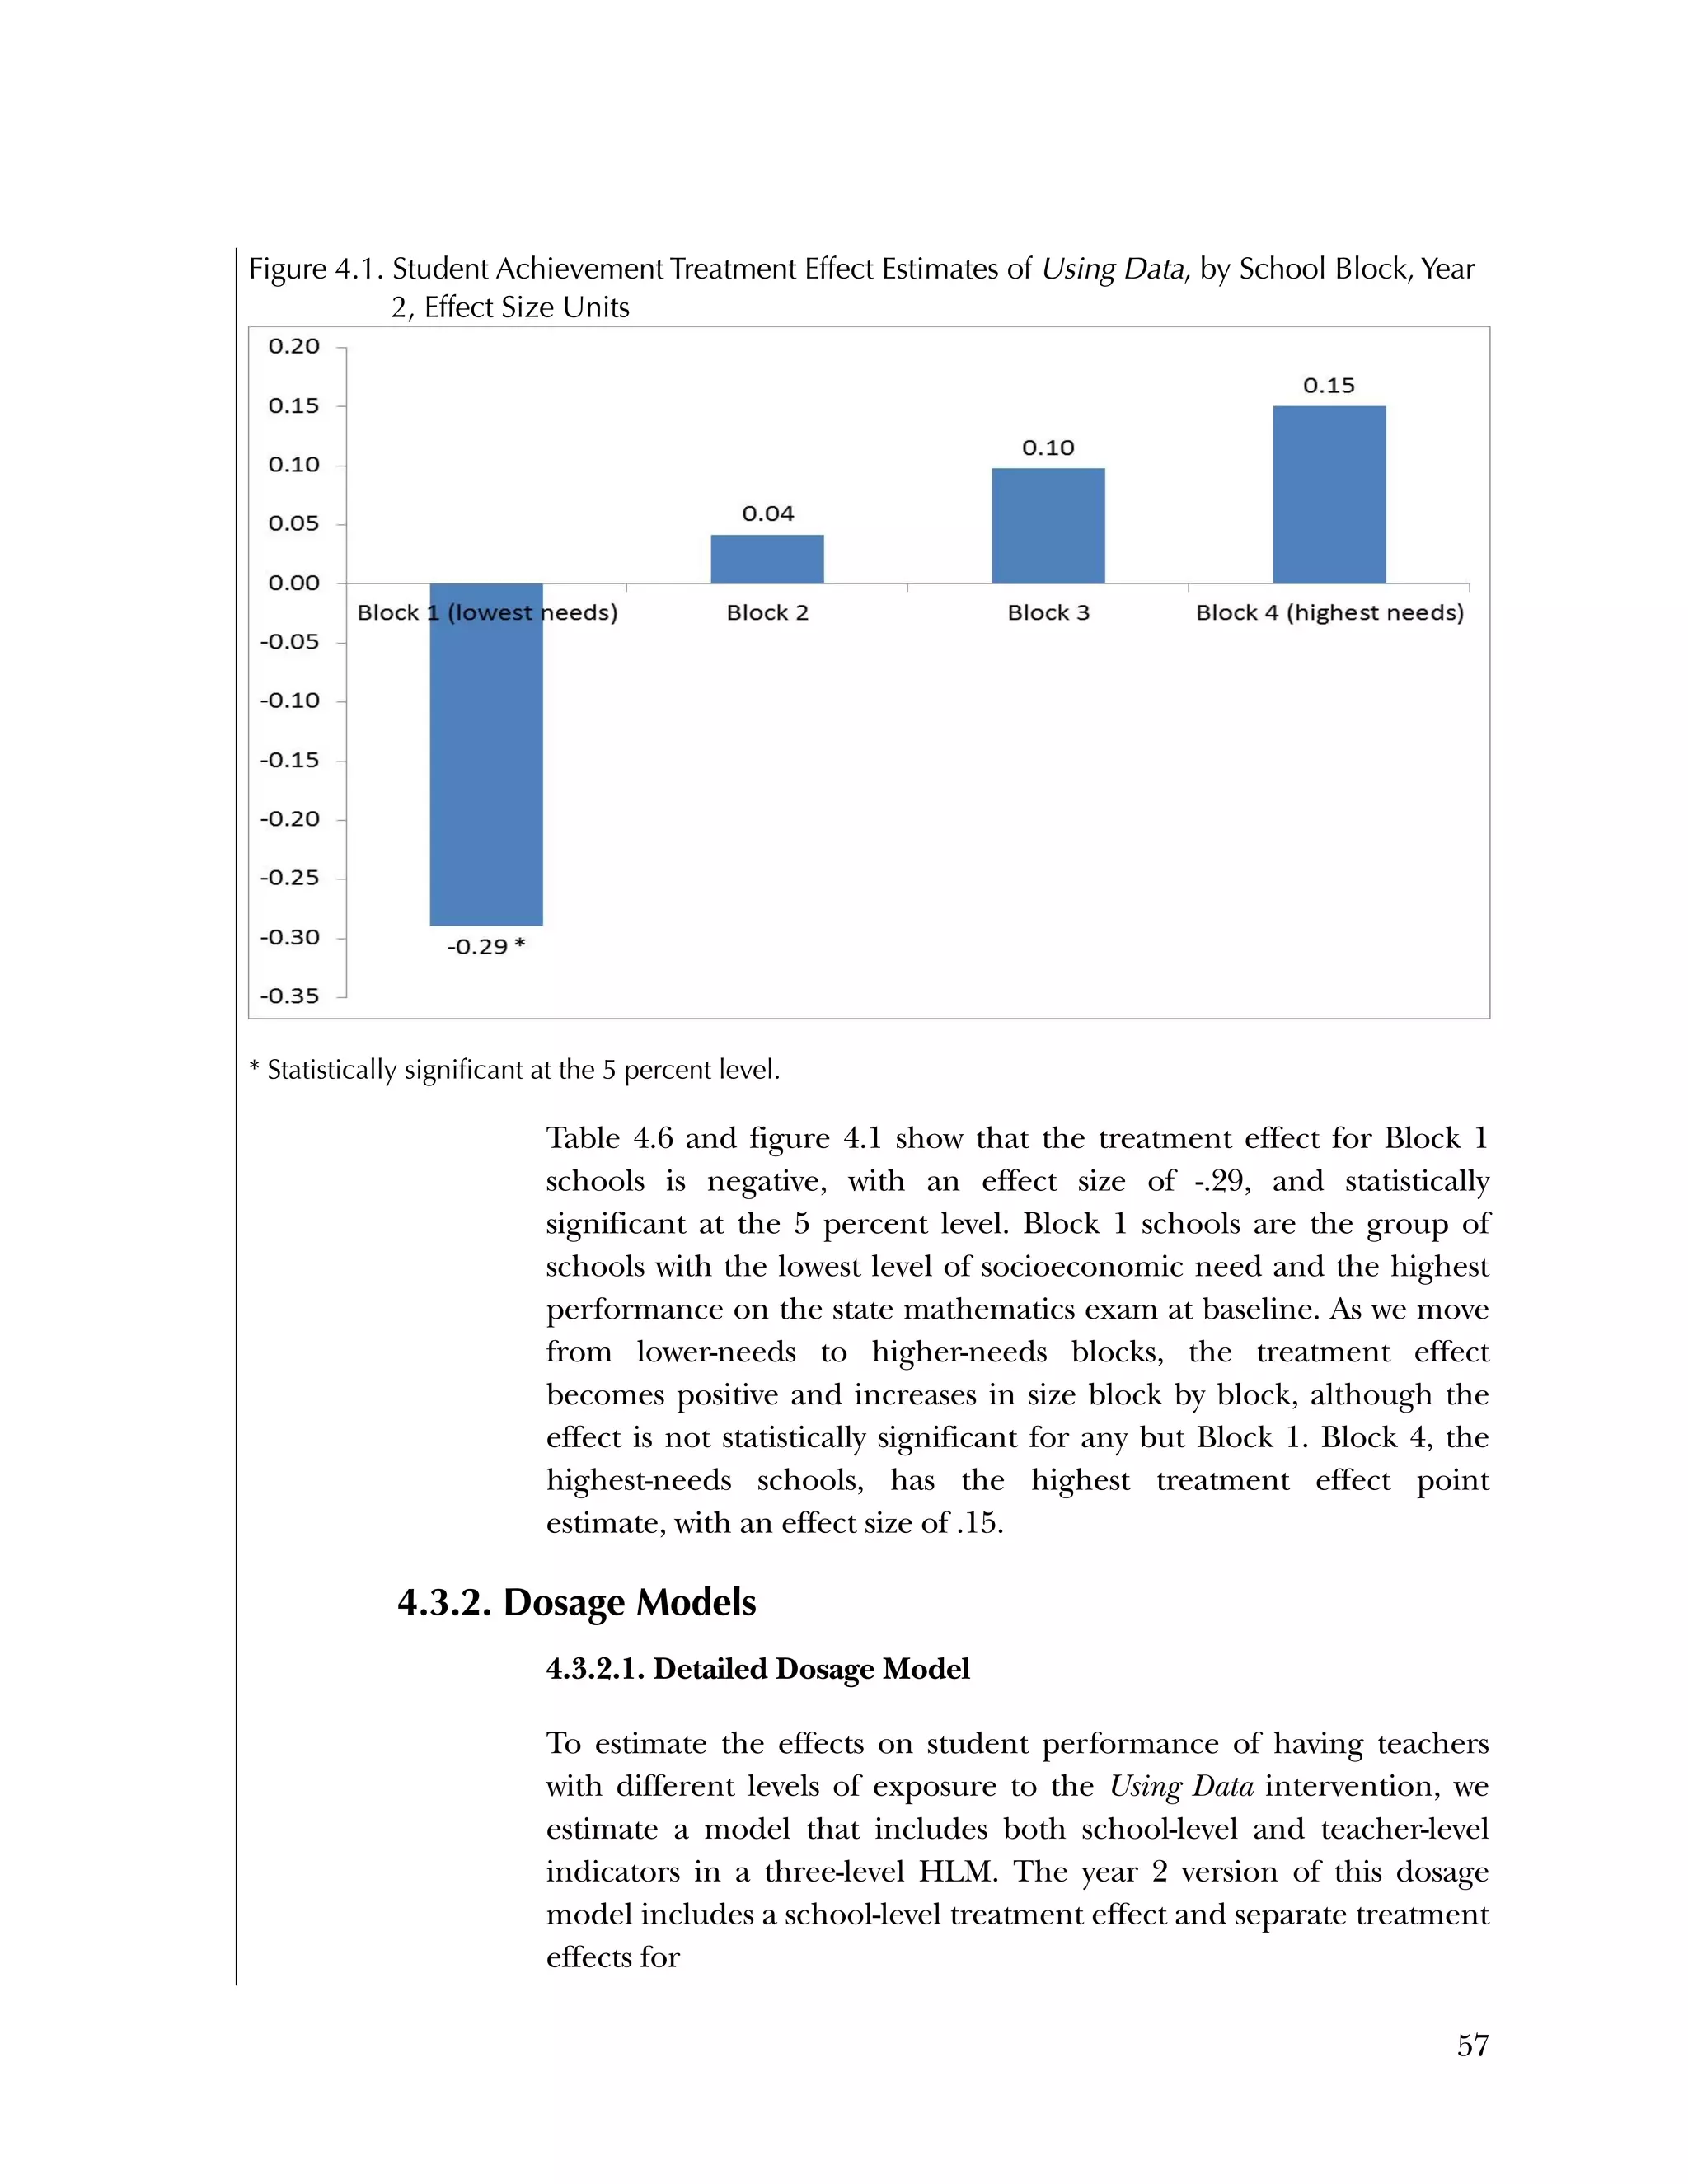
Block-Specific Differences in Treatment Effect on Student
Achievement
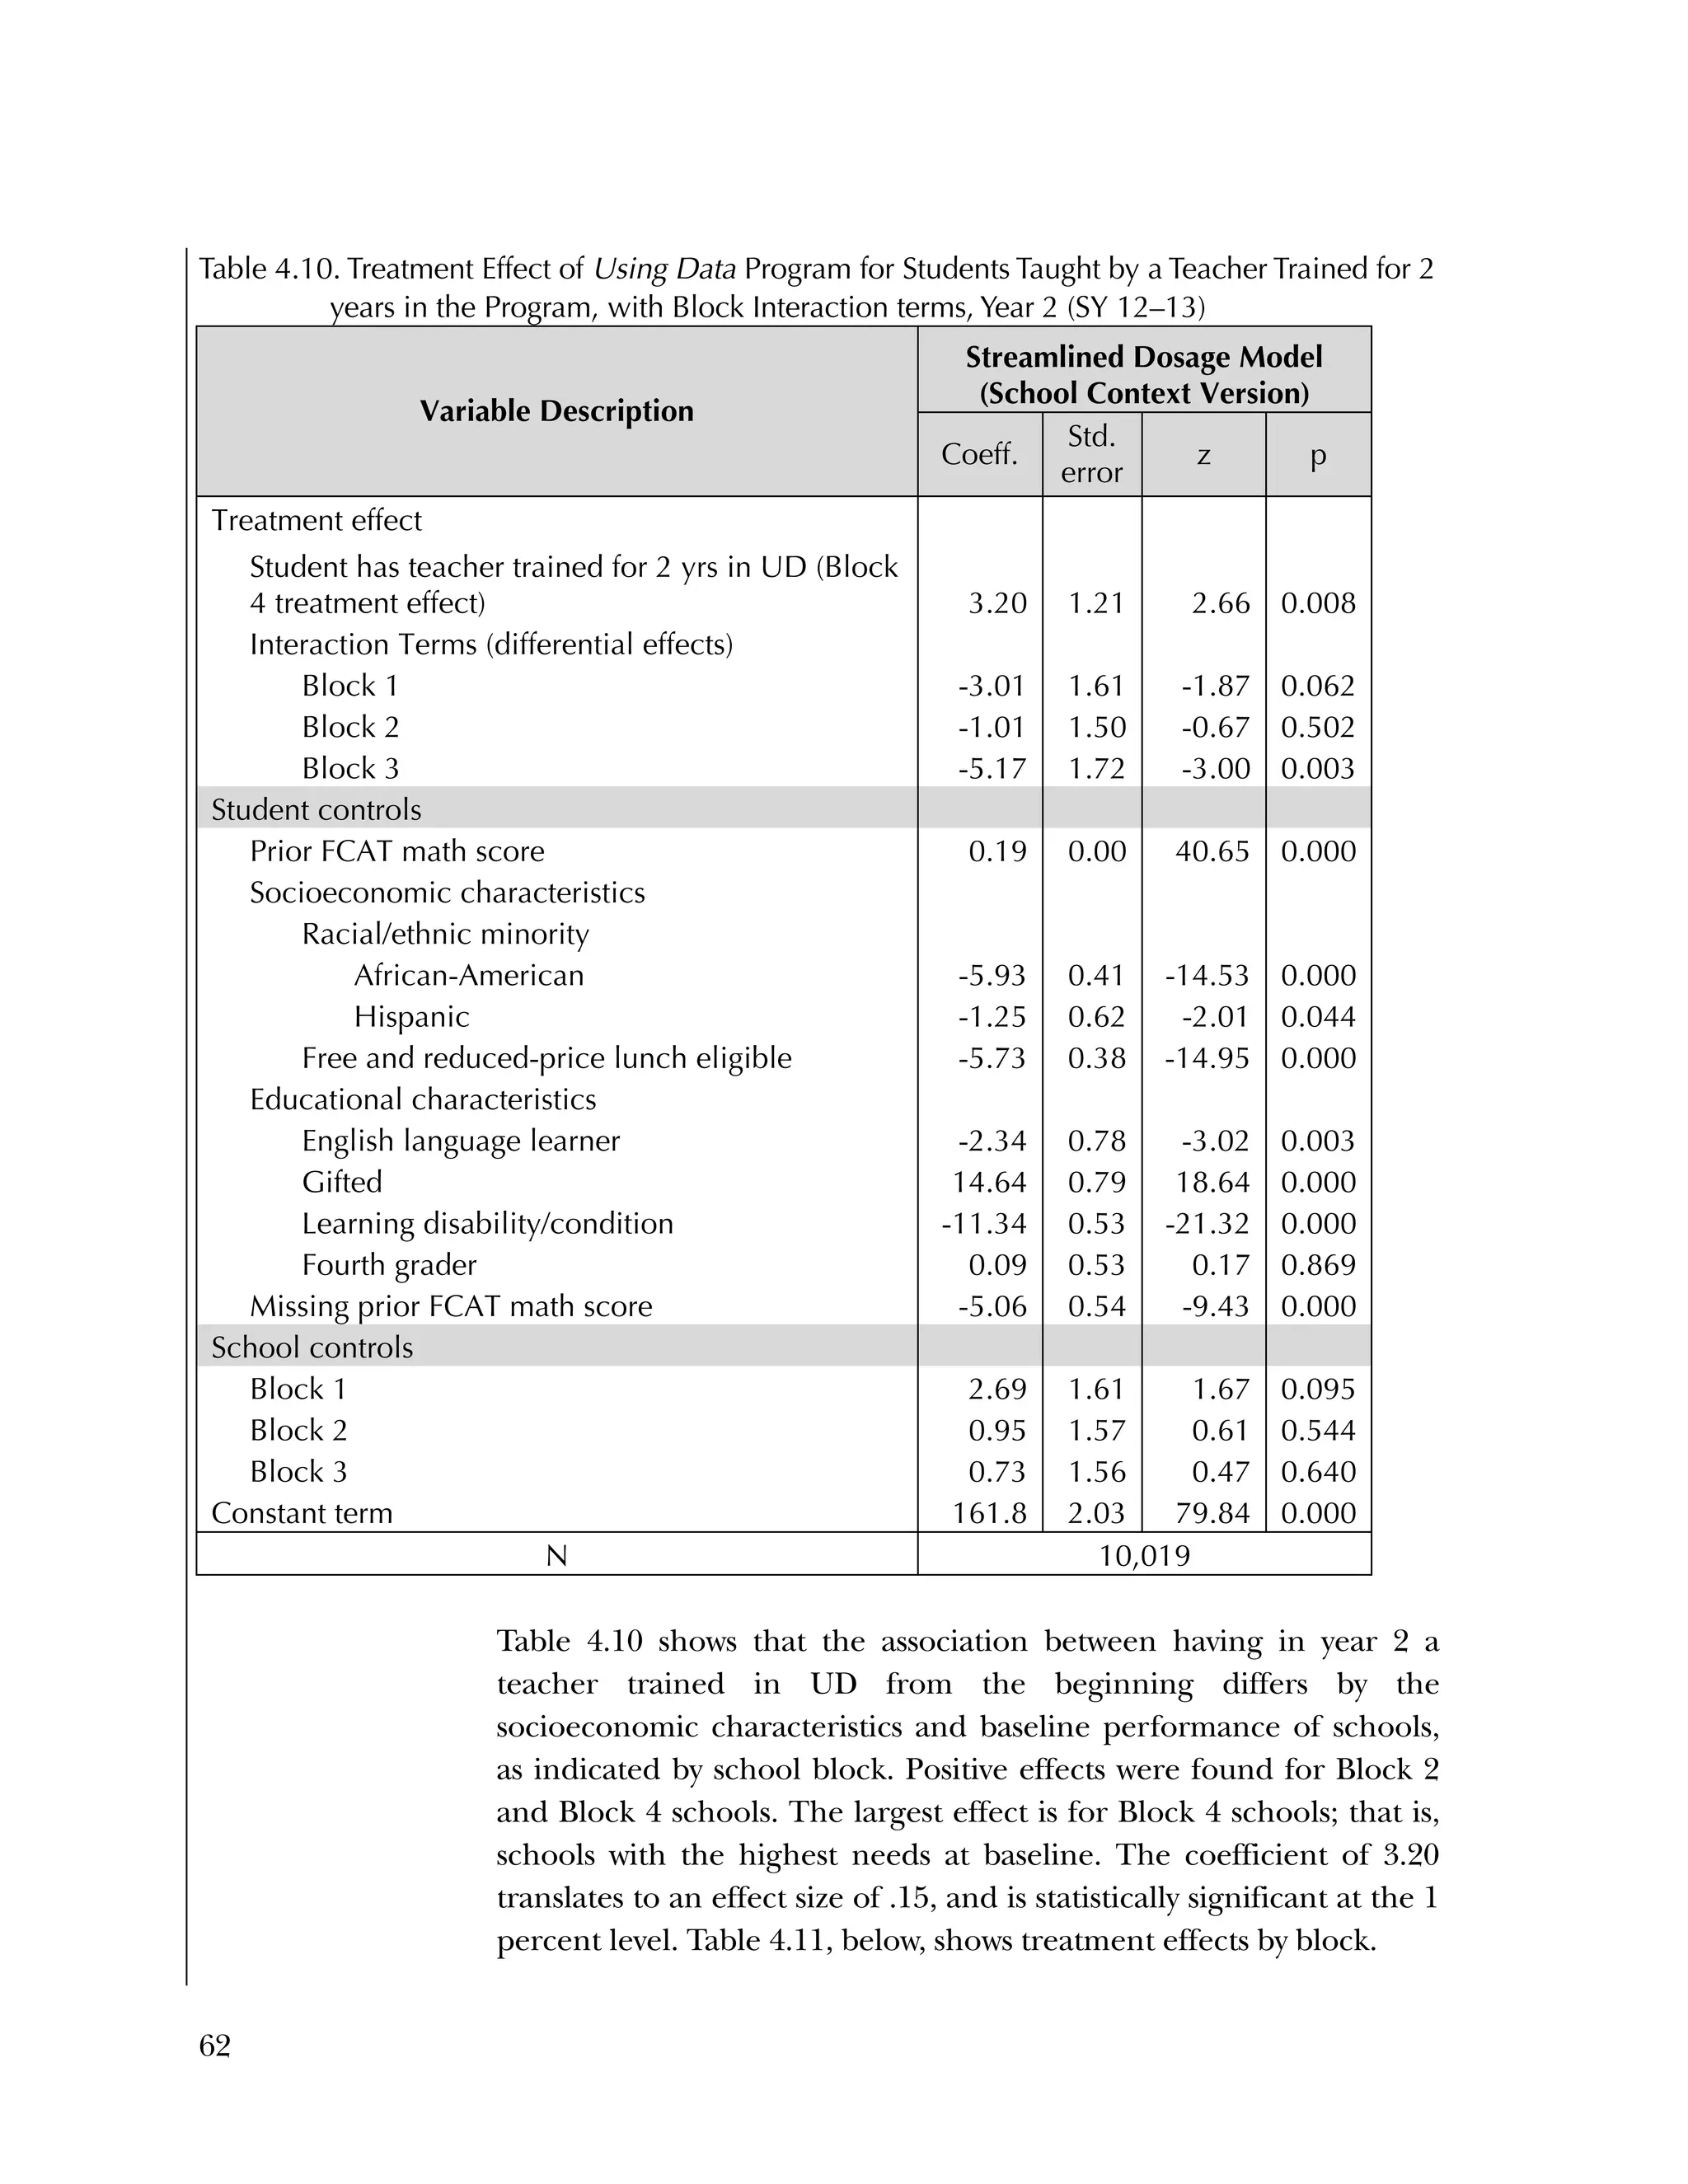
Although our evaluation did not find an overall treatment effect on
student achievement, we did estimate differences across blocks in the
size and sign of treatment effects. Referring back to figure 4.1, Block
1 schools (the lowest-needs, highest-performing schools at baseline)
showed a negative, statistically significant treatment effect (effect size
= ‐.29, p = .004); whereas Block 4 schools (the highest-needs, lowest-](https://image.slidesharecdn.com/40e478df-c39b-4dd7-8520-f99976663650-151230202544/75/Using-Data-76-2048.jpg)


![Used to identify
Classification level
87
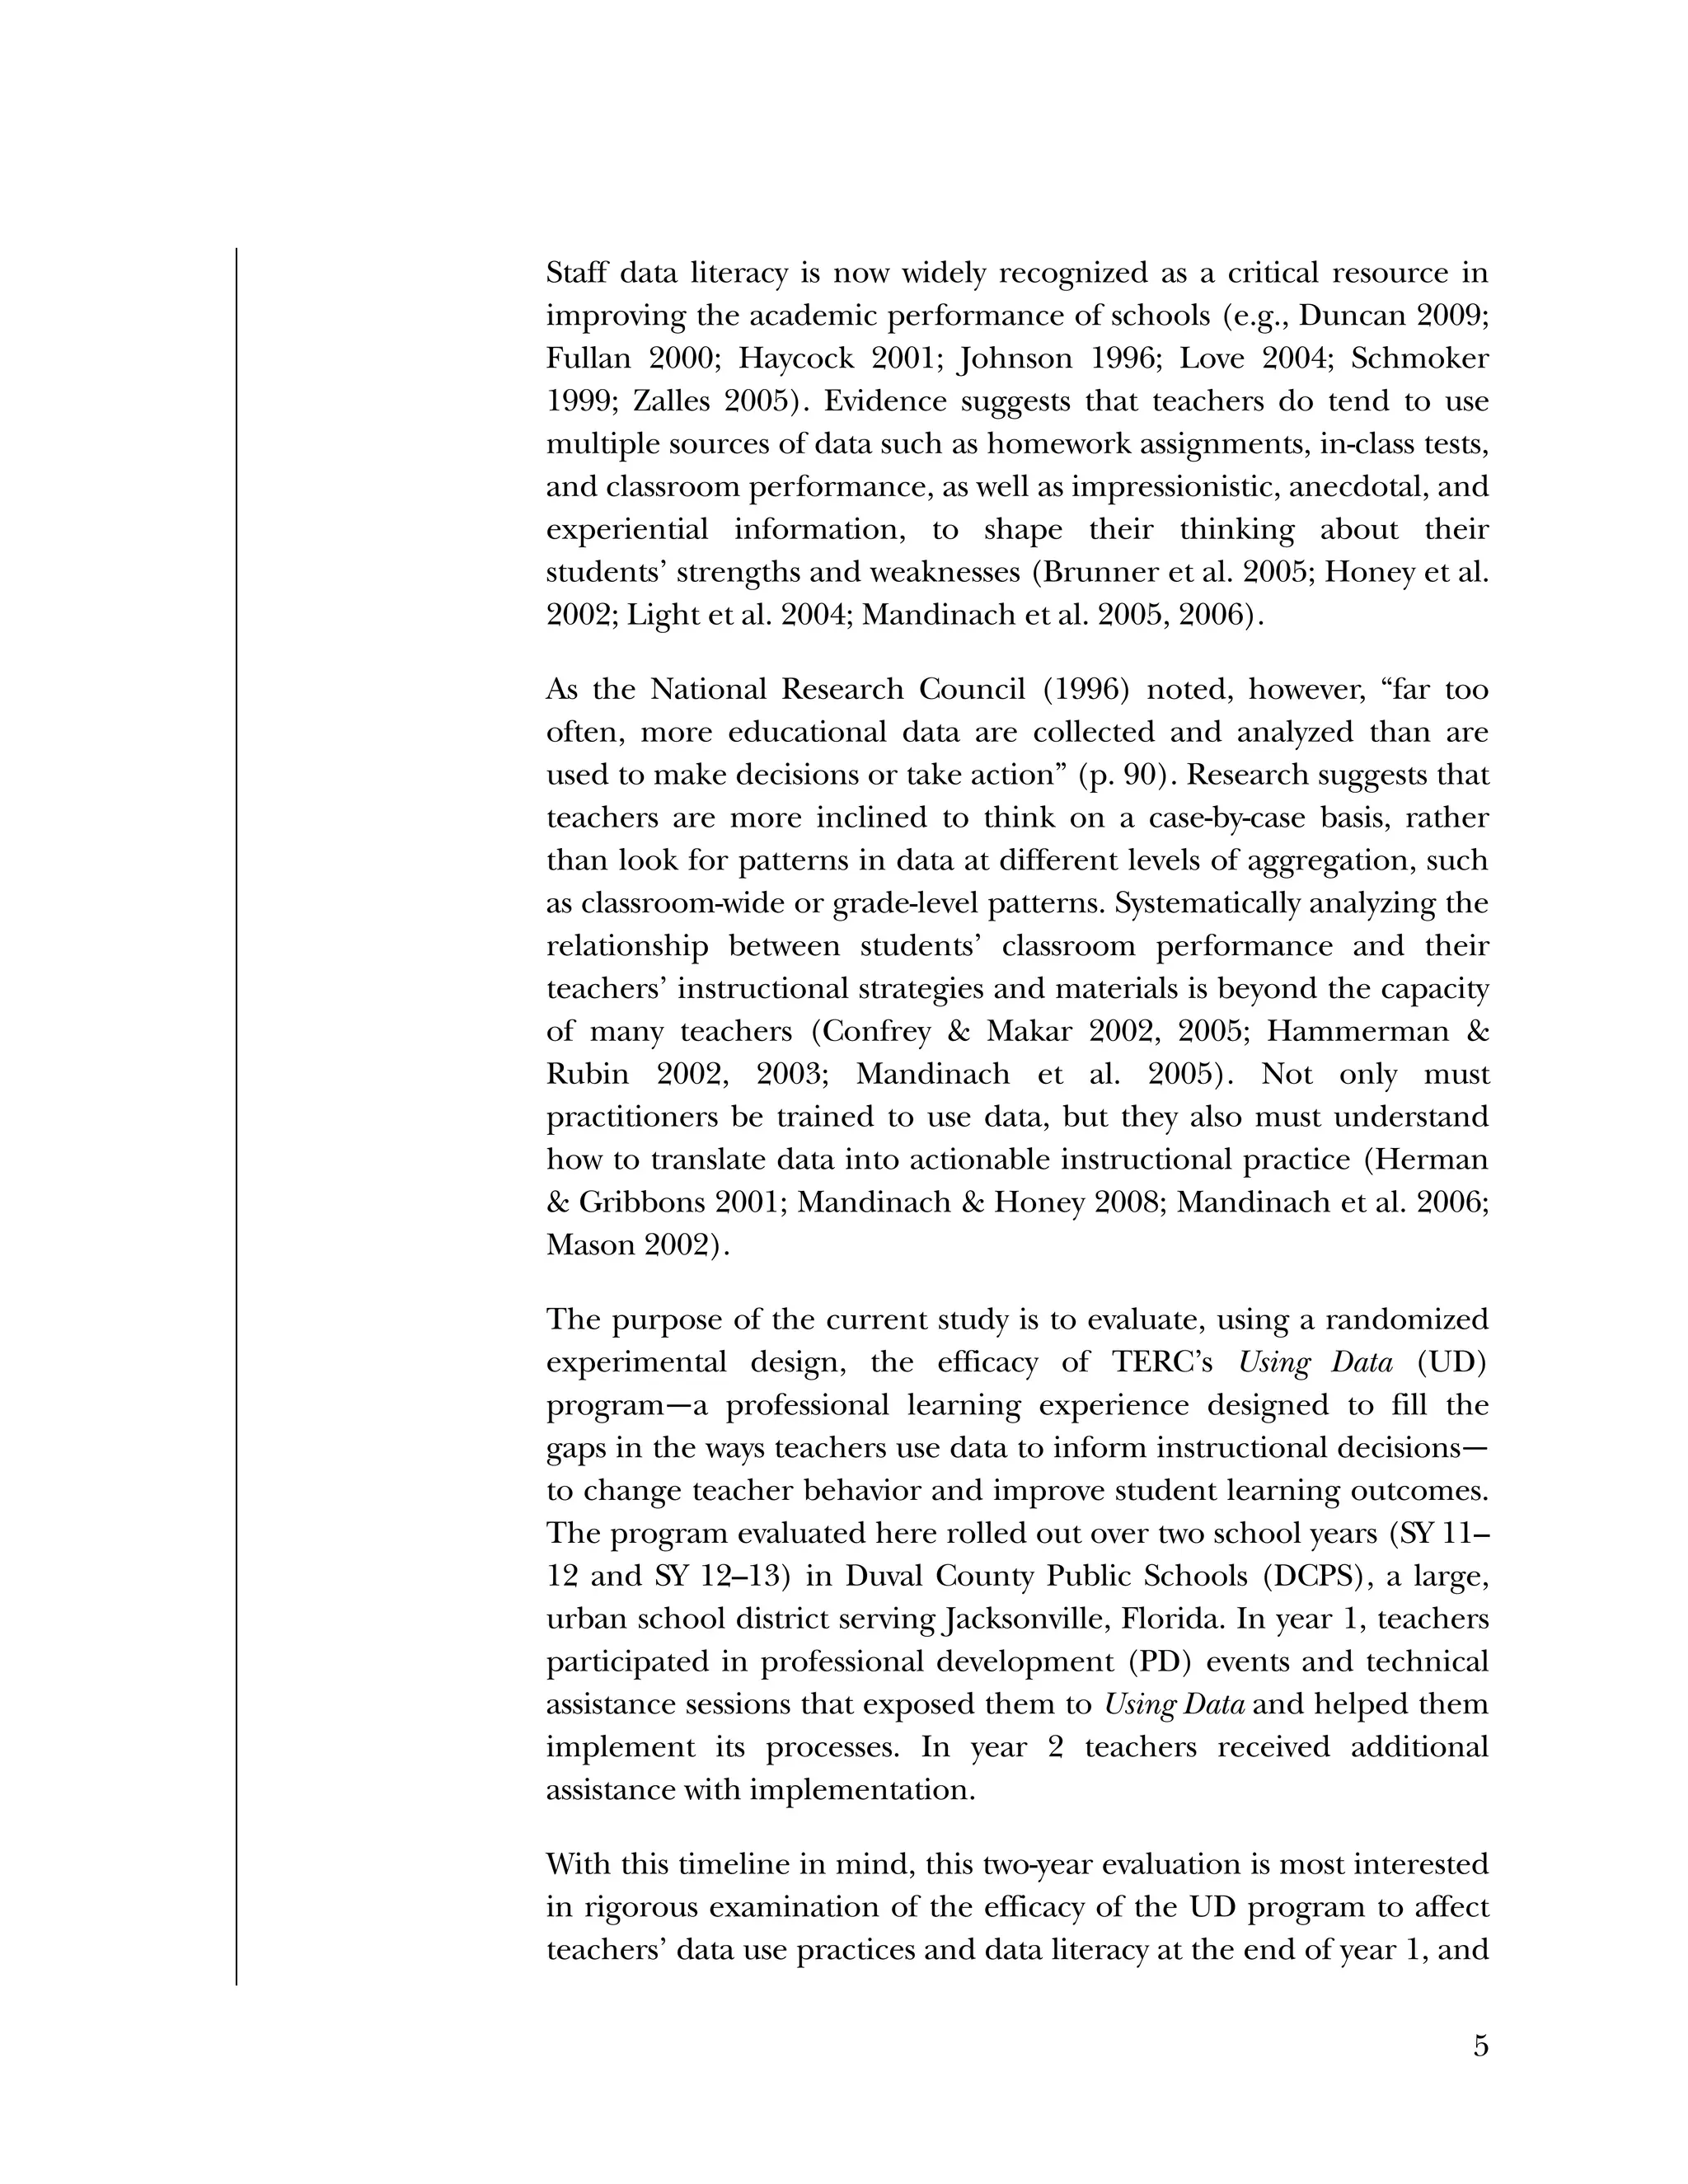
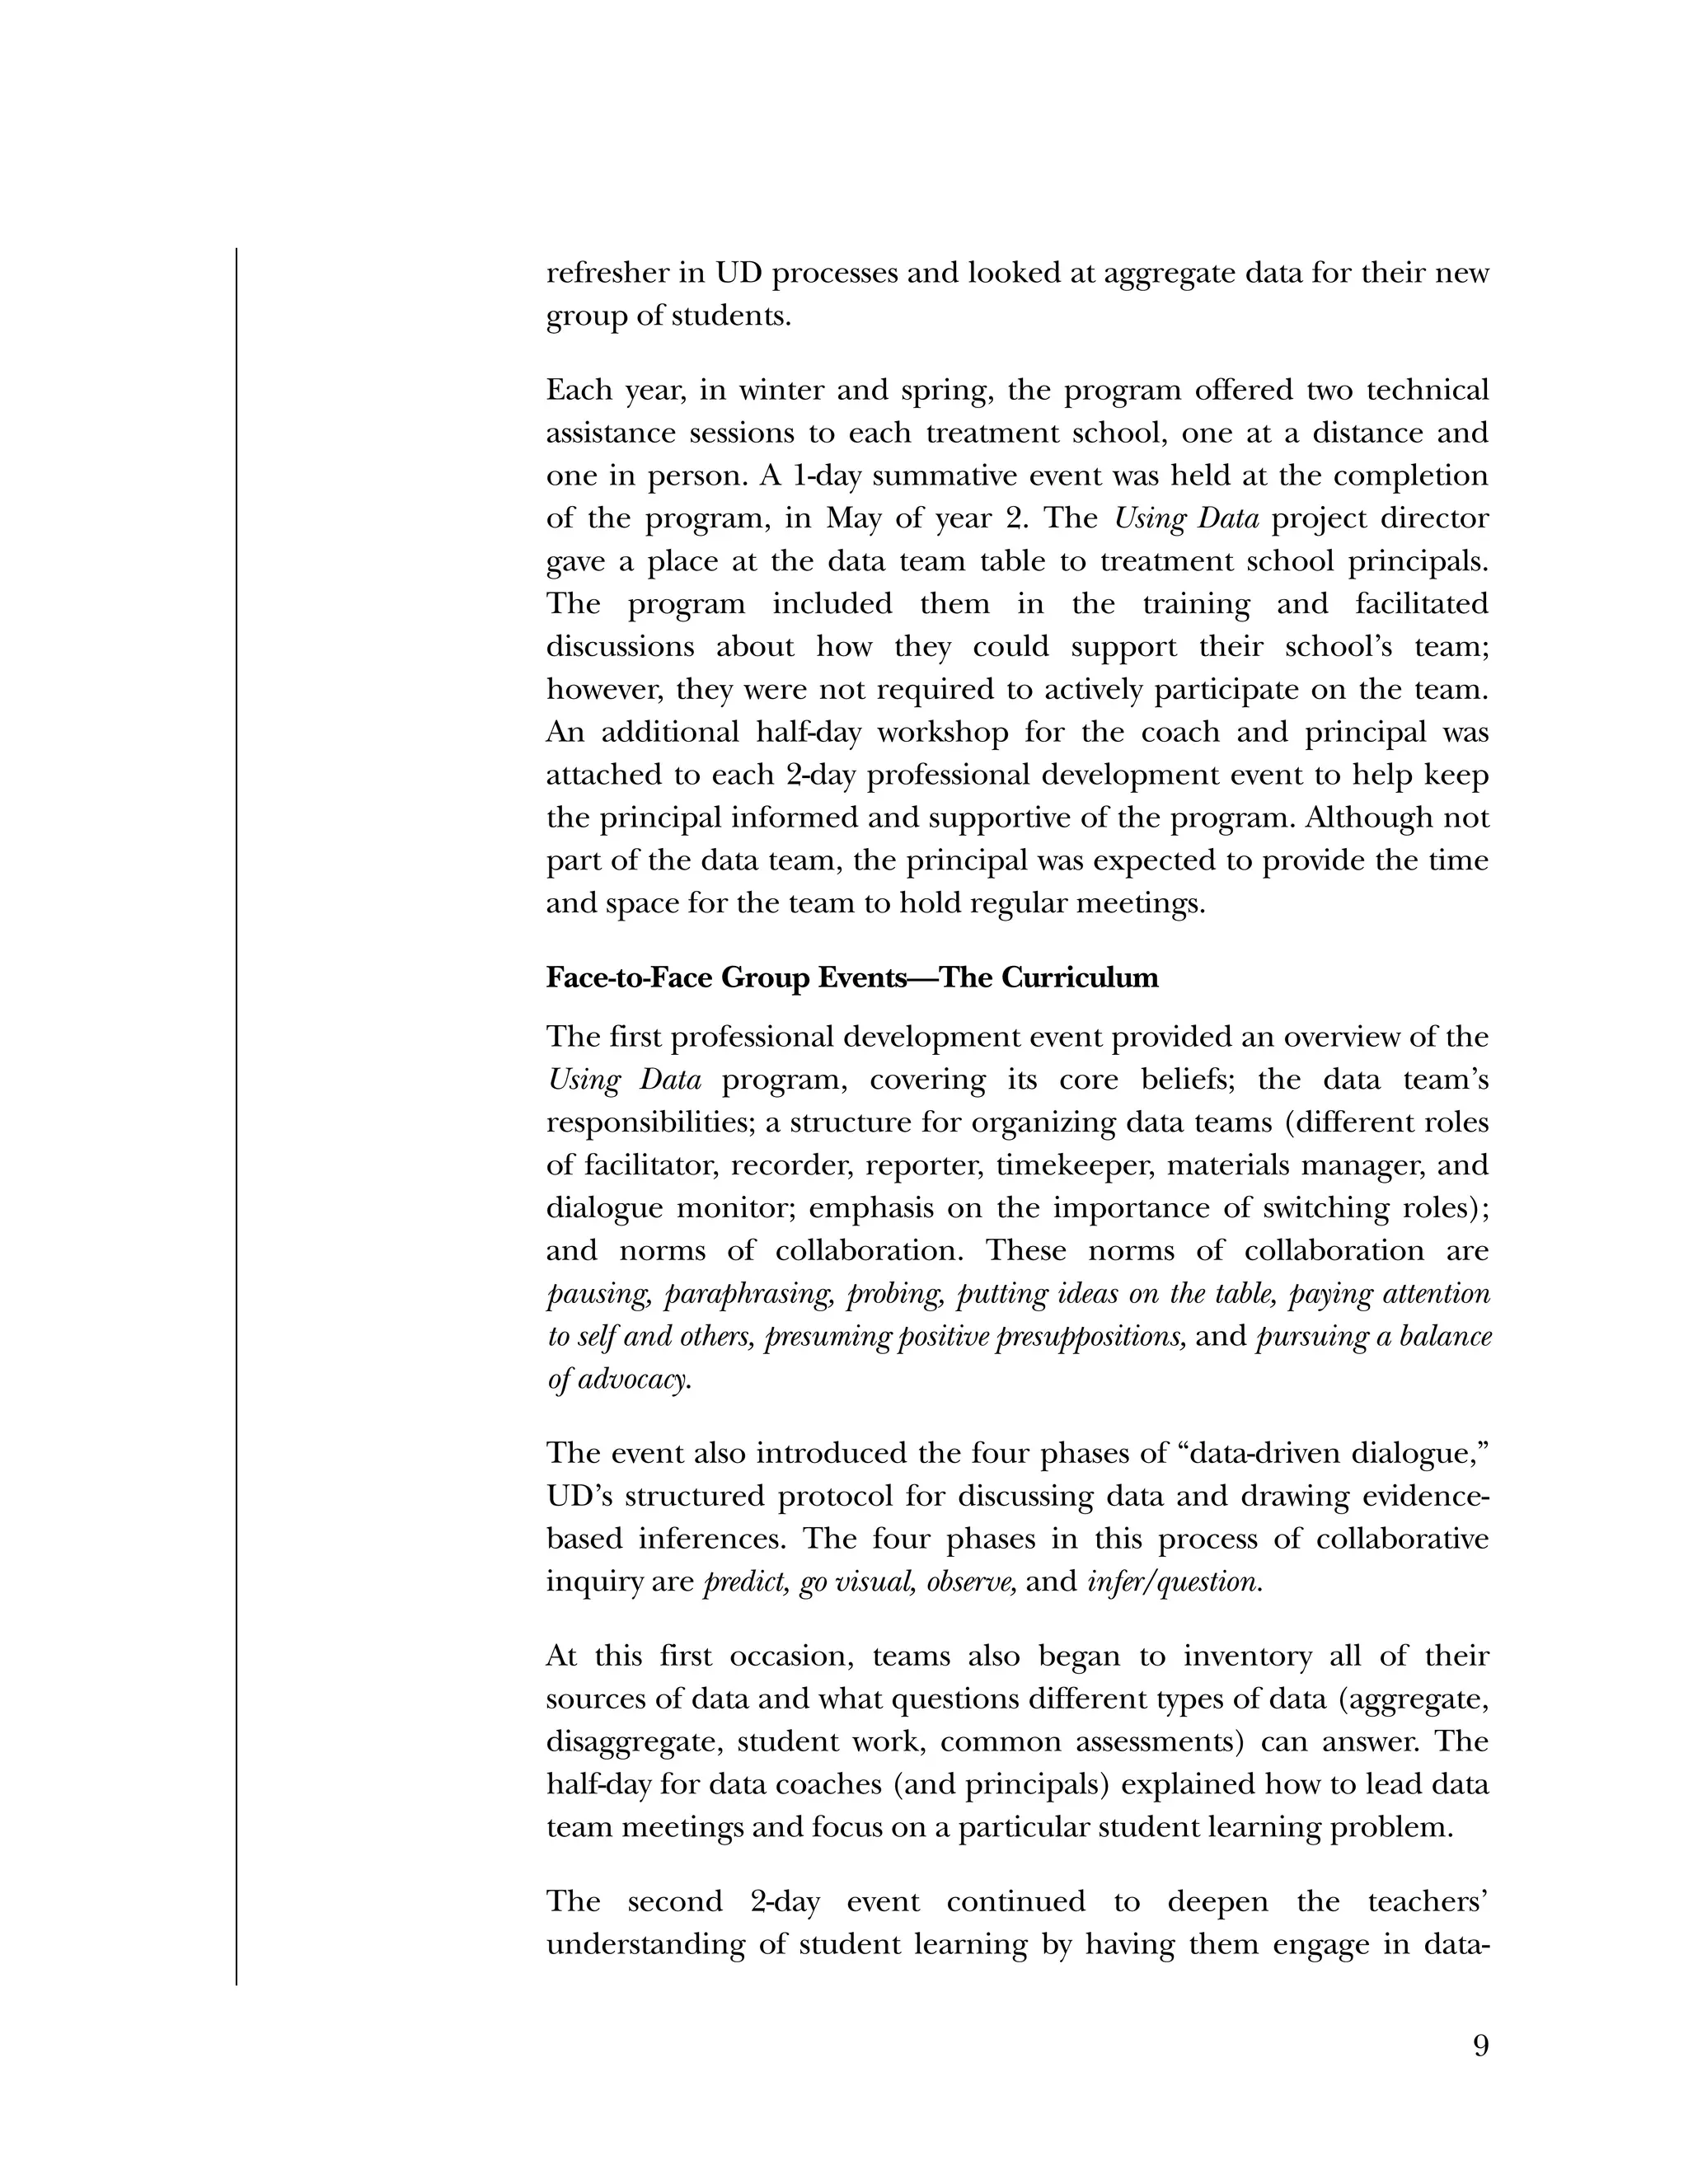
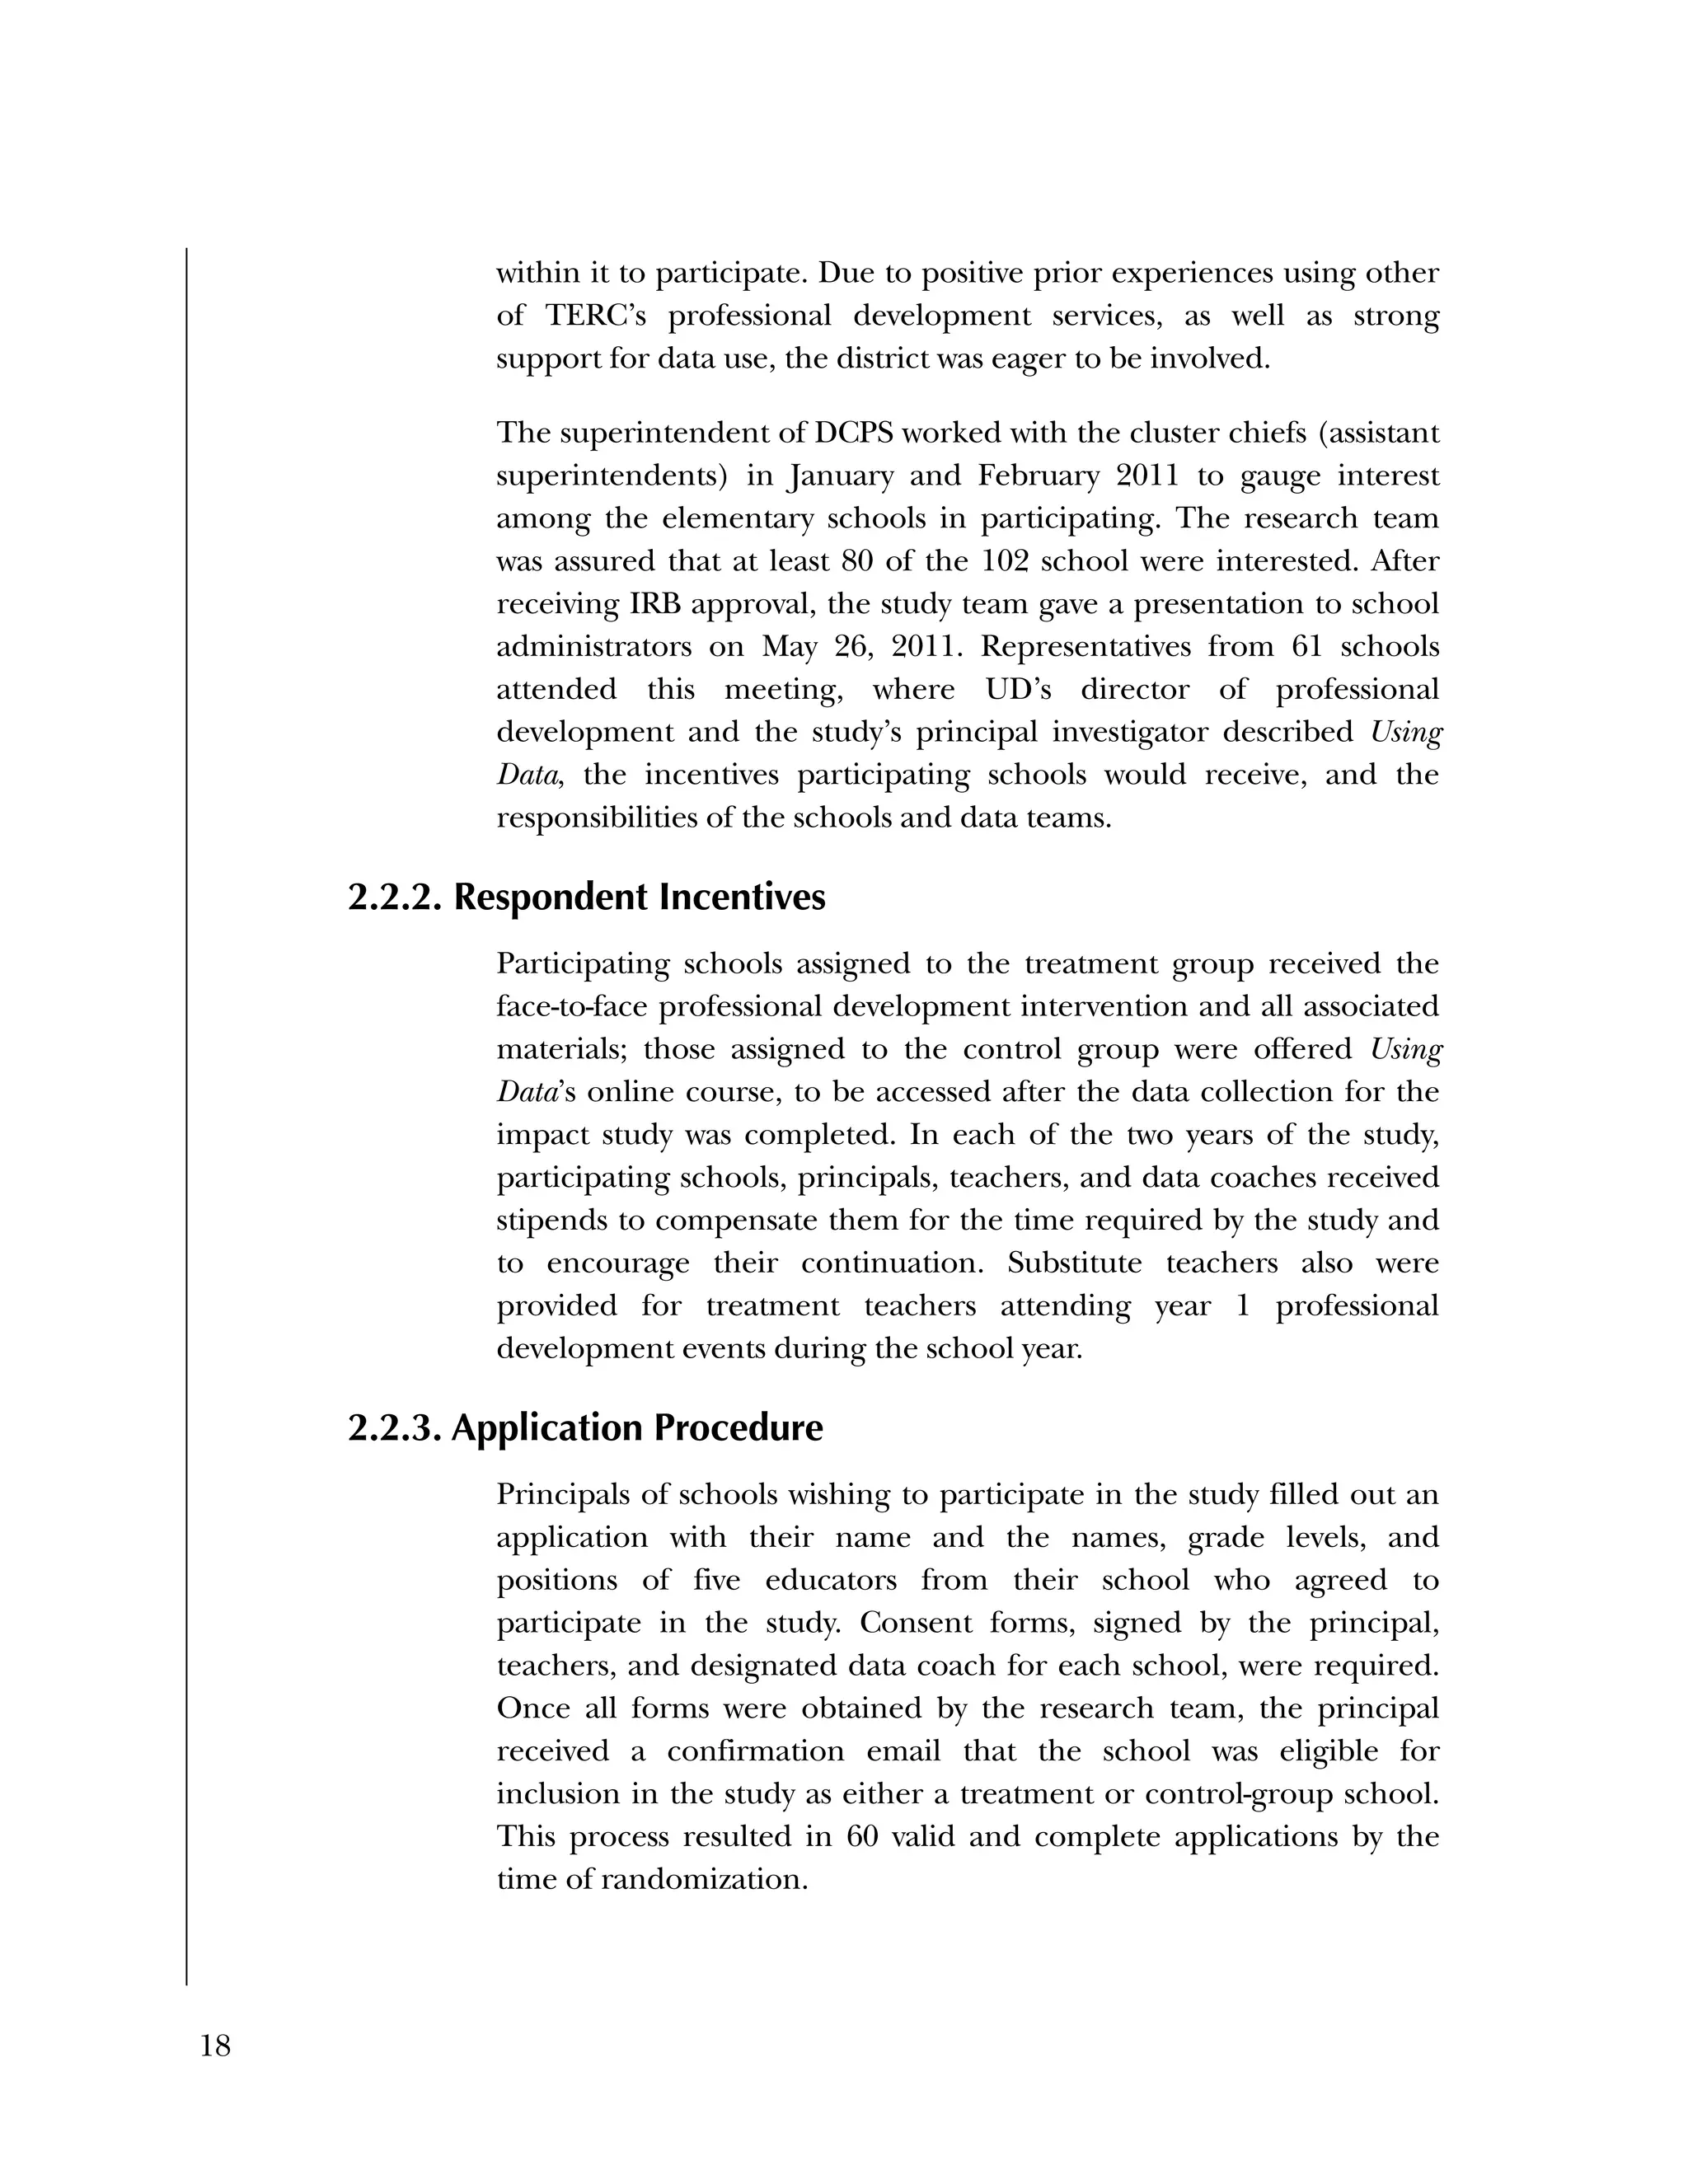
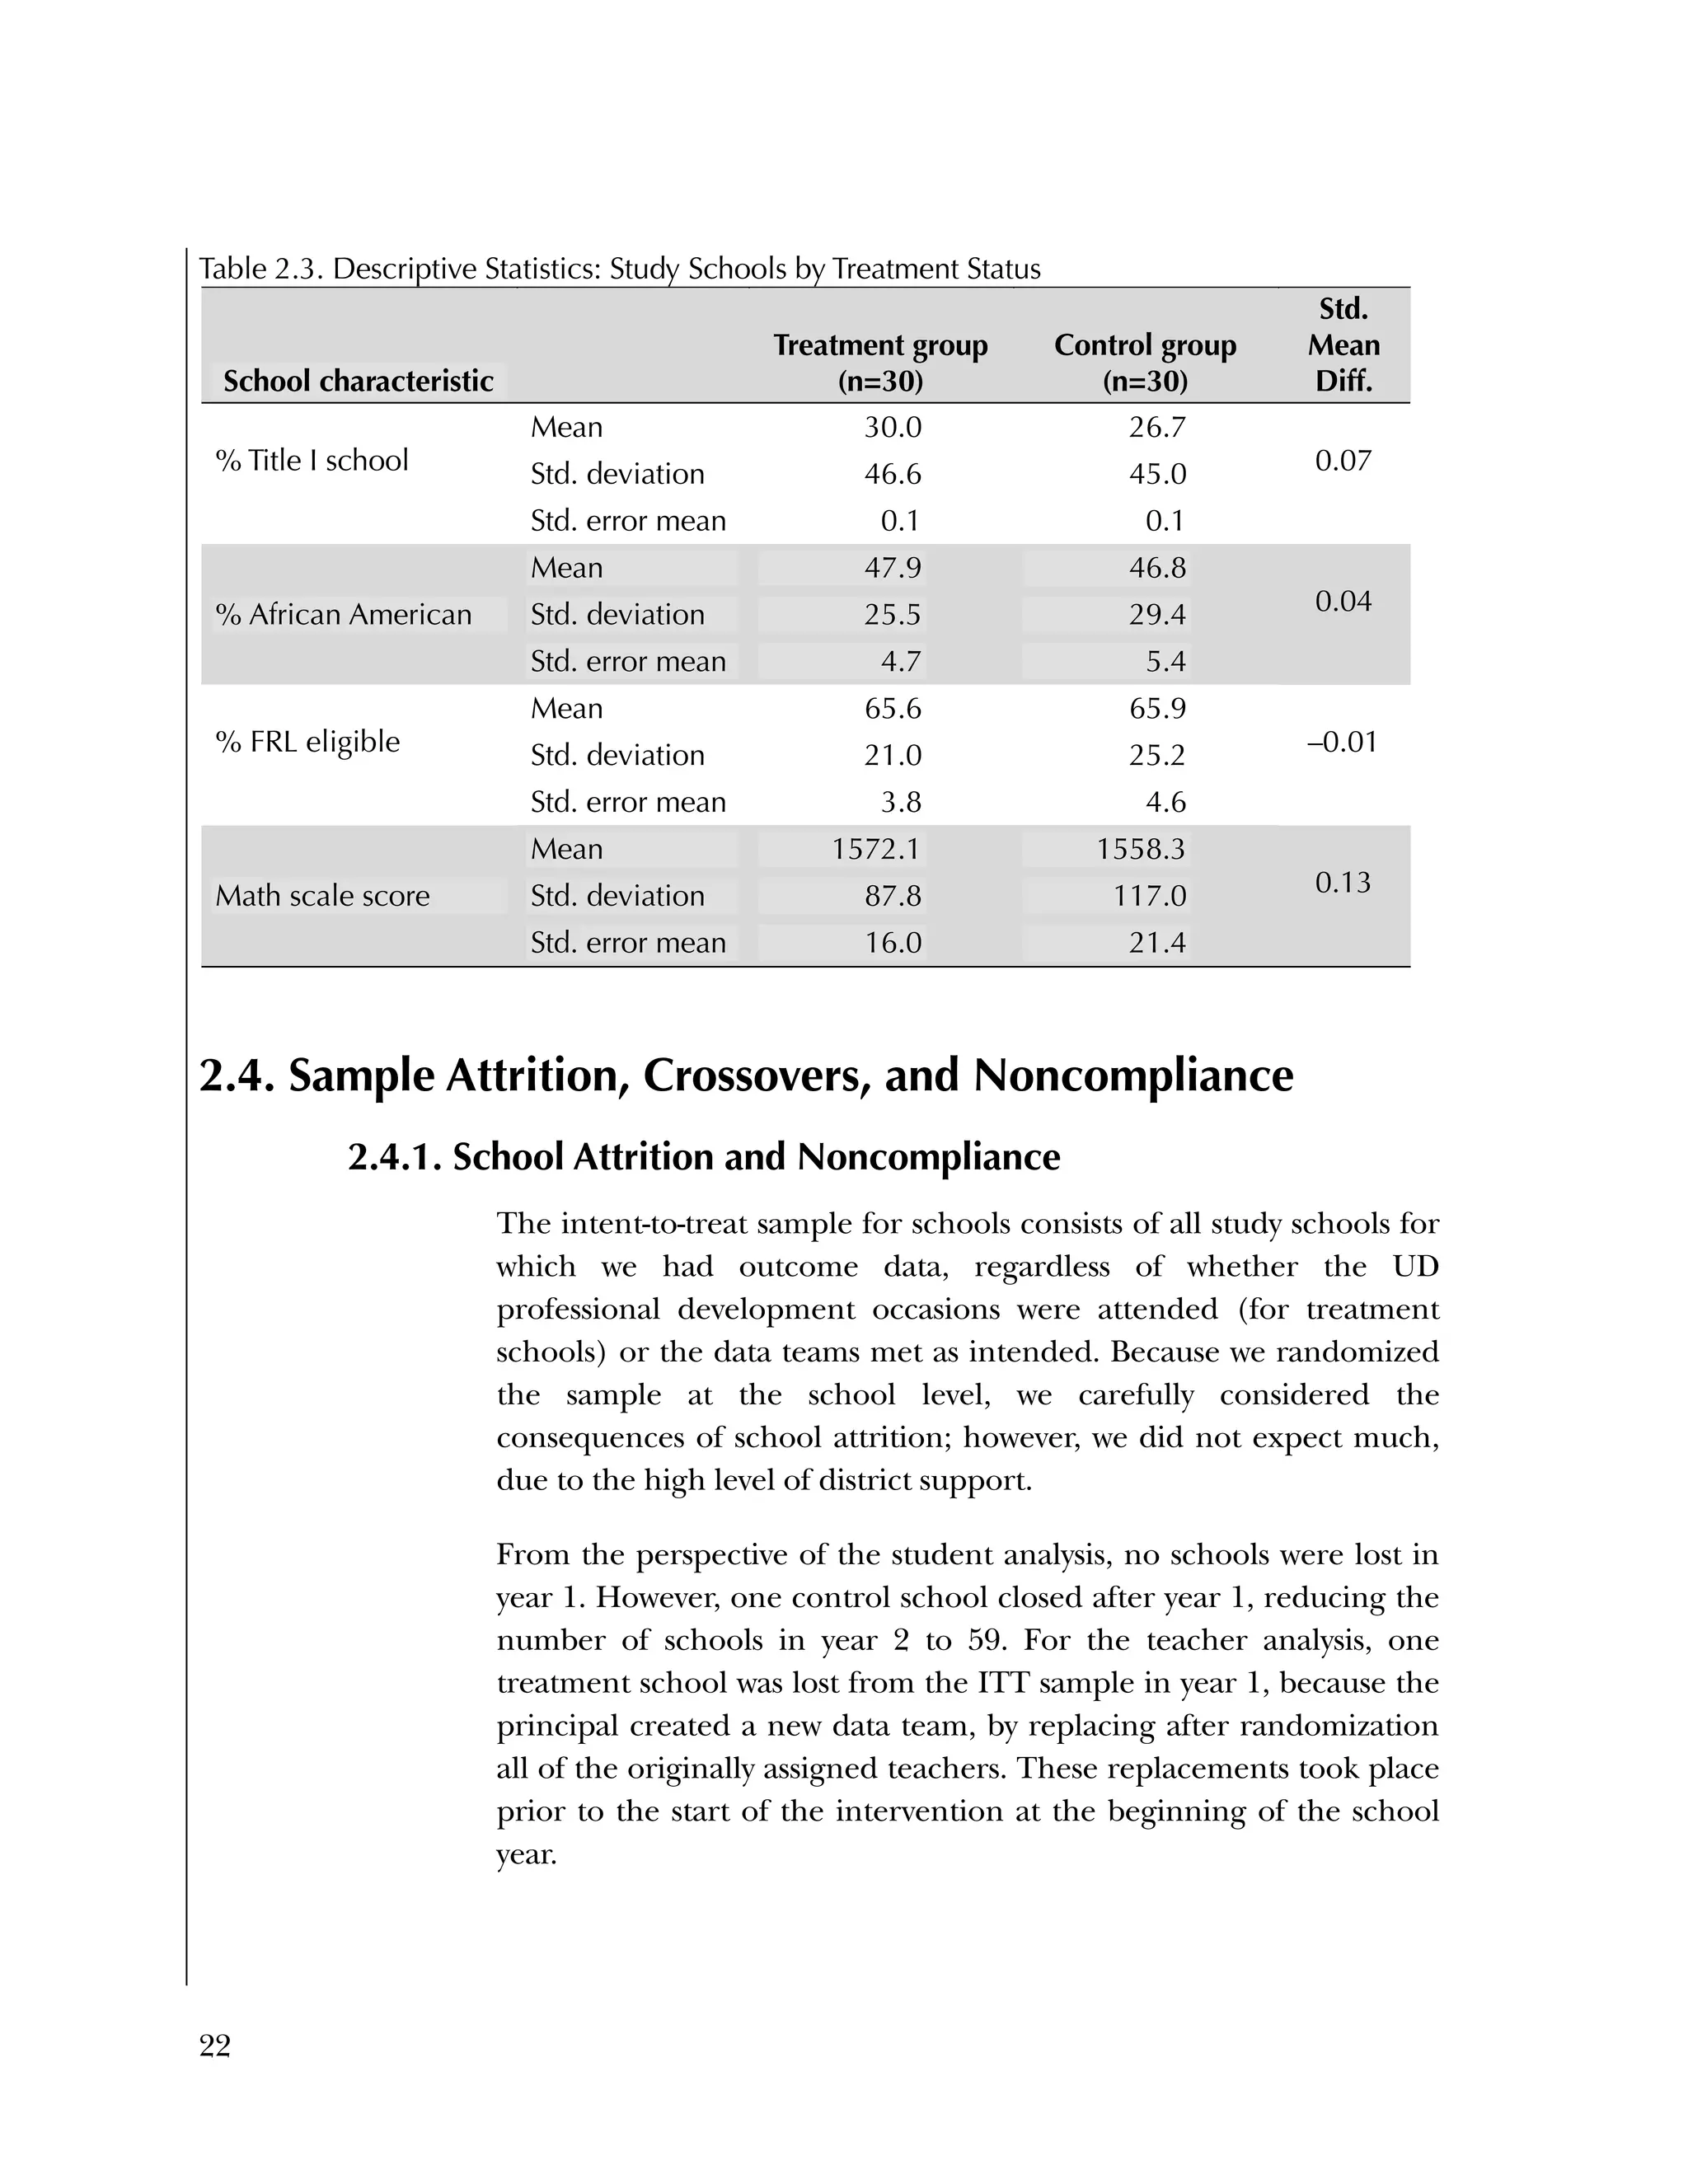
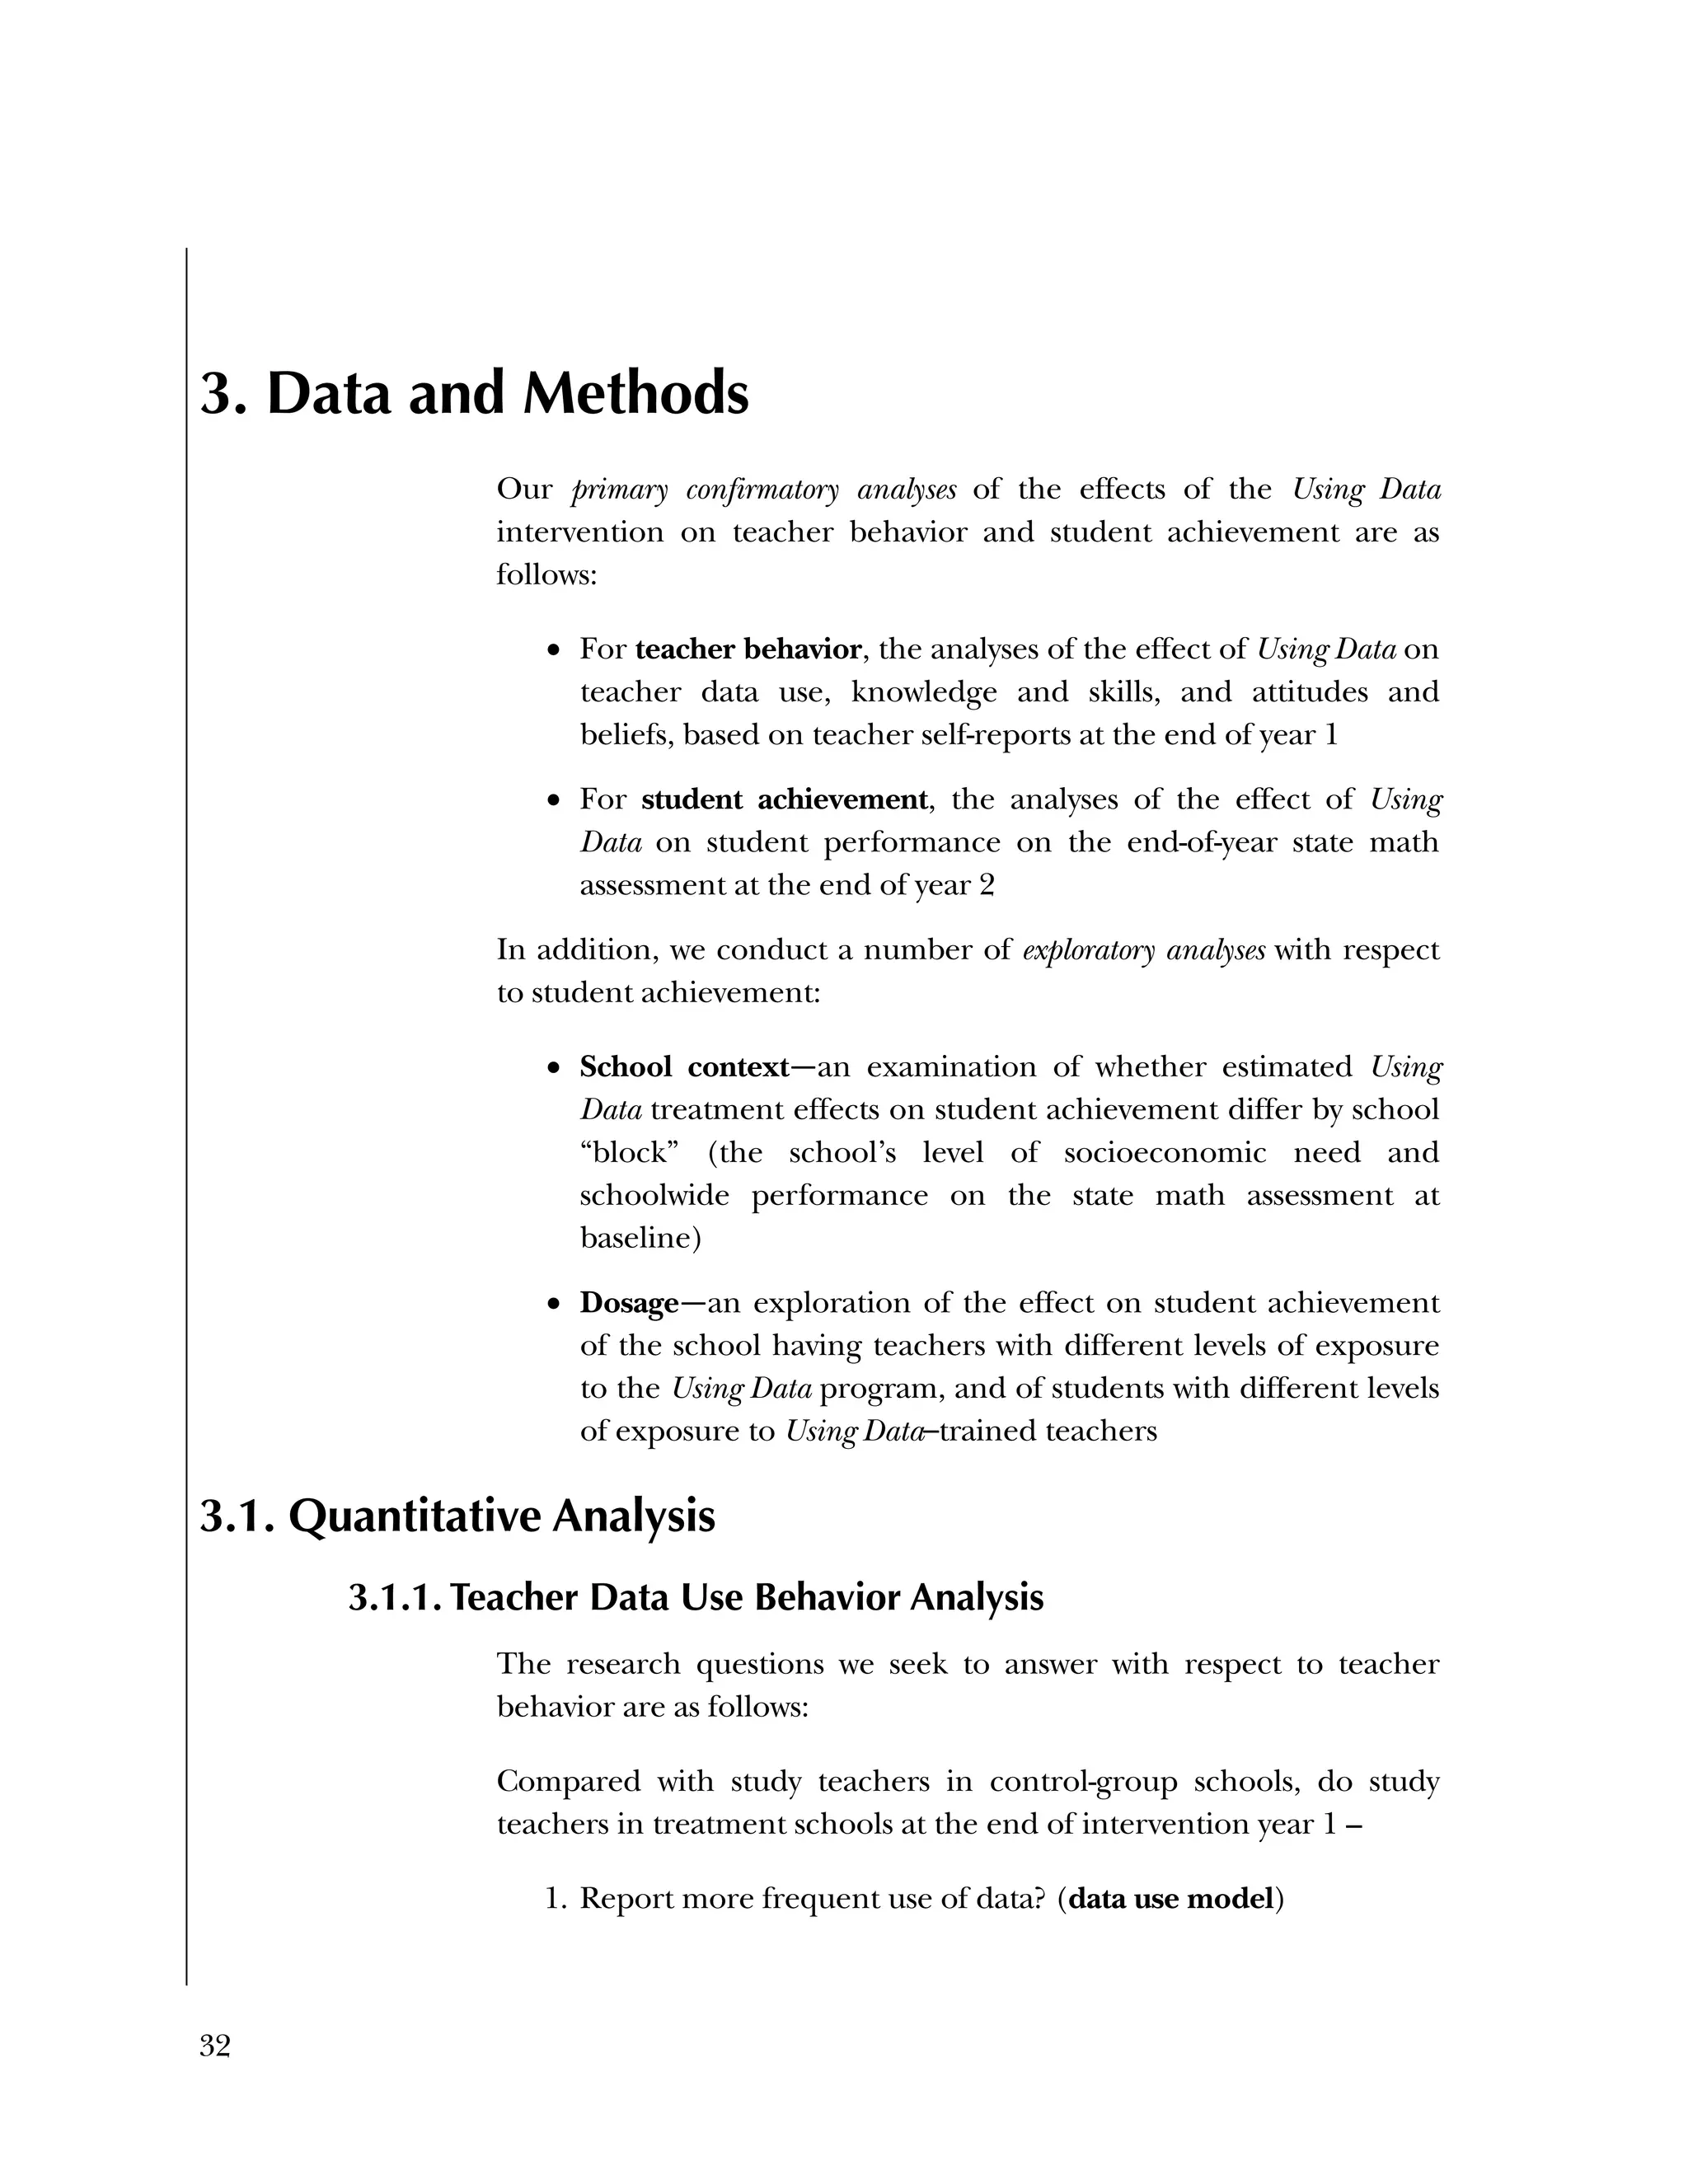
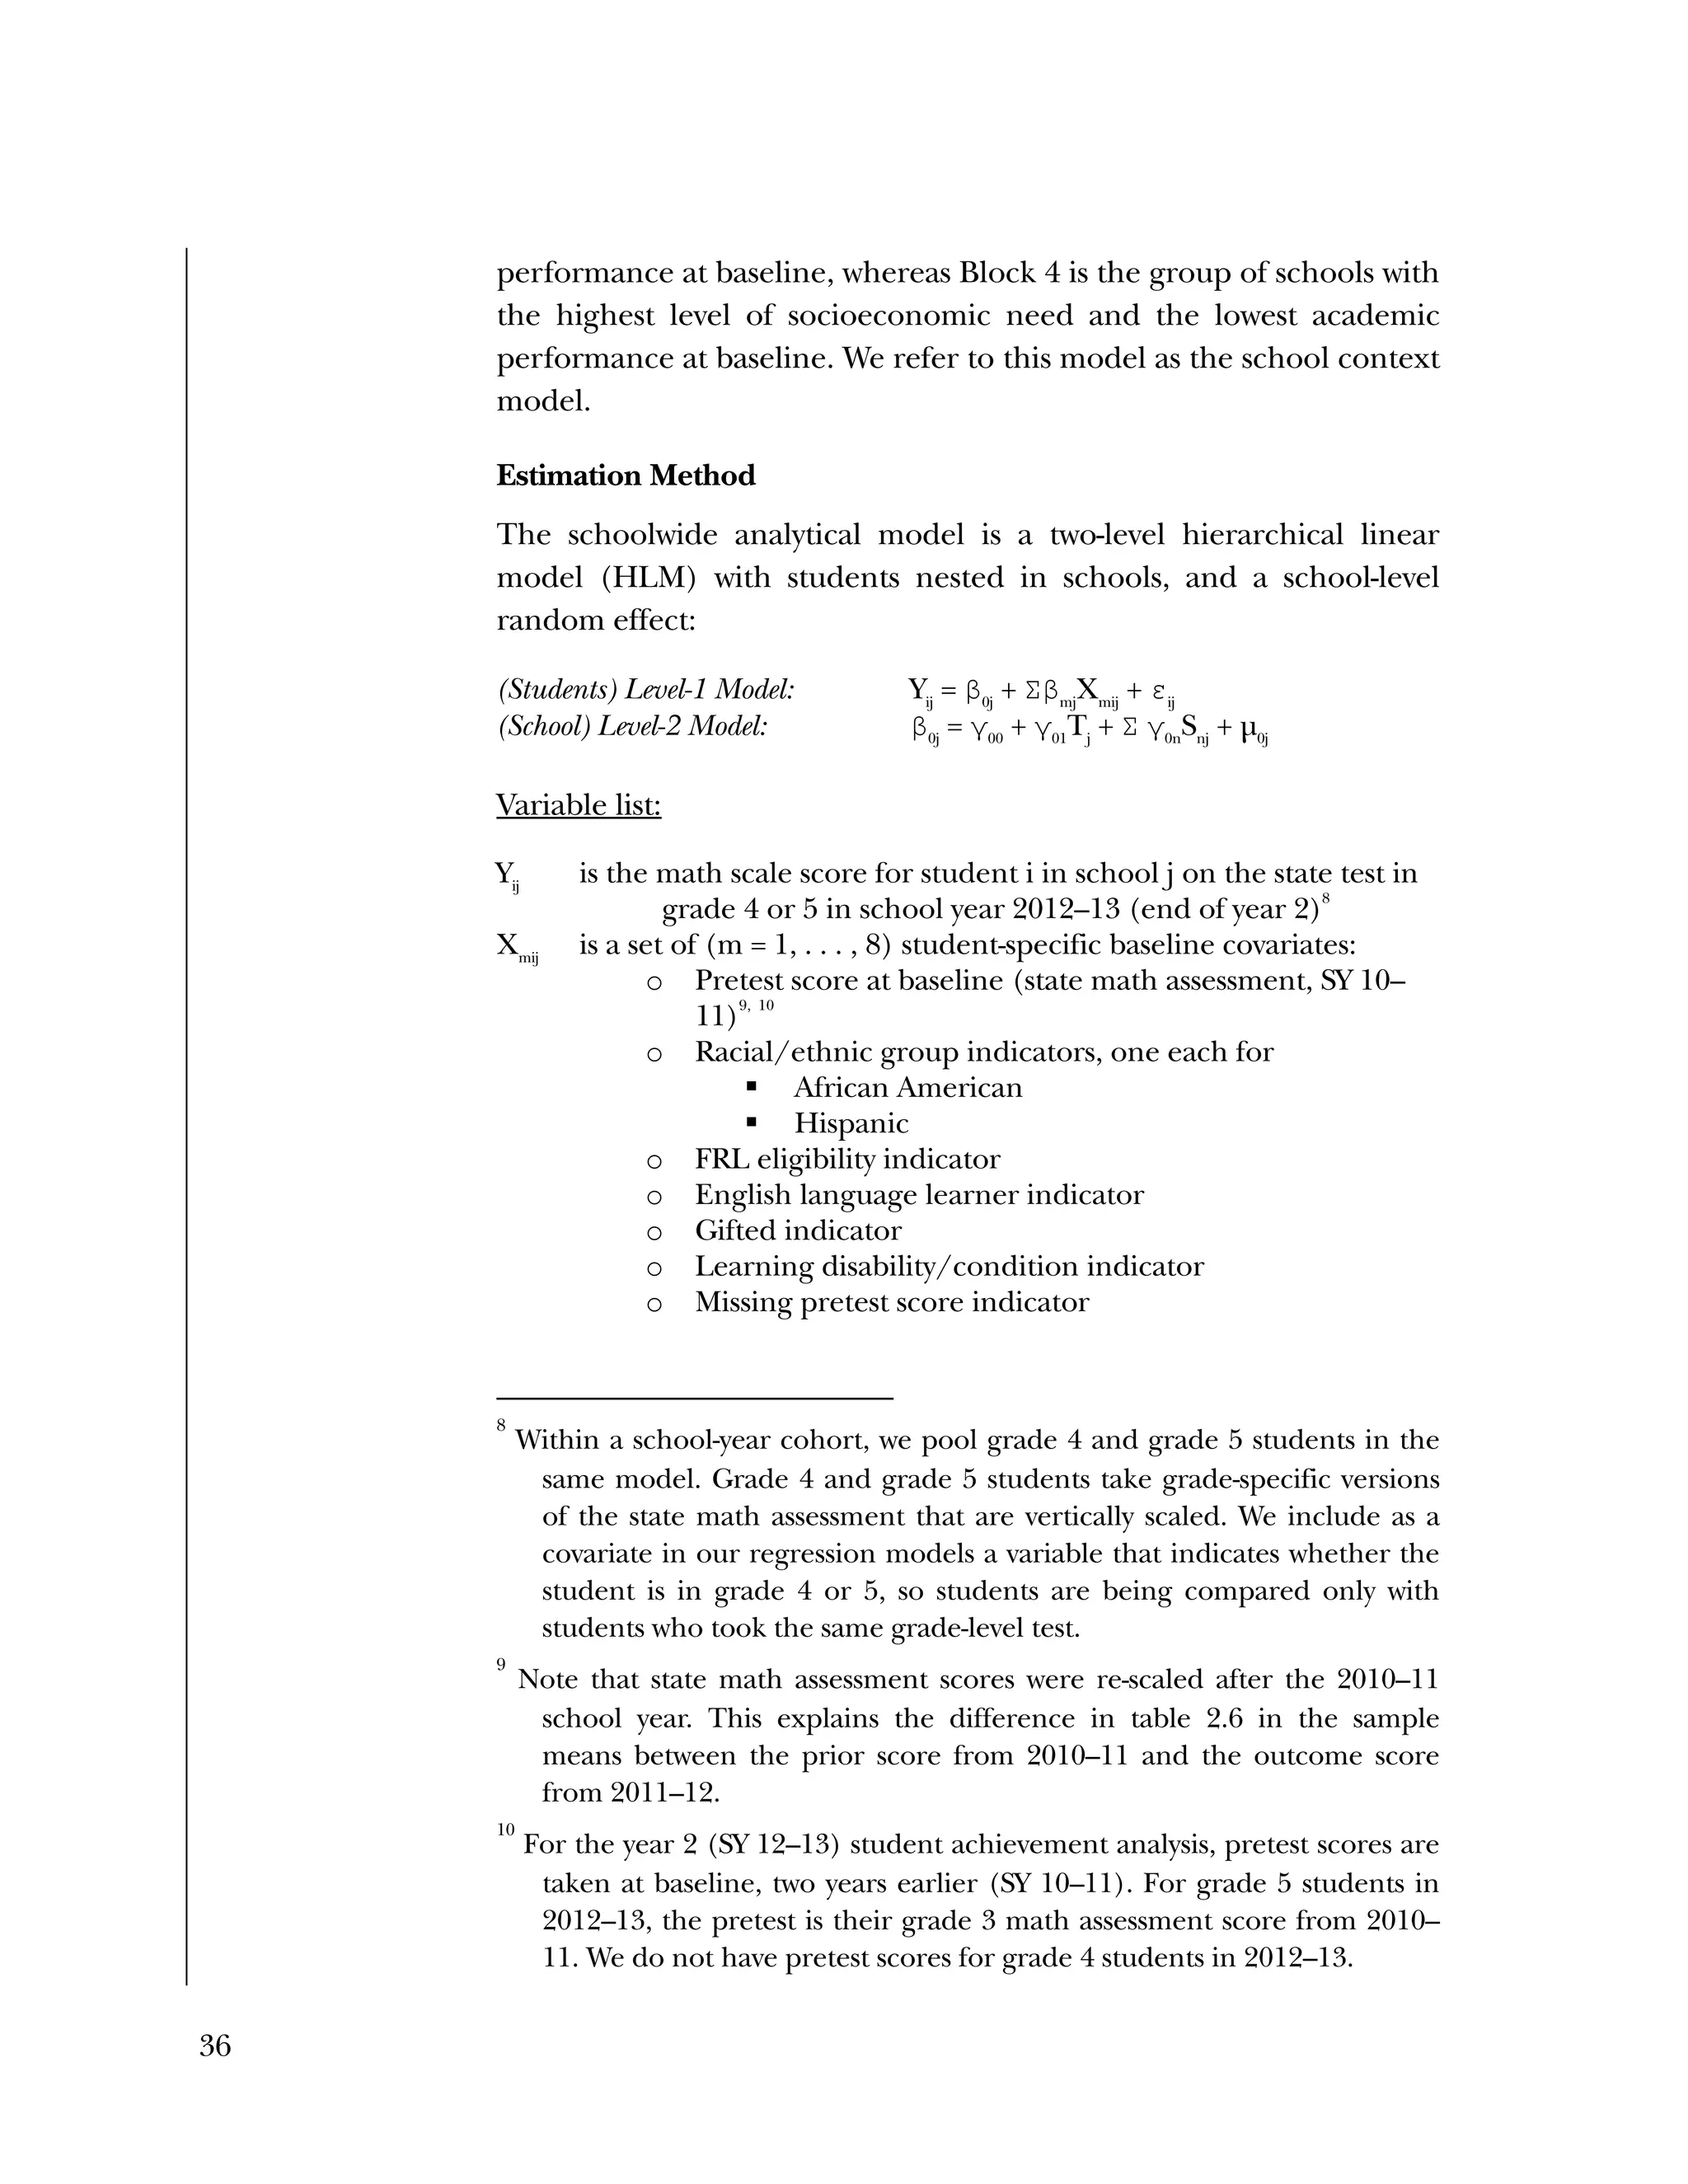
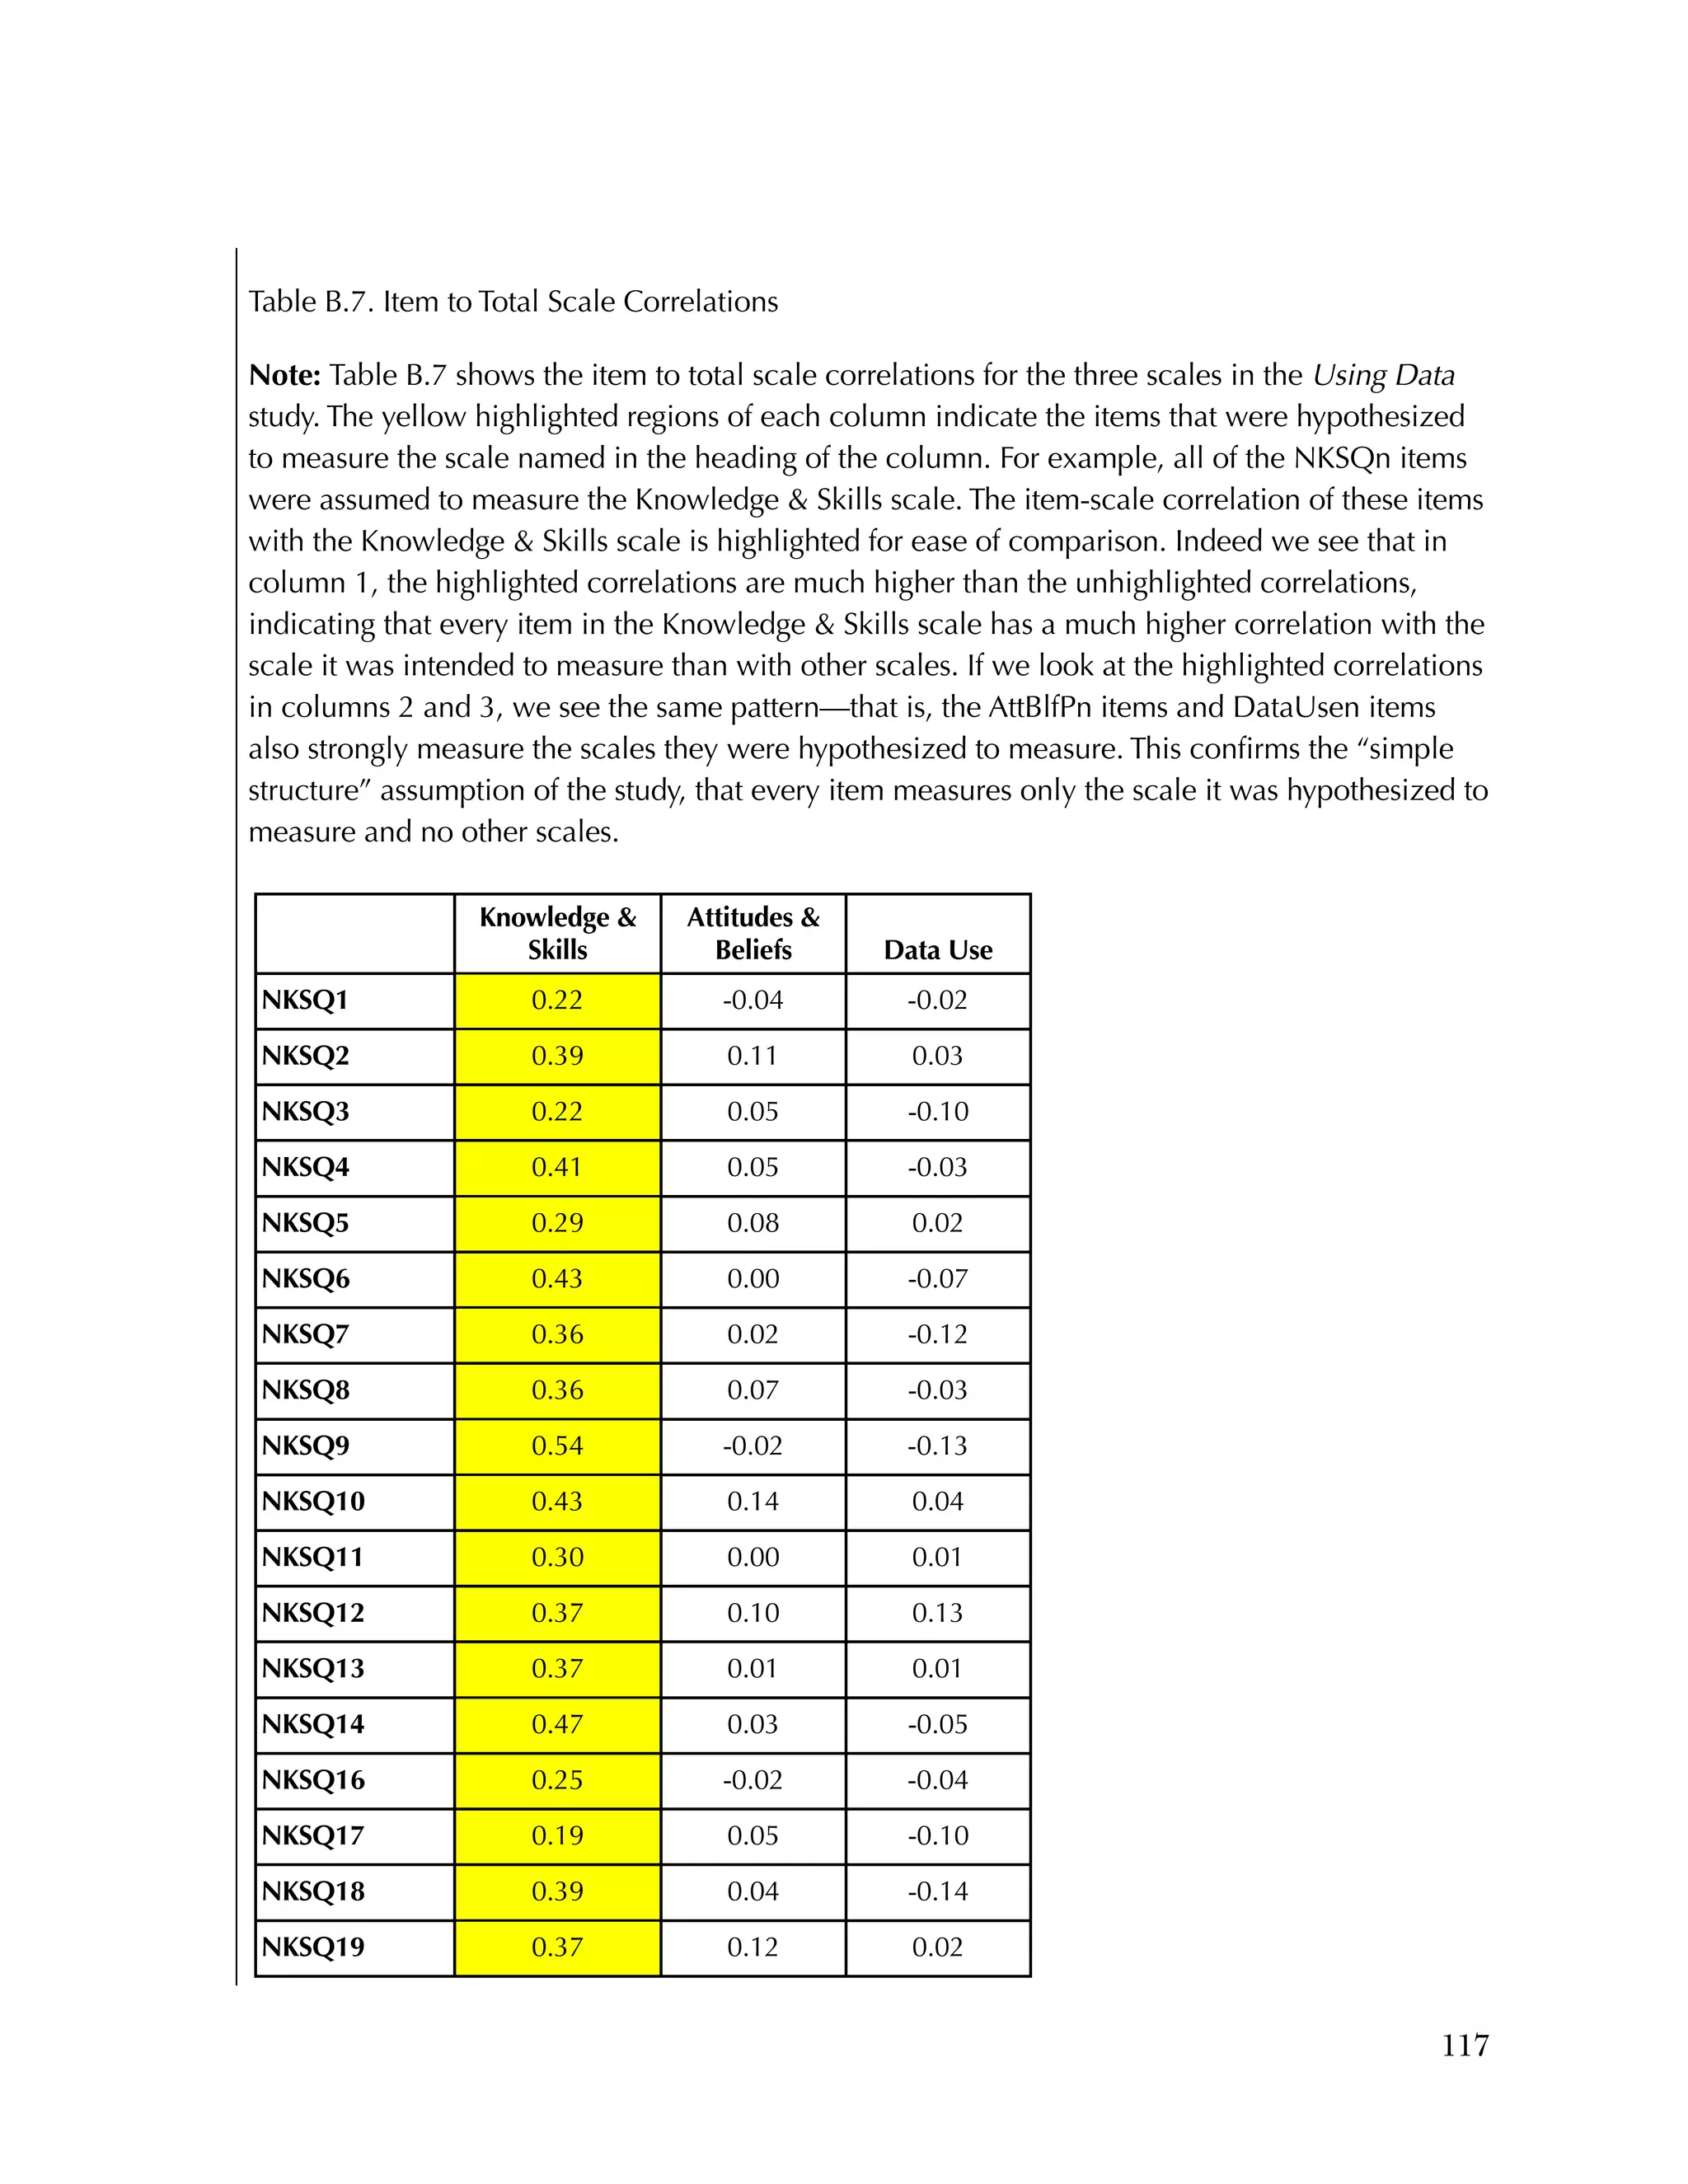
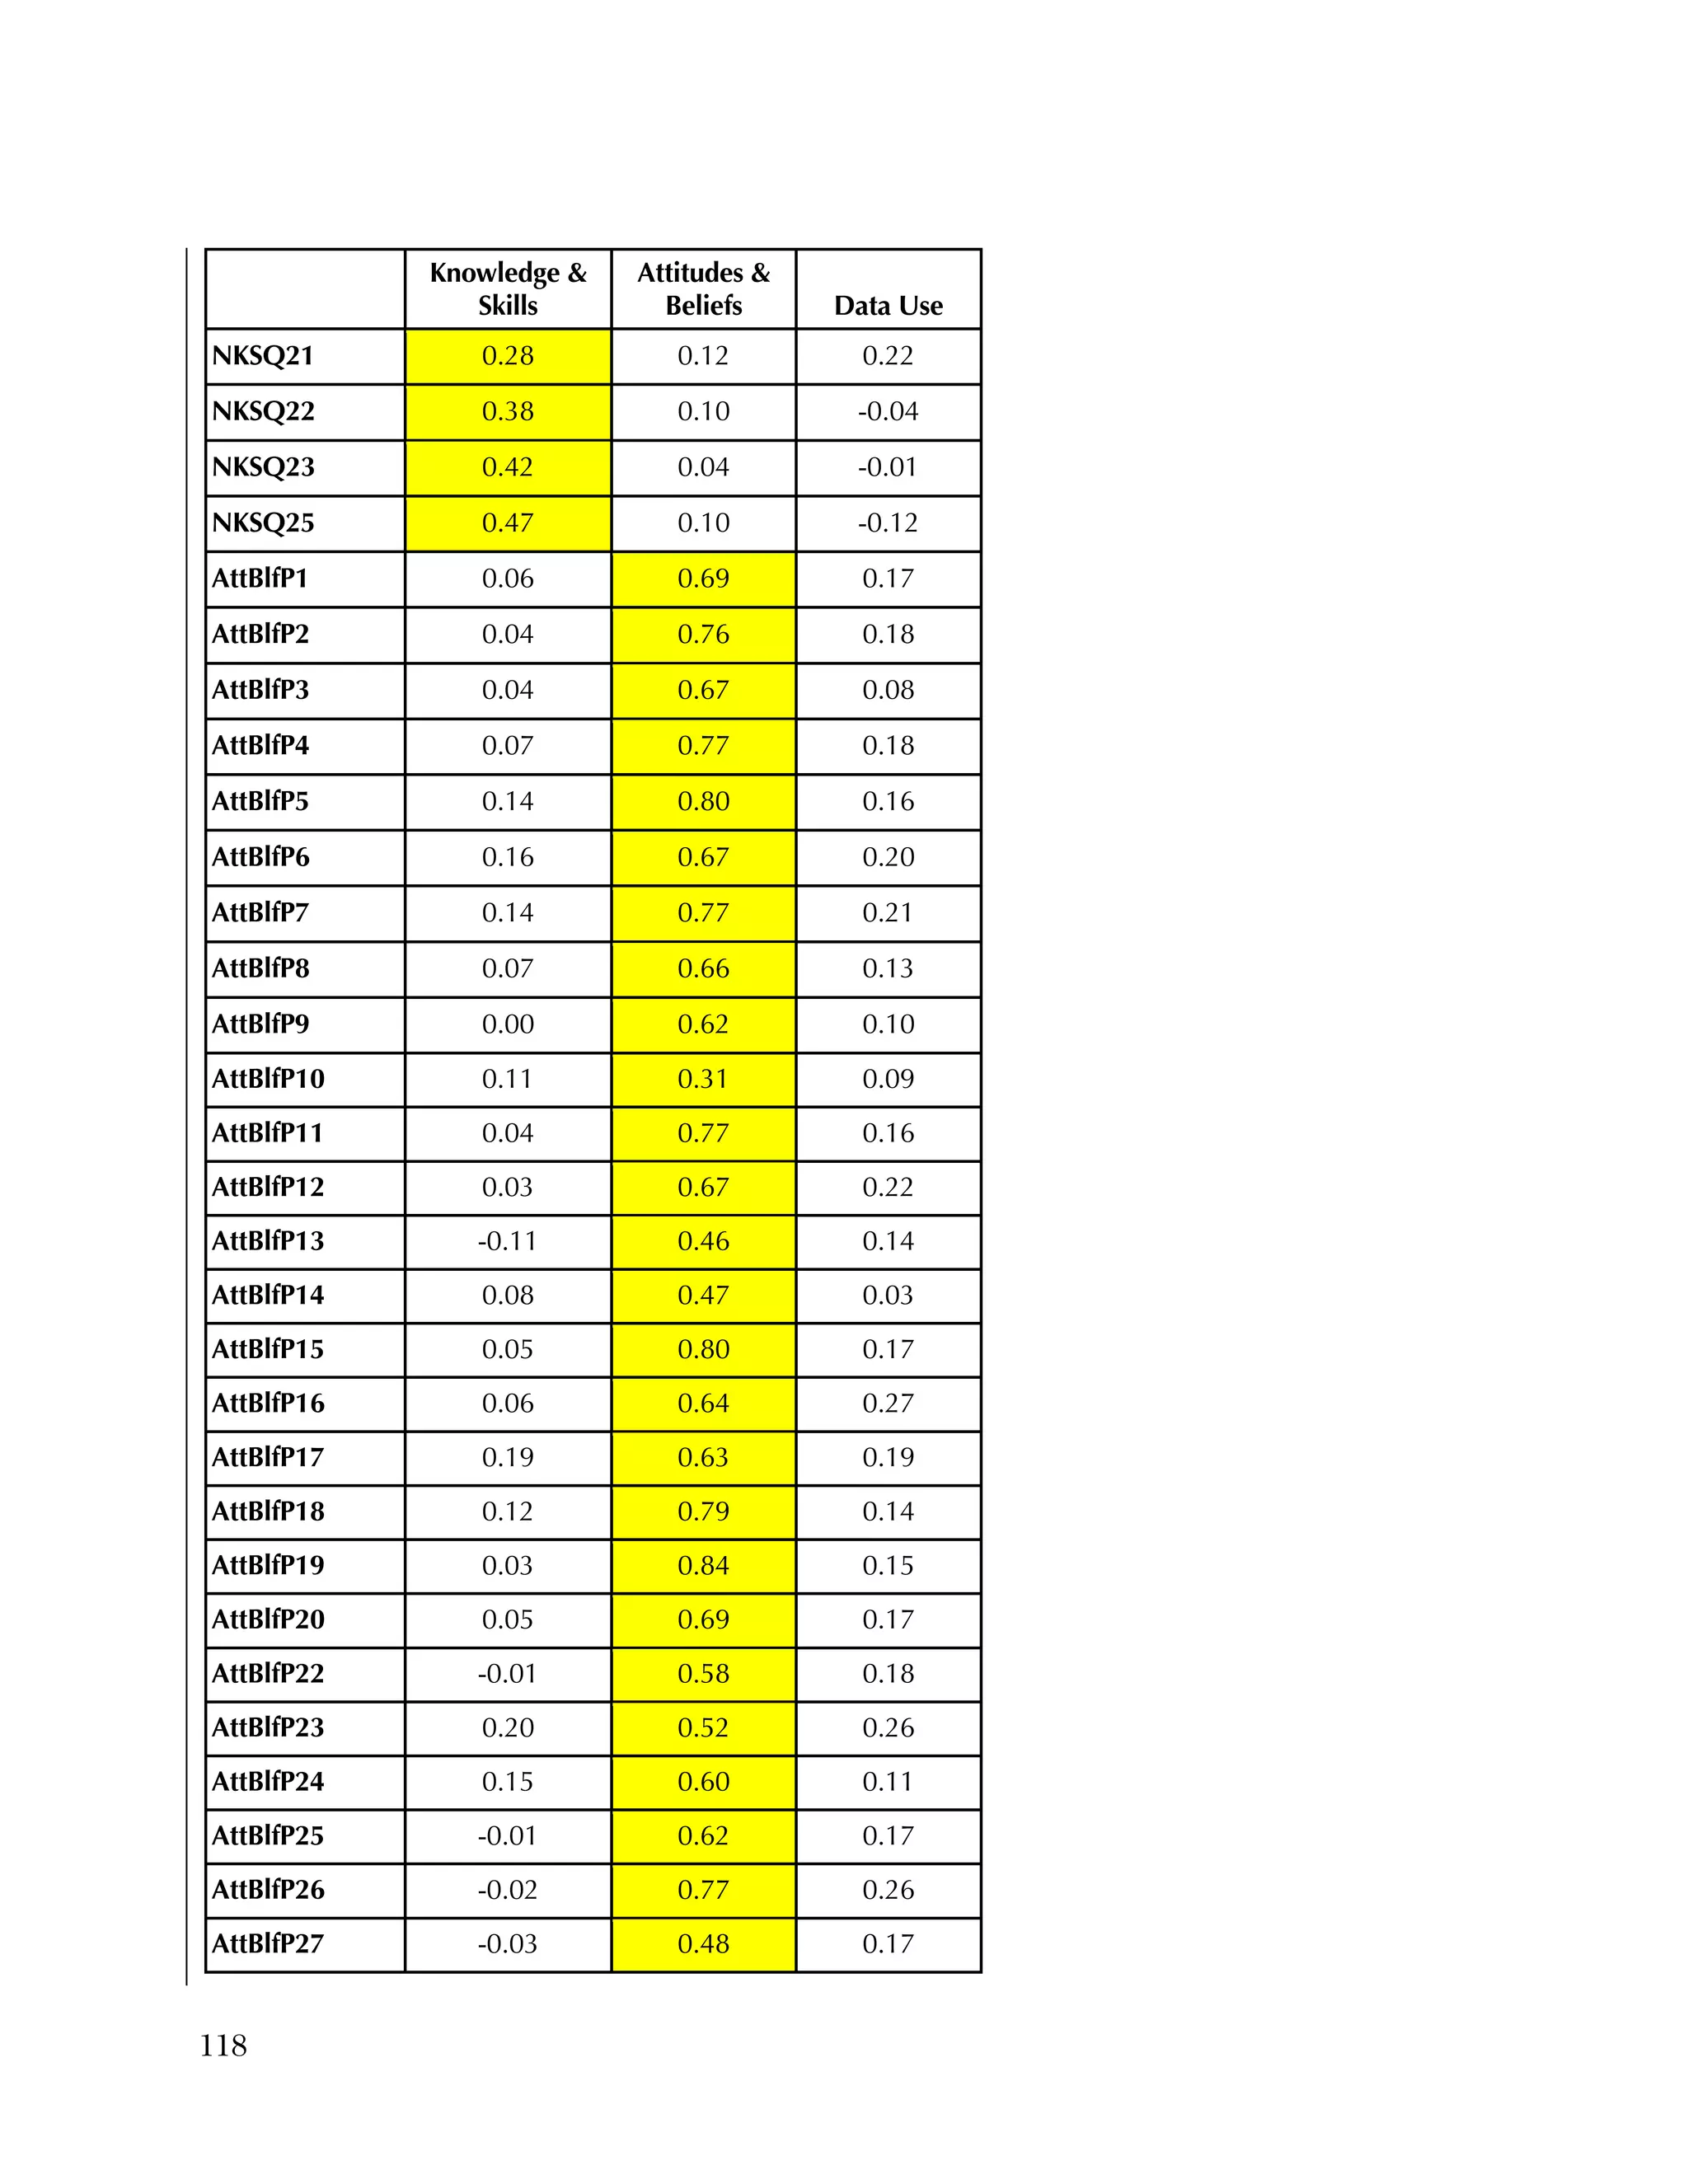
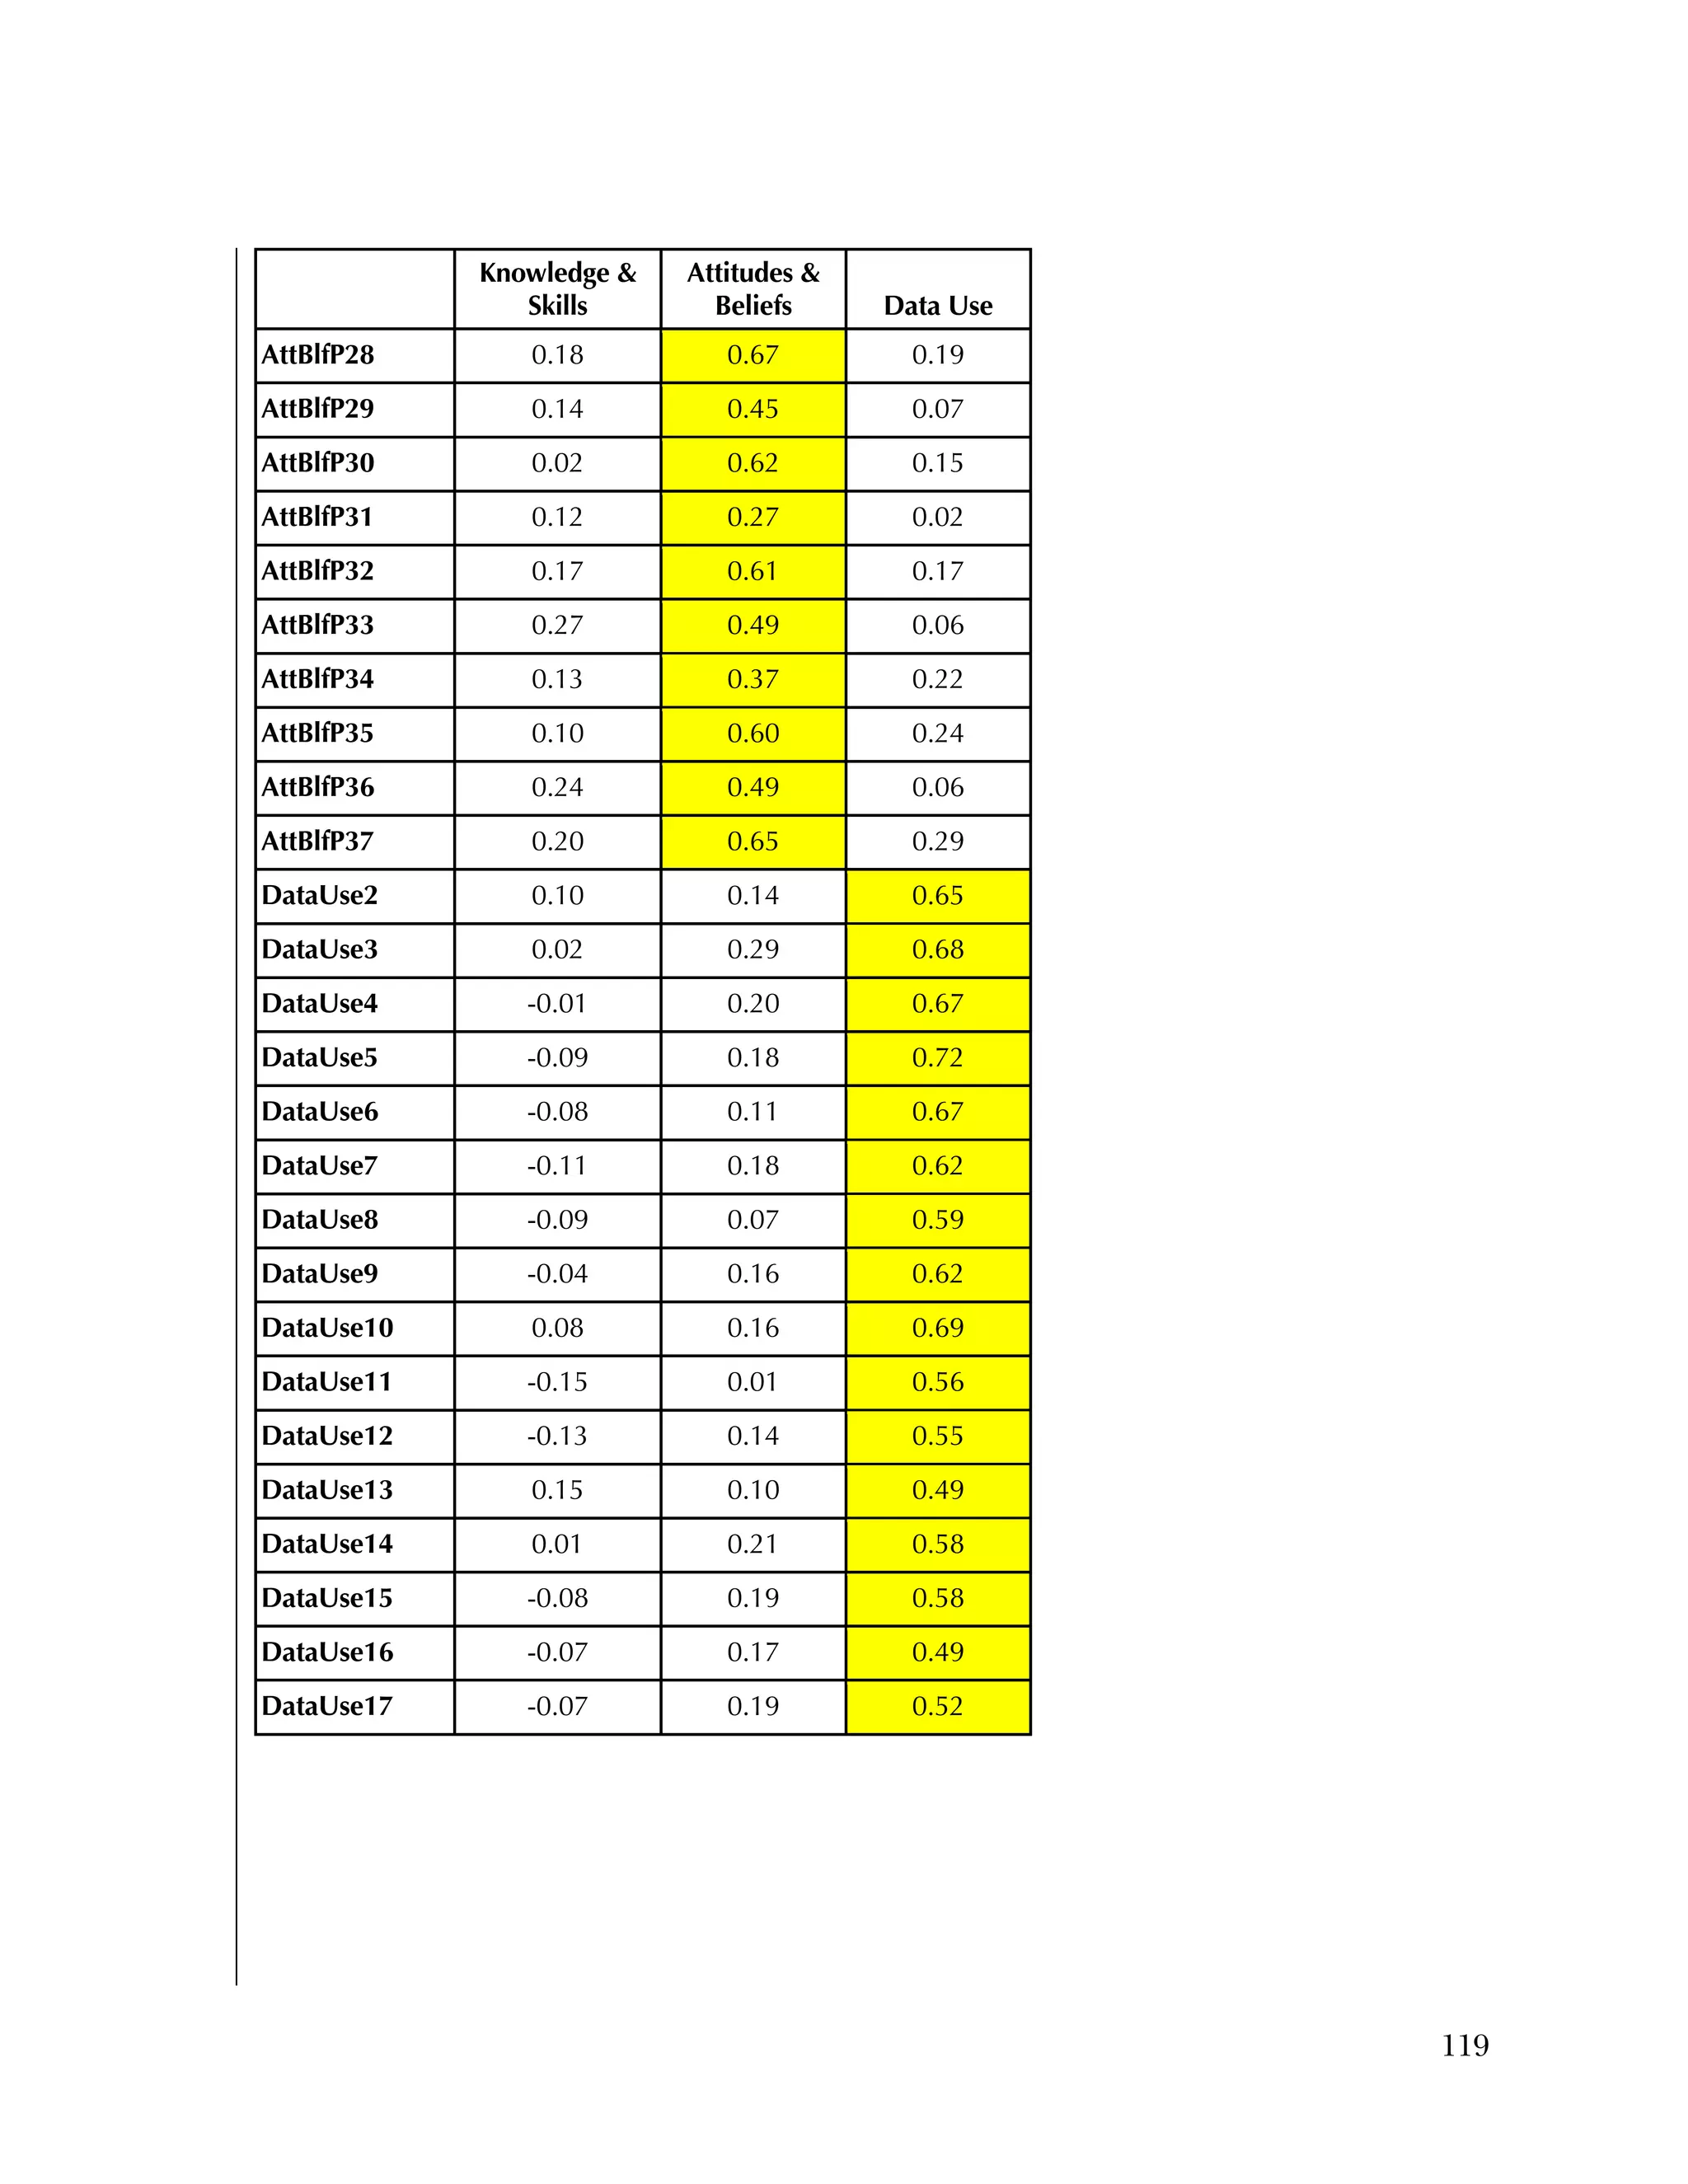
Appendix A: Study Questionnaires – Sample
Questions
A1. Attitudes and Beliefs Questionnaire
Attitudes and Beliefs Questions
Please indicate your level of agreement with the following statements by rating each one
from Strongly Agree to Strongly Disagree [5-point Likert Scale: 1–strongly disagree, 2–
disagree, 3–neither agree nor disagree, 4–agree, 5–strongly agree]:
1. All teachers in a school share responsibility to ensure that every student learns.
2. Research on best teaching practices gives me helpful suggestions about how to
improve my teaching.
3. It is important that teachers discuss with each other the achievement differences of
students from different races, cultures, and economic classes.
4. I find it helpful to discuss with colleagues relevant research that can inform my
practice.
5. It is important to validate my intuition about students’ learning needs by examining
data.
6. I share responsibility for the learning of other teachers’ students.
7. When I meet with other teachers to examine data it is beneficial to my students’
learning.
8. Students at all levels of achievement equally need instructional attention.
9. I feel comfortable telling my colleagues when I am struggling with my teaching.
10. I find it difficult to diagnose my students’ learning needs in a way that helps me
adapt the curriculum to meet their needs.
11. When making instructional decisions, it is important to examine more than one
source of information about students.](https://image.slidesharecdn.com/40e478df-c39b-4dd7-8520-f99976663650-151230202544/75/Using-Data-91-2048.jpg)

![Used to identify
Classification level
89
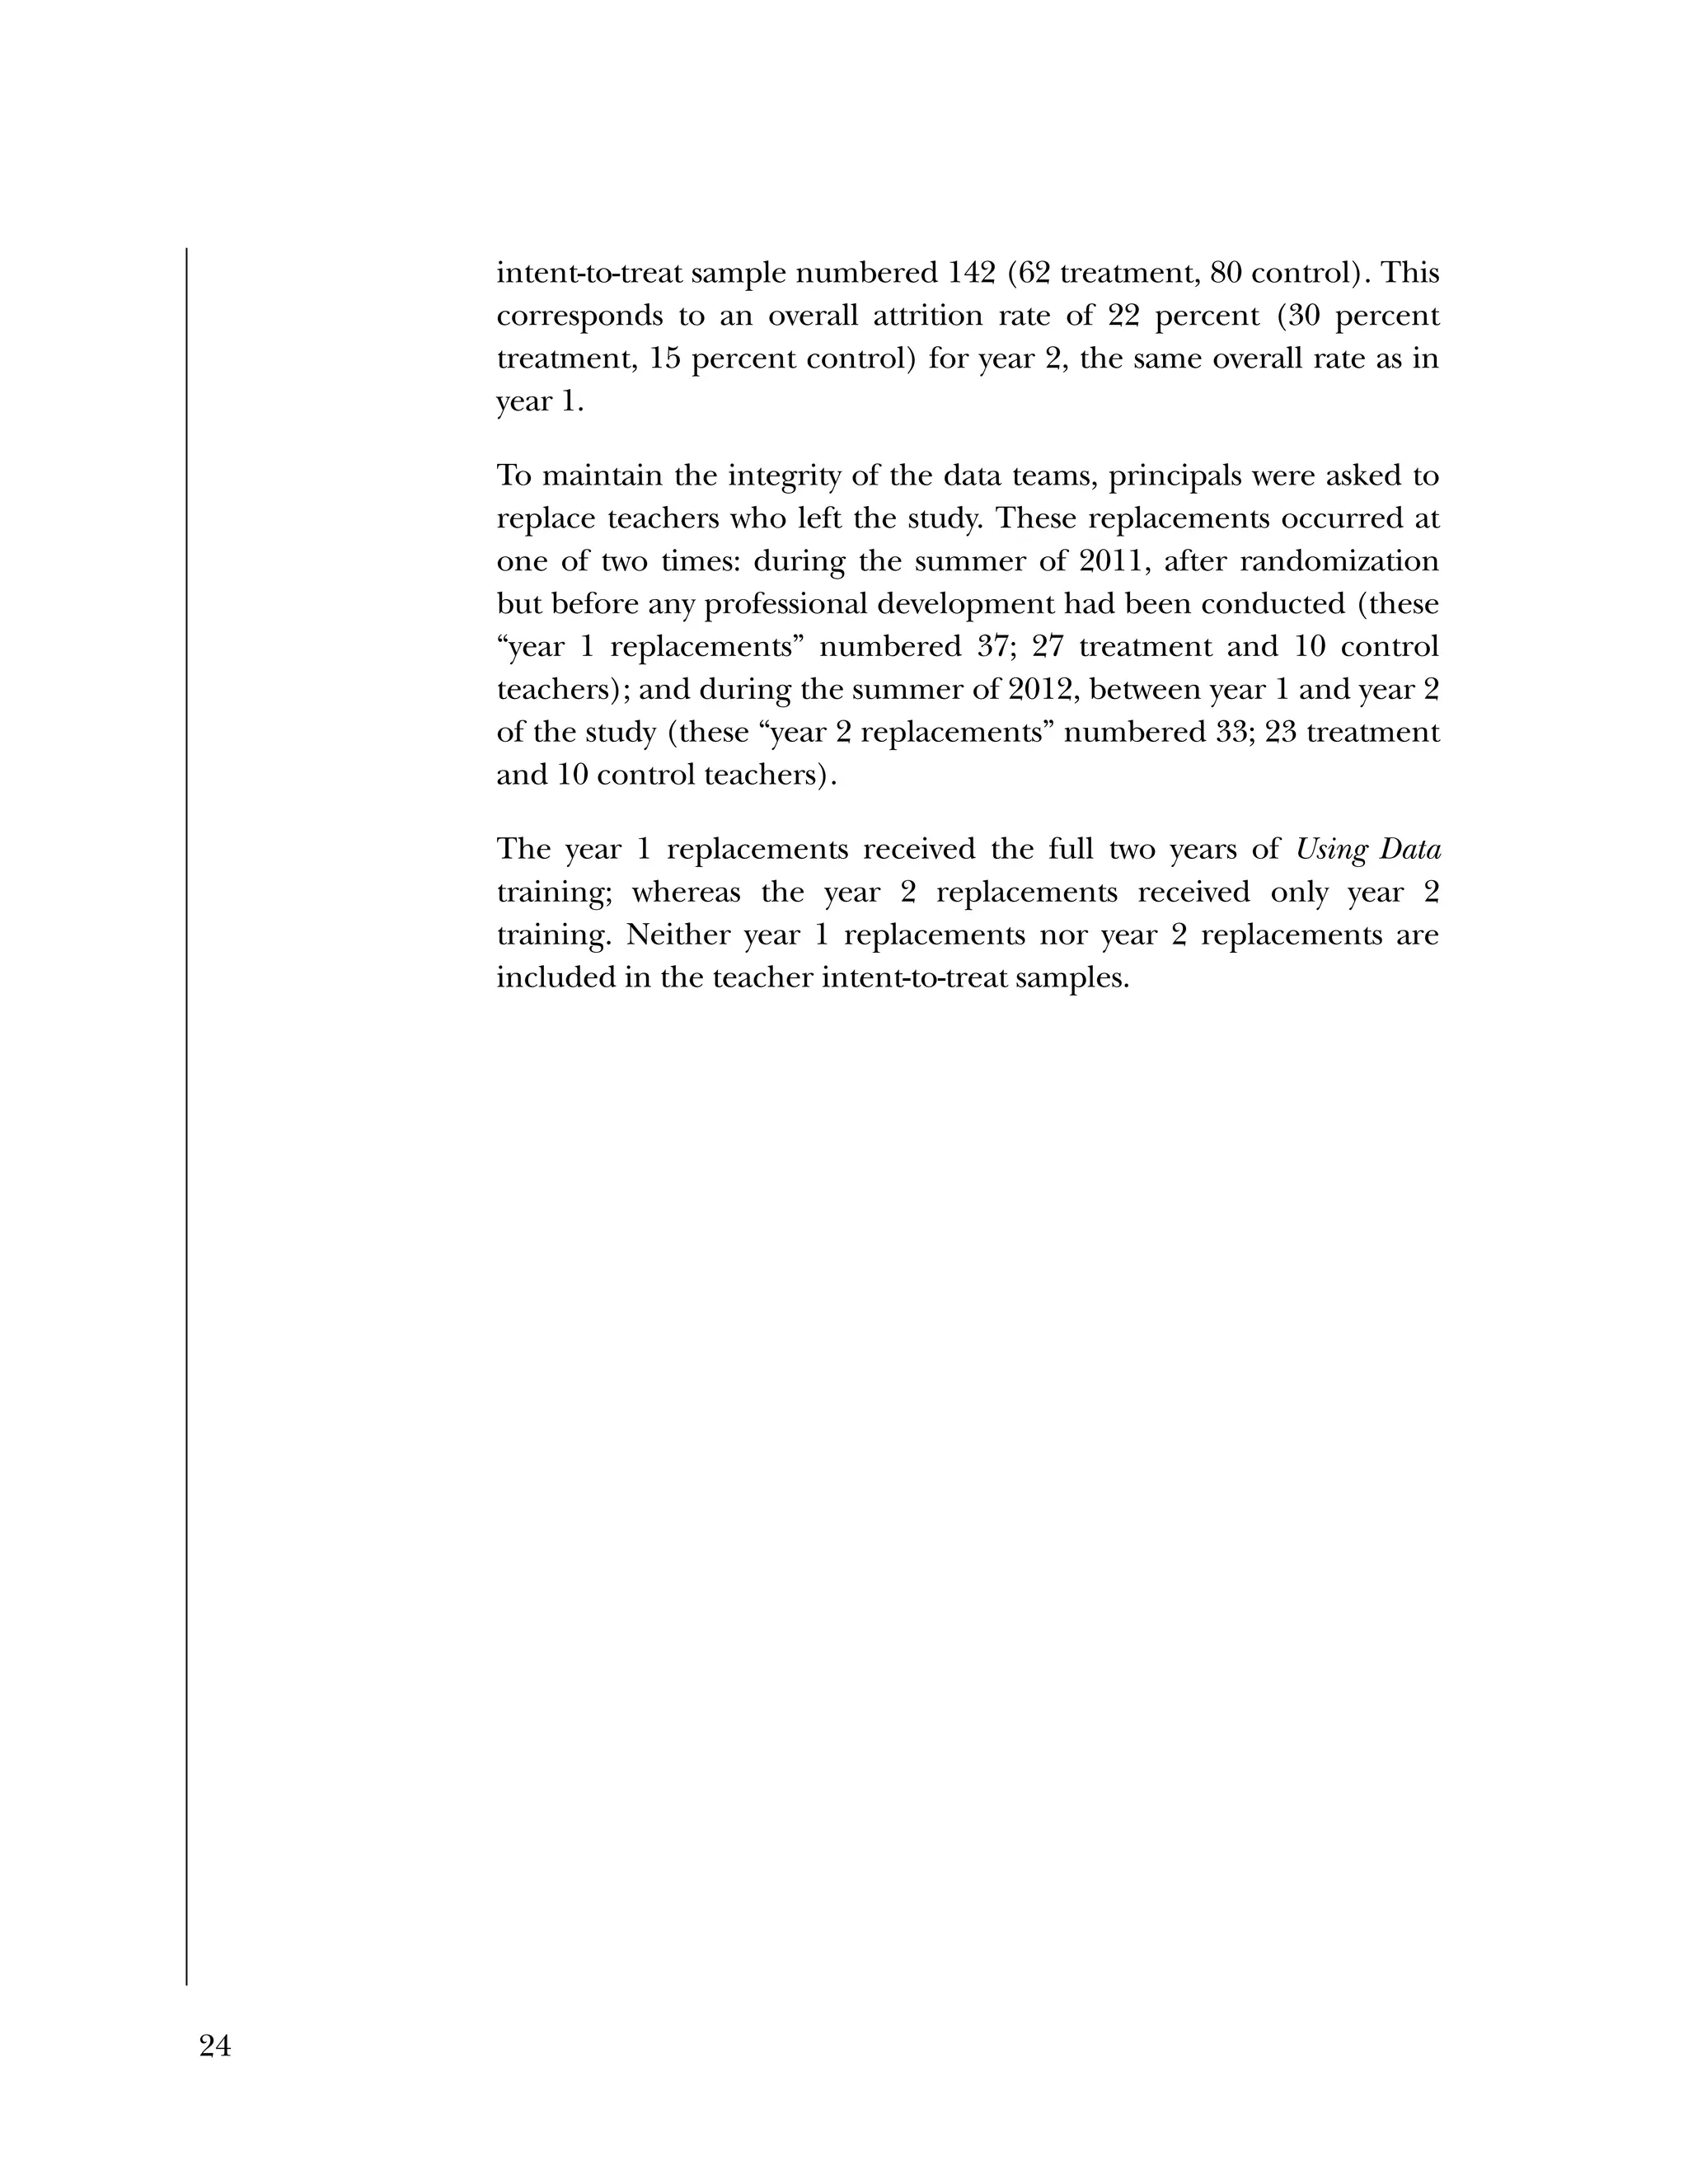
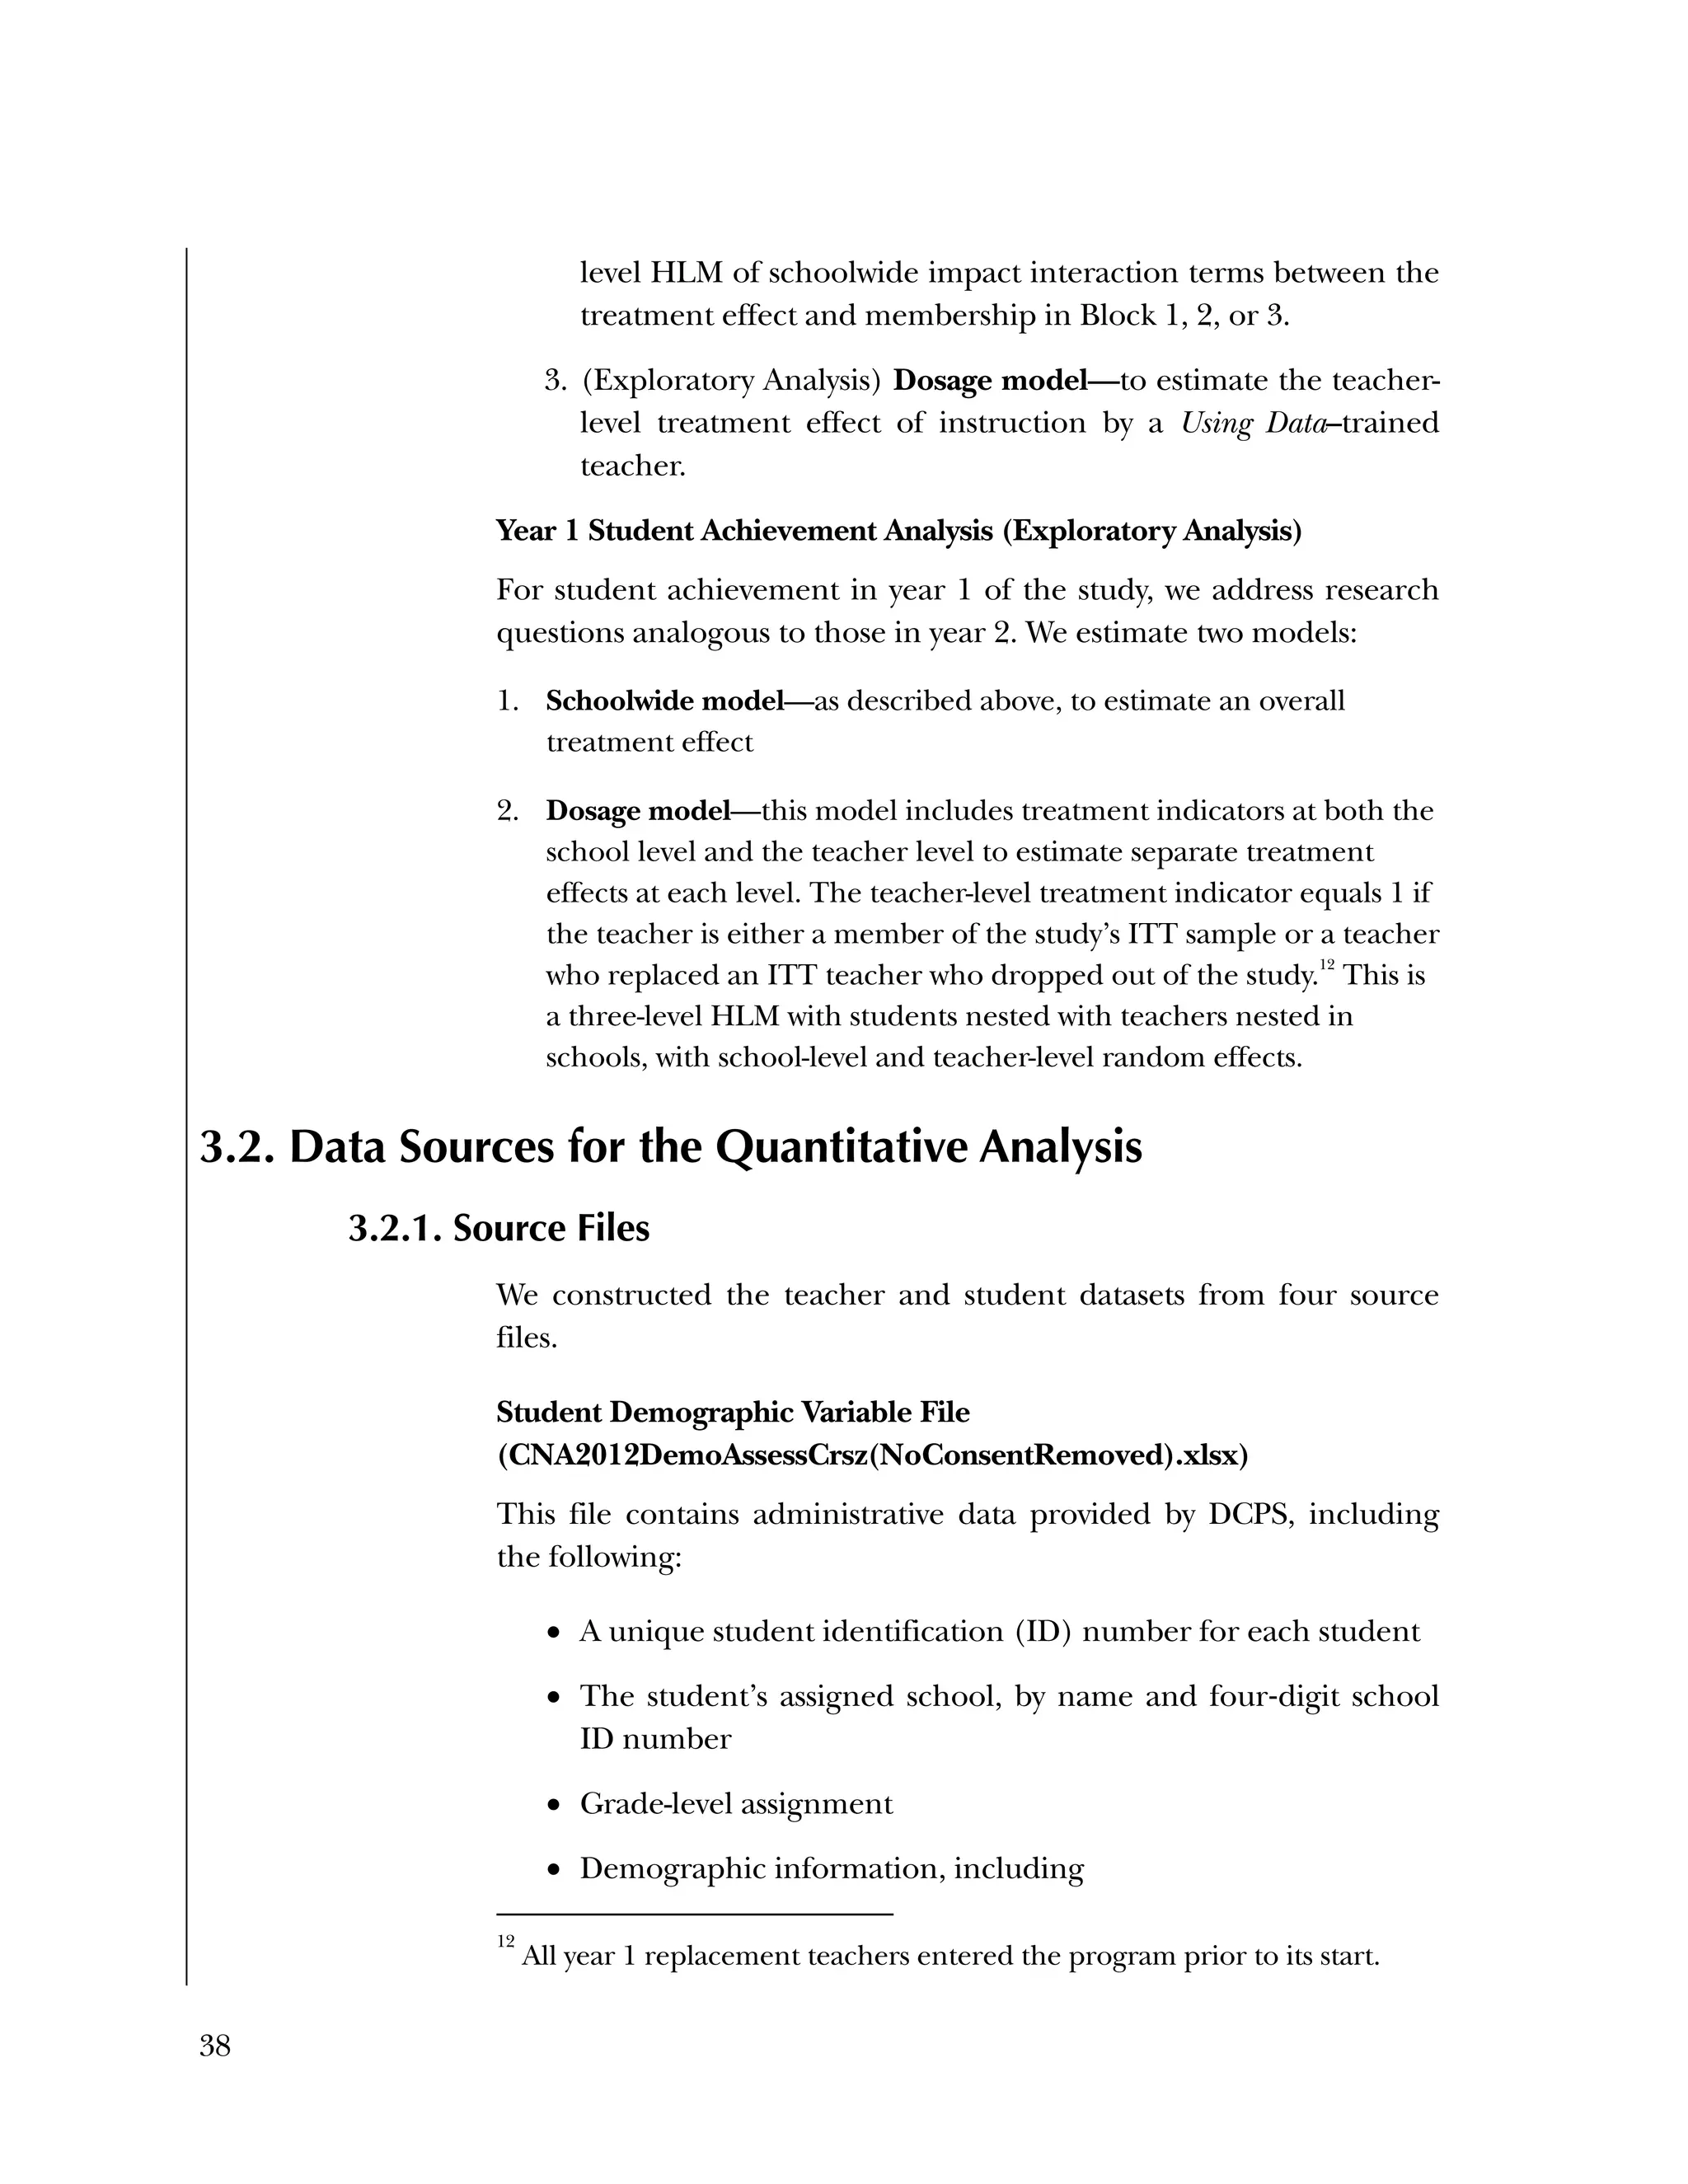
32. I would prefer not to share my students’ data with other teachers.
33. When it comes to interpreting graphs and tables, I feel anxious.
34. Teachers at this school focus their instruction on the students who are close to
meeting curriculum standards.
35. I make time to help colleagues who are struggling with their teaching.
36. It is impossible to eliminate the achievement gaps between different ethnic/racial
groups.
37. Monitoring student learning on a weekly basis takes more time than it’s worth.
Data Use Questions
In school year 2012-2013, how often did you use data for each of the following
purposes? (Mark one box per row.) In 2012/13, I used data... [Possible answers: Never,
A few times, Once or twice a month, Once a week or more]
a. to inform curriculum changes
b. to identify individual skill gaps for individual students
c. to determine whether your class or individual students were ready to move on to the
next instructional unit
d. to evaluate promising classroom practices
e. to decide to give your students test-taking practice
f. to estimate whether your students would make adequate yearly progress (AYP)
g. to track standardized test scores by grade
h. to track individual student test scores
i. to track other measures of student progress
j. to inform student placement in courses or special programs
k. to inform parents about student progress
In school year 2012-2013, how often did you work with data in the following contexts to
make instructional decisions? (Mark one box per row) [Possible answers: Never, A few
times, Once or twice a month, Once a week or more]
a. on your own](https://image.slidesharecdn.com/40e478df-c39b-4dd7-8520-f99976663650-151230202544/75/Using-Data-93-2048.jpg)
![90
b. working with colleagues in your grade level
c. working with colleagues from other grade levels
d. as part of a district-level activity with staff from other schools
e. in another setting
A2. Sample Questions from Knowledge & Skills
Questionnaire
Directions: Please read each question and select the best answer among the four
multiple choices.
Please use Table 2 to answer questions 16-19.
16. On what item do students in the class perform the best? [Potential answers: 1, 2, 3,
or 4]
17. On what item do students in the district outperform students in the class? [Potential
answers: 1, 2, 3, or 4]
18. On what item do most students give the same incorrect answer? [Potential answers:
1, 2, 3, or 4]
19. How does the school-level performance on item 2 compare to the state-level
performance? [Potential answers: the same; school performance is better than state
performance; school performance is worse than state performance; there is not
enough information on the table to answer]](https://image.slidesharecdn.com/40e478df-c39b-4dd7-8520-f99976663650-151230202544/75/Using-Data-94-2048.jpg)
![94
In the pilot test, five of the six subscales had internal consistency
reliabilities ranging from .70 to .91, well above the What Works
Clearinghouse minimal standard of .50.
27
One subscale, Instructional
Improvement, had a reliability of .31, below the standard of .50.
B2. Psychometric Analysis of Spring 2013 Administration of
the Using Data Questionnaires
Item Analysis
Frequencies
Frequencies were run on the 25 items of the Knowledge & Skills
questionnaire, after the data was scored as 1=right or 0=wrong. There
were 259 cases. Of the 259, there were three individuals missing
responses on every item.
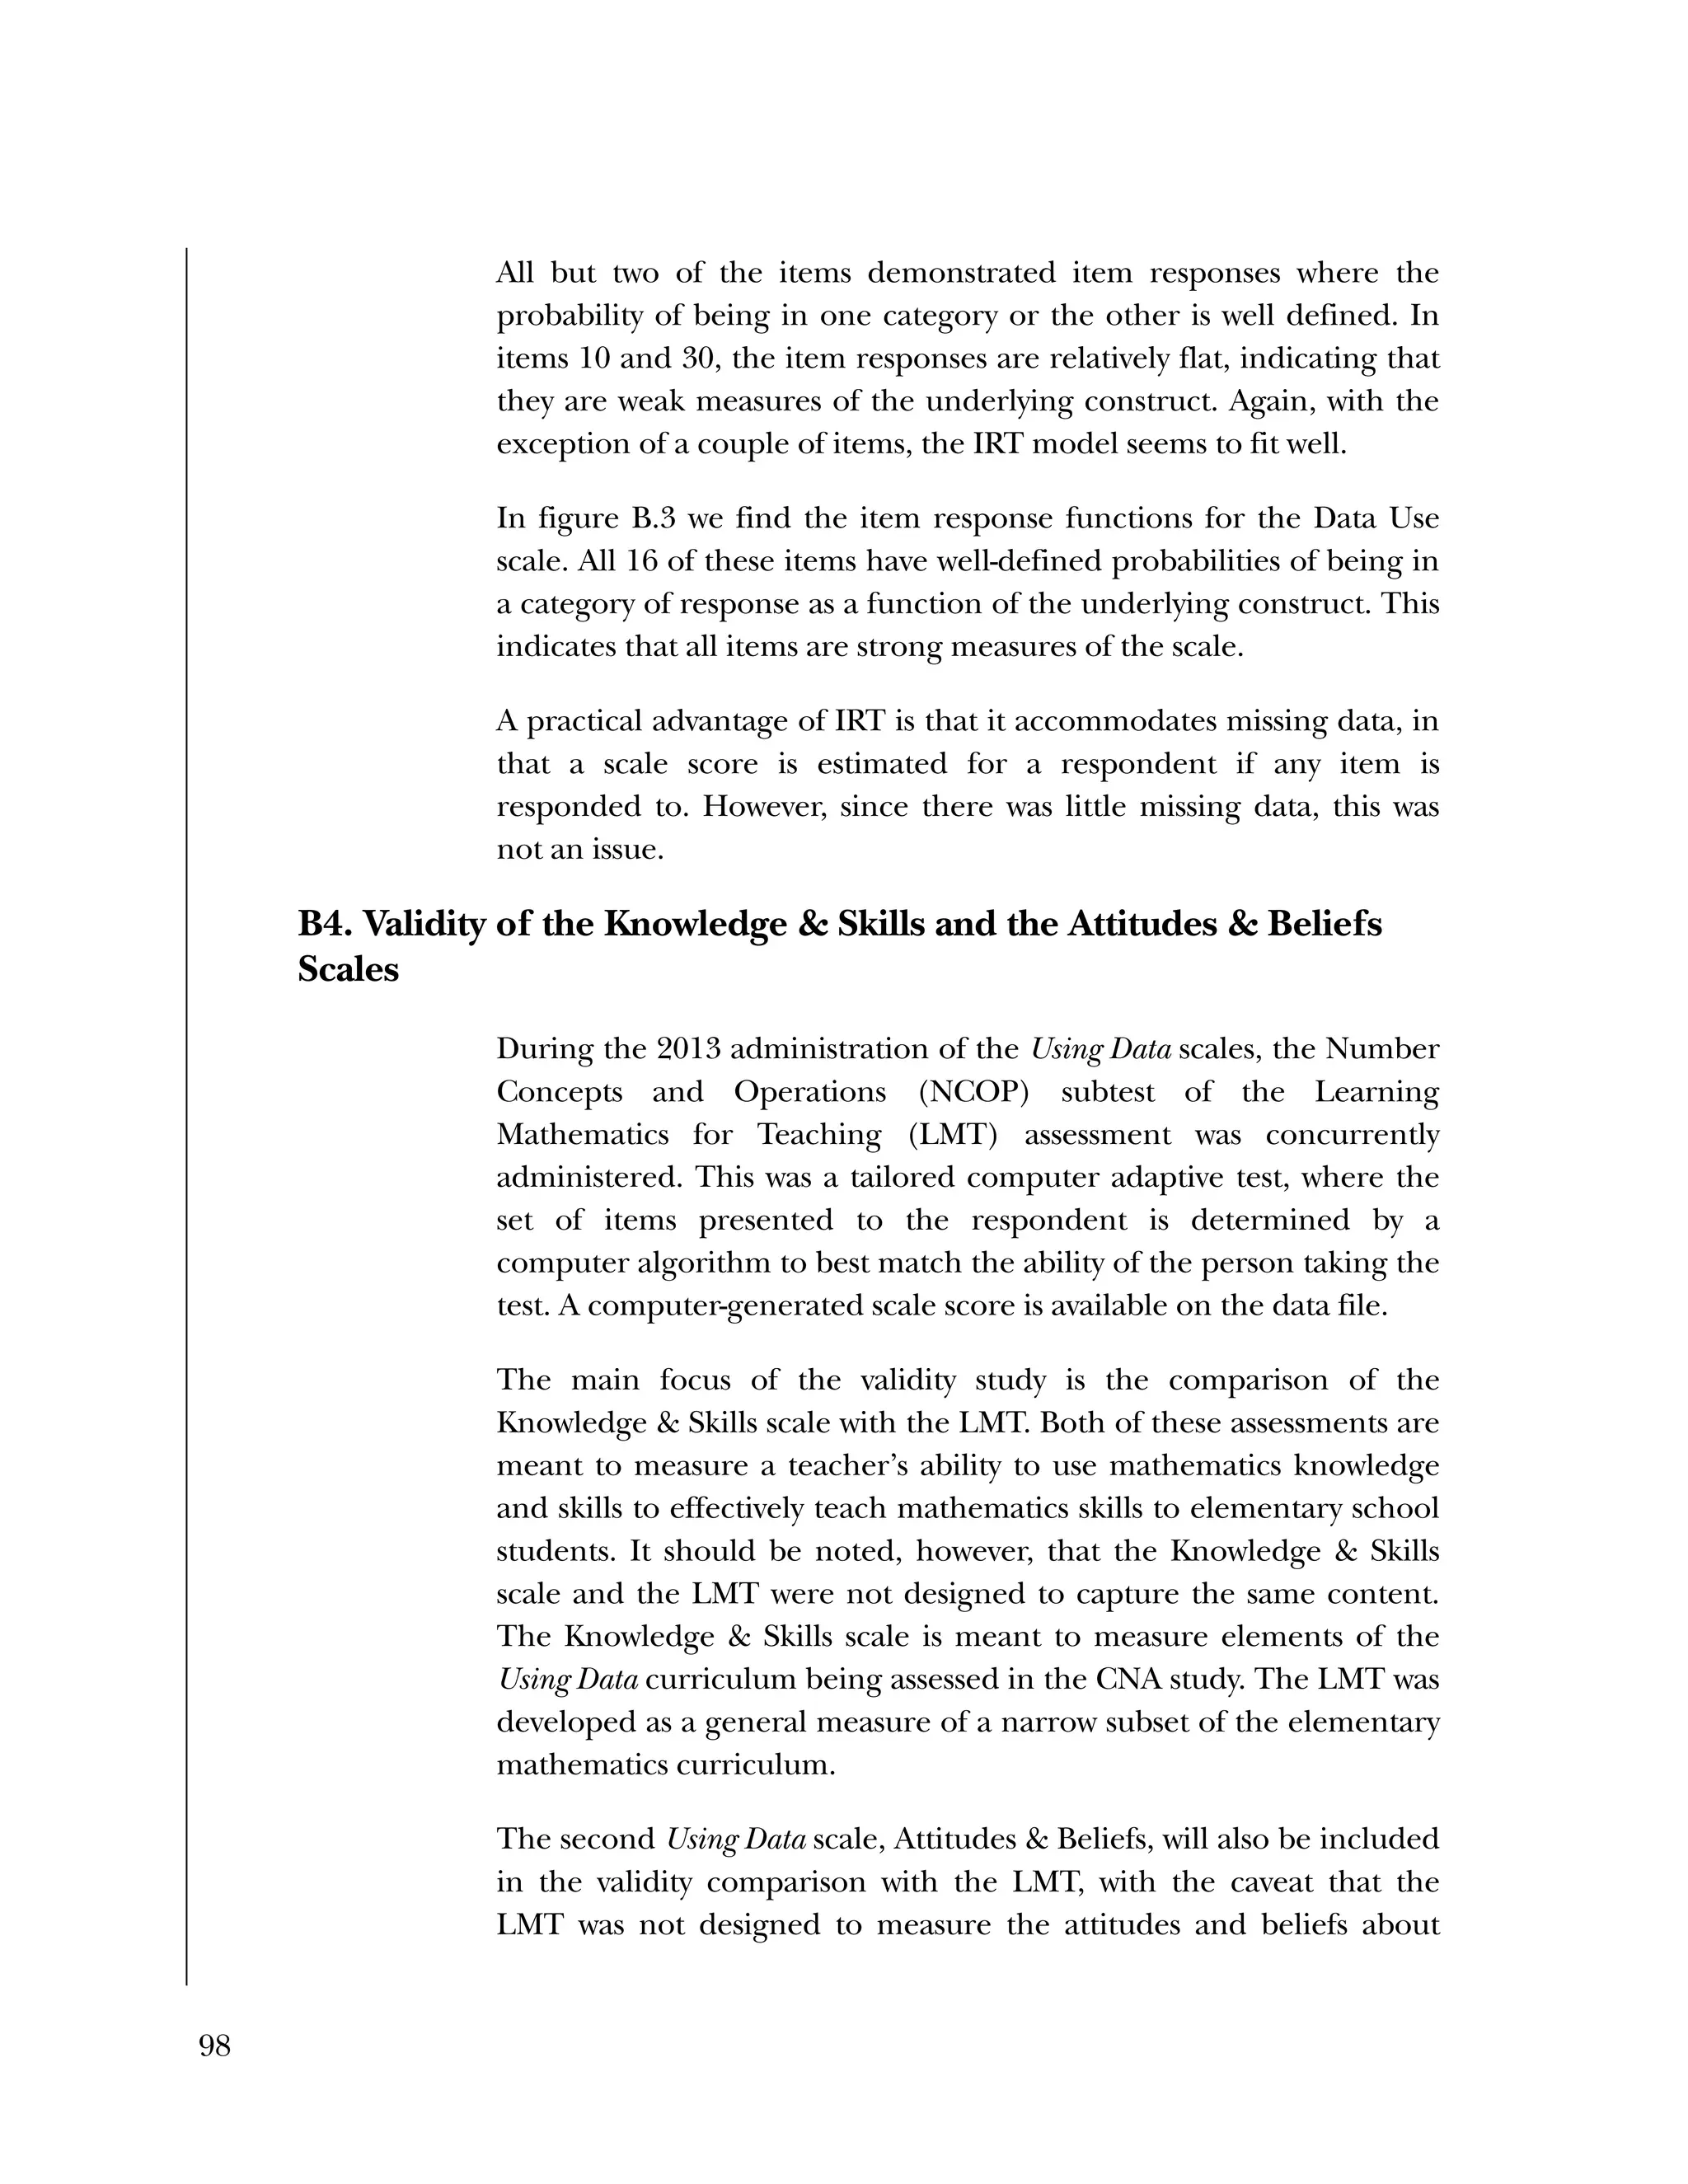
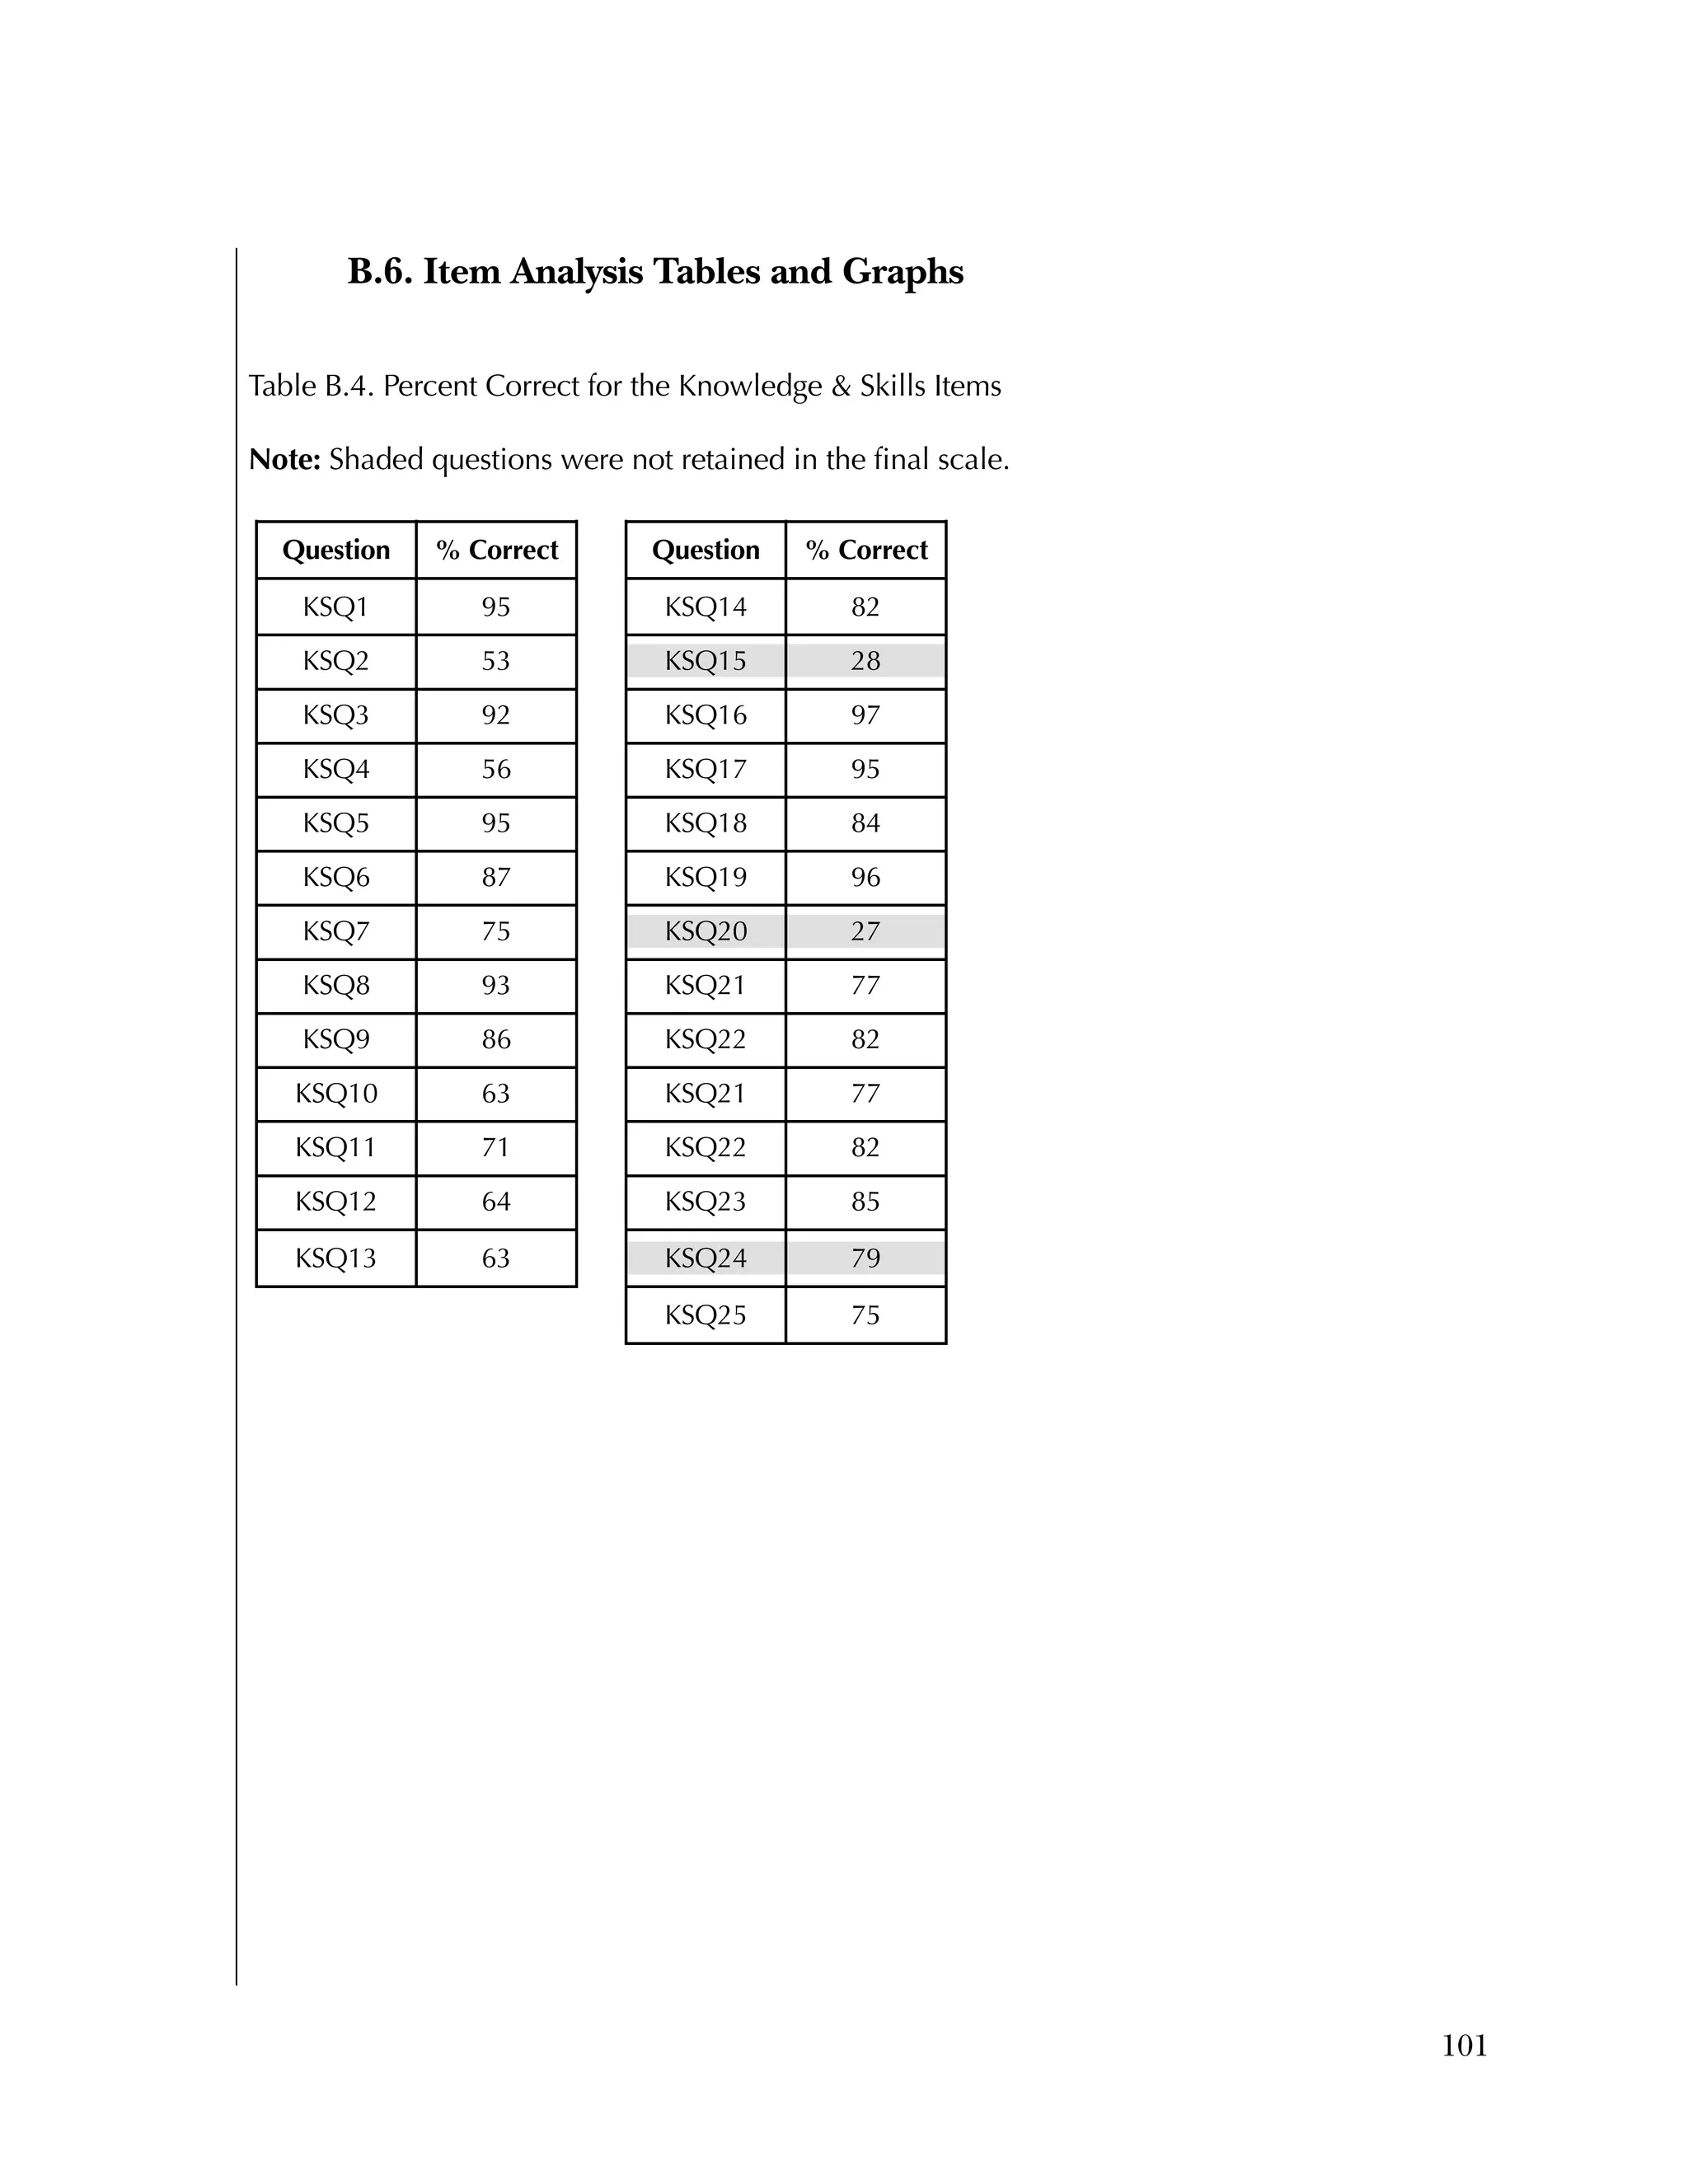
Overall, the items were rather easy, with an average percent correct
over all items of 76 percent. Ten items had percent correct of 85
percent or higher, and only two items had a percent correct of less
than 50 percent. Table B.4 gives the percent correct for each item.
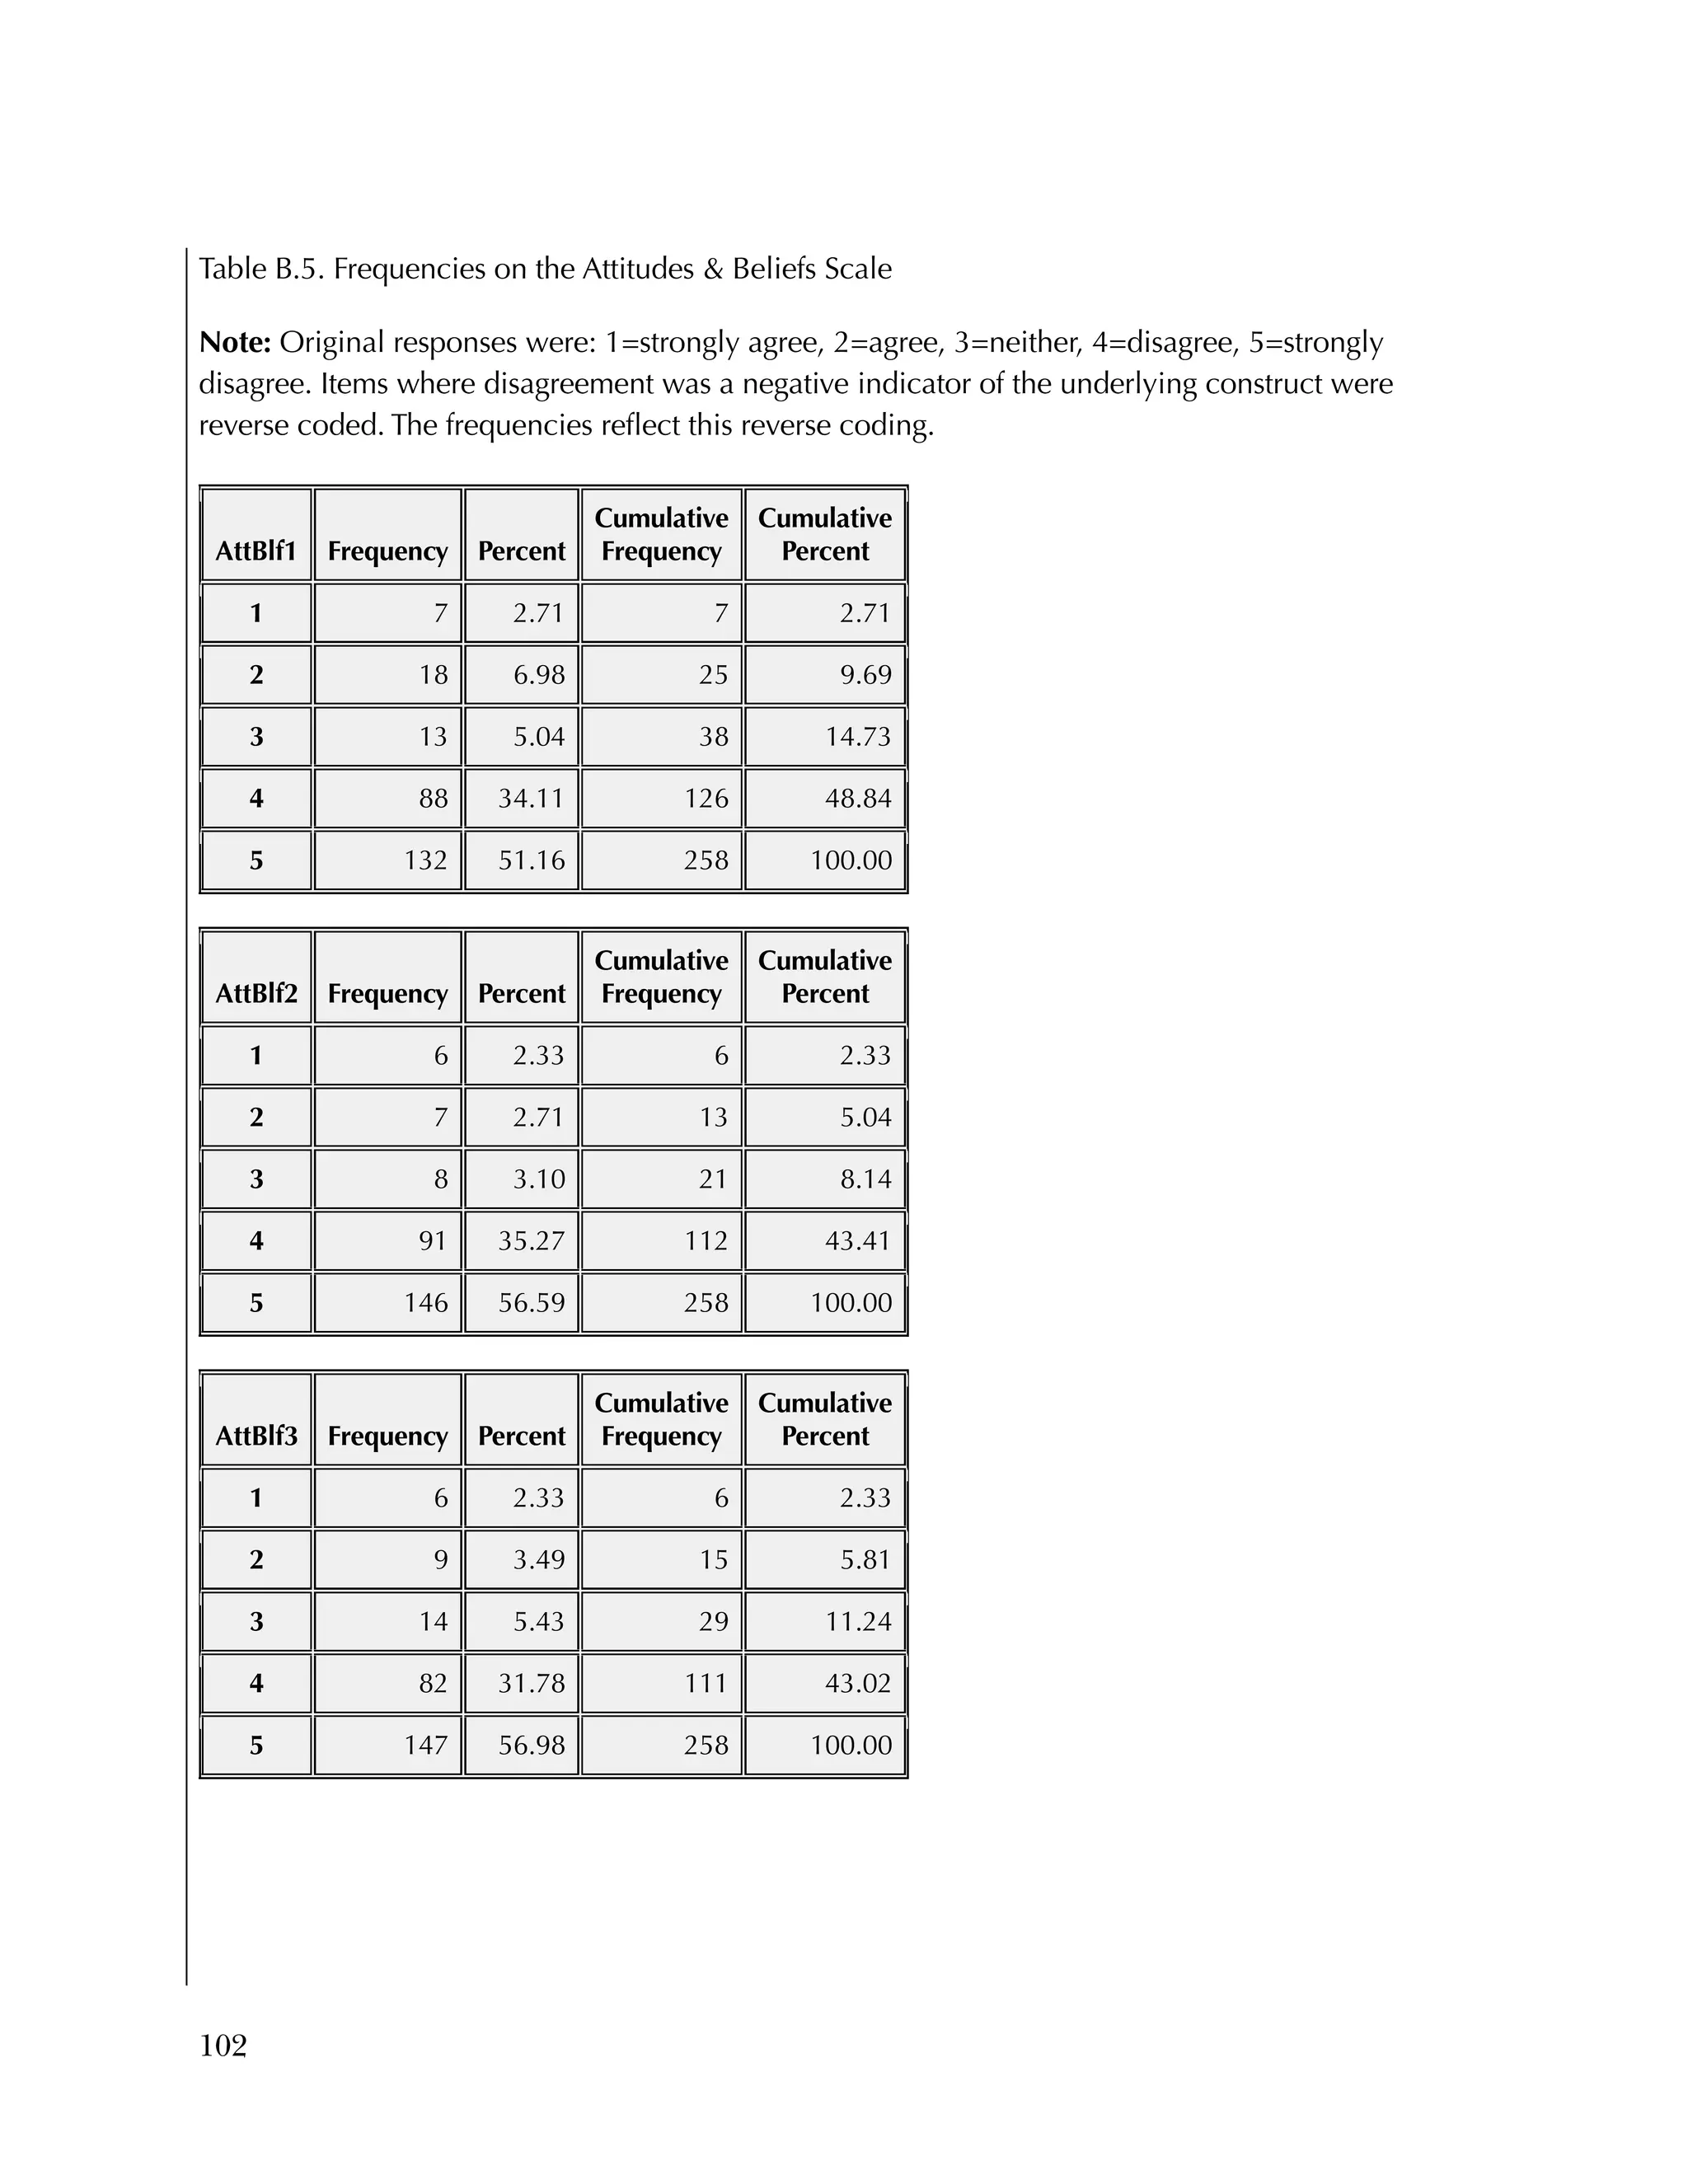
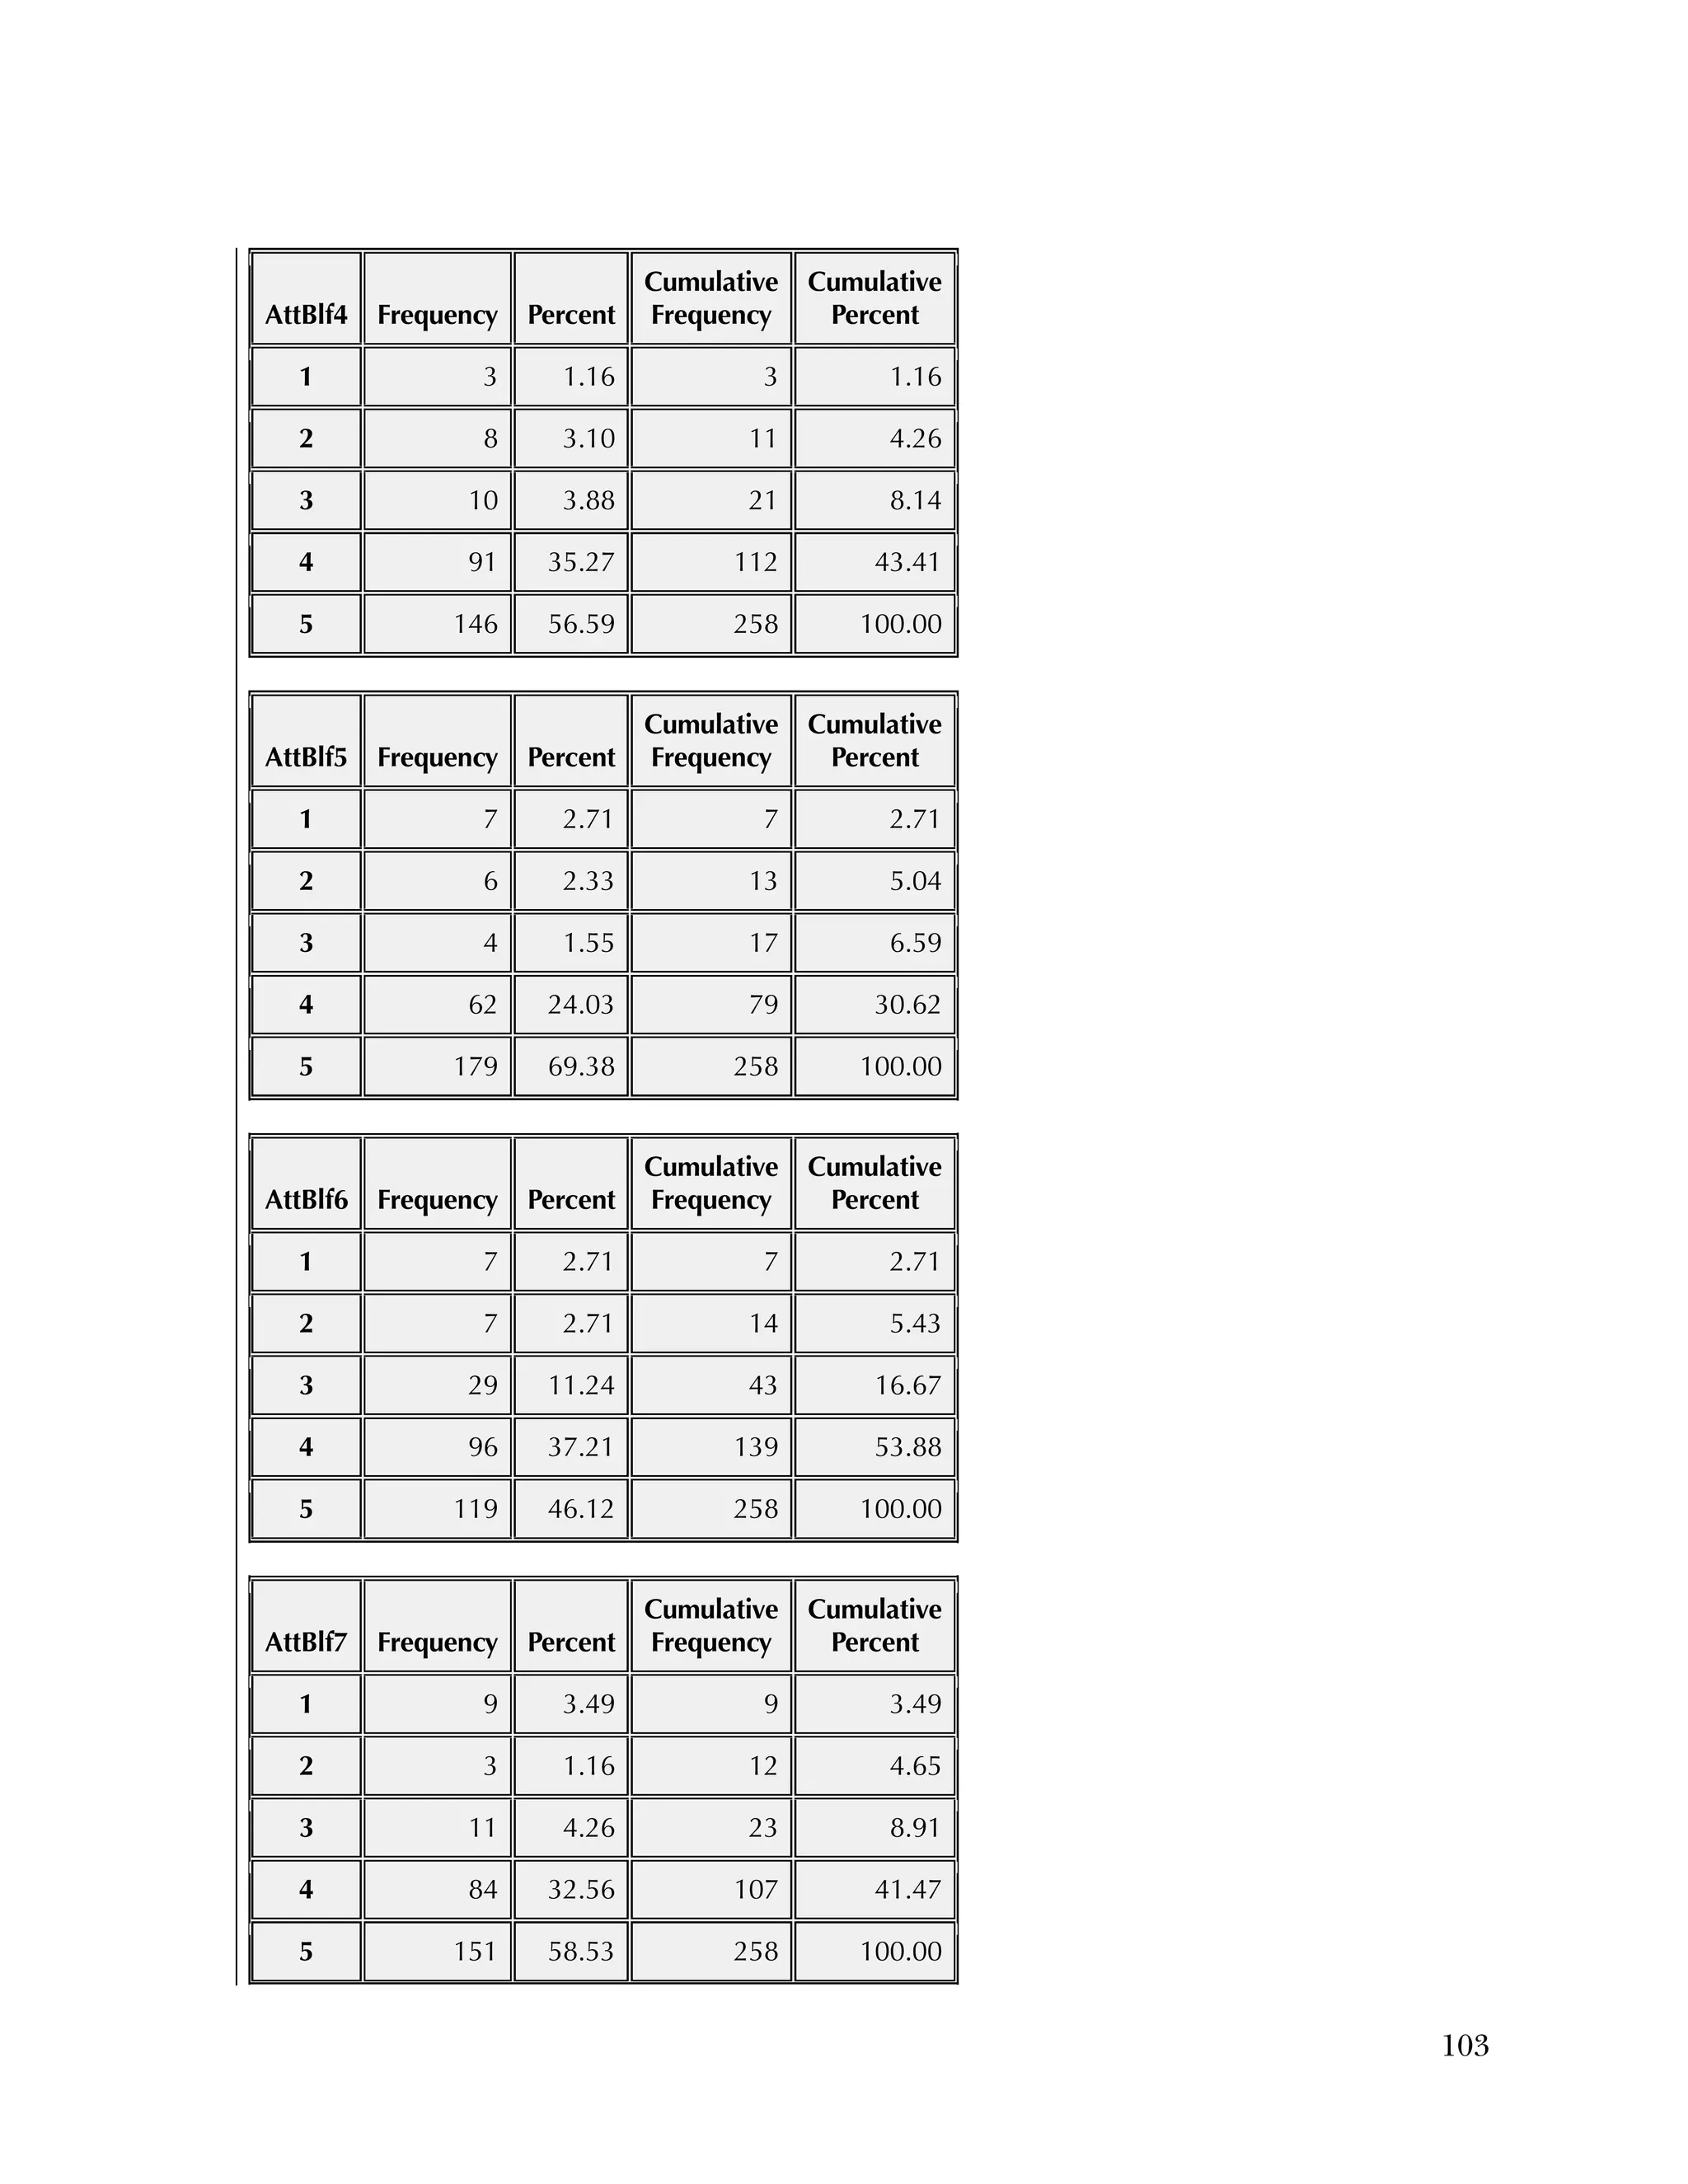
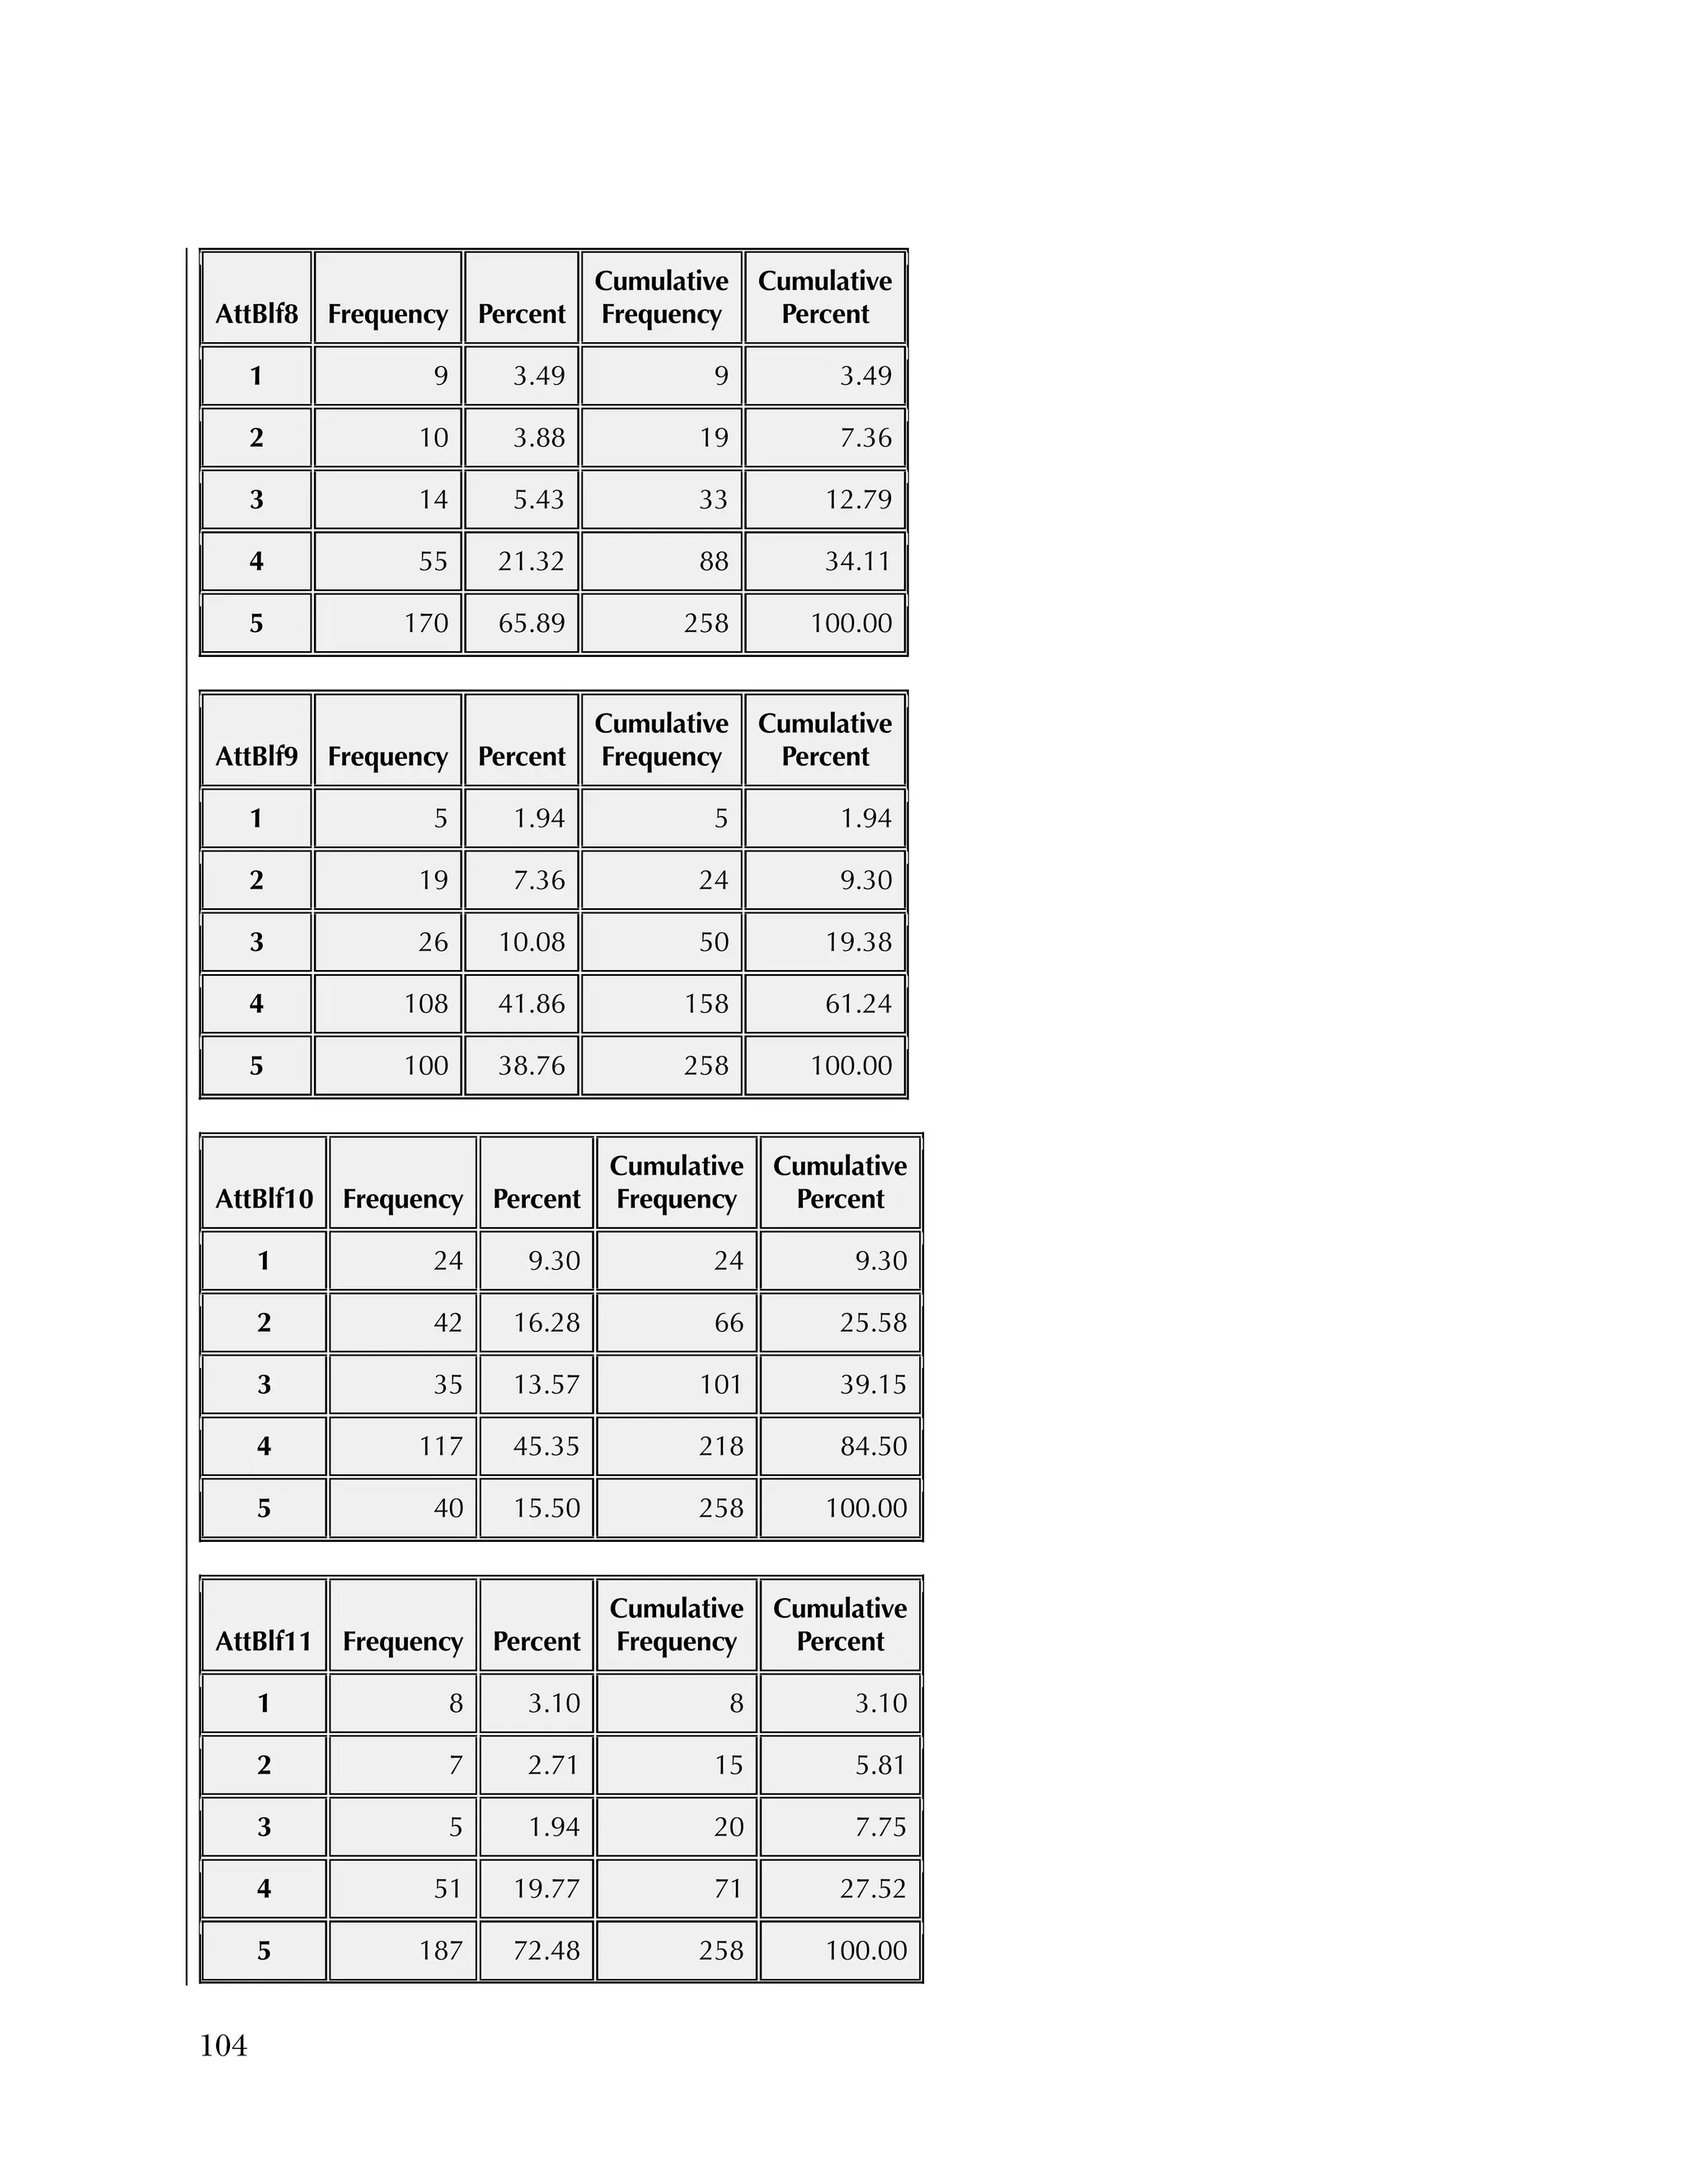
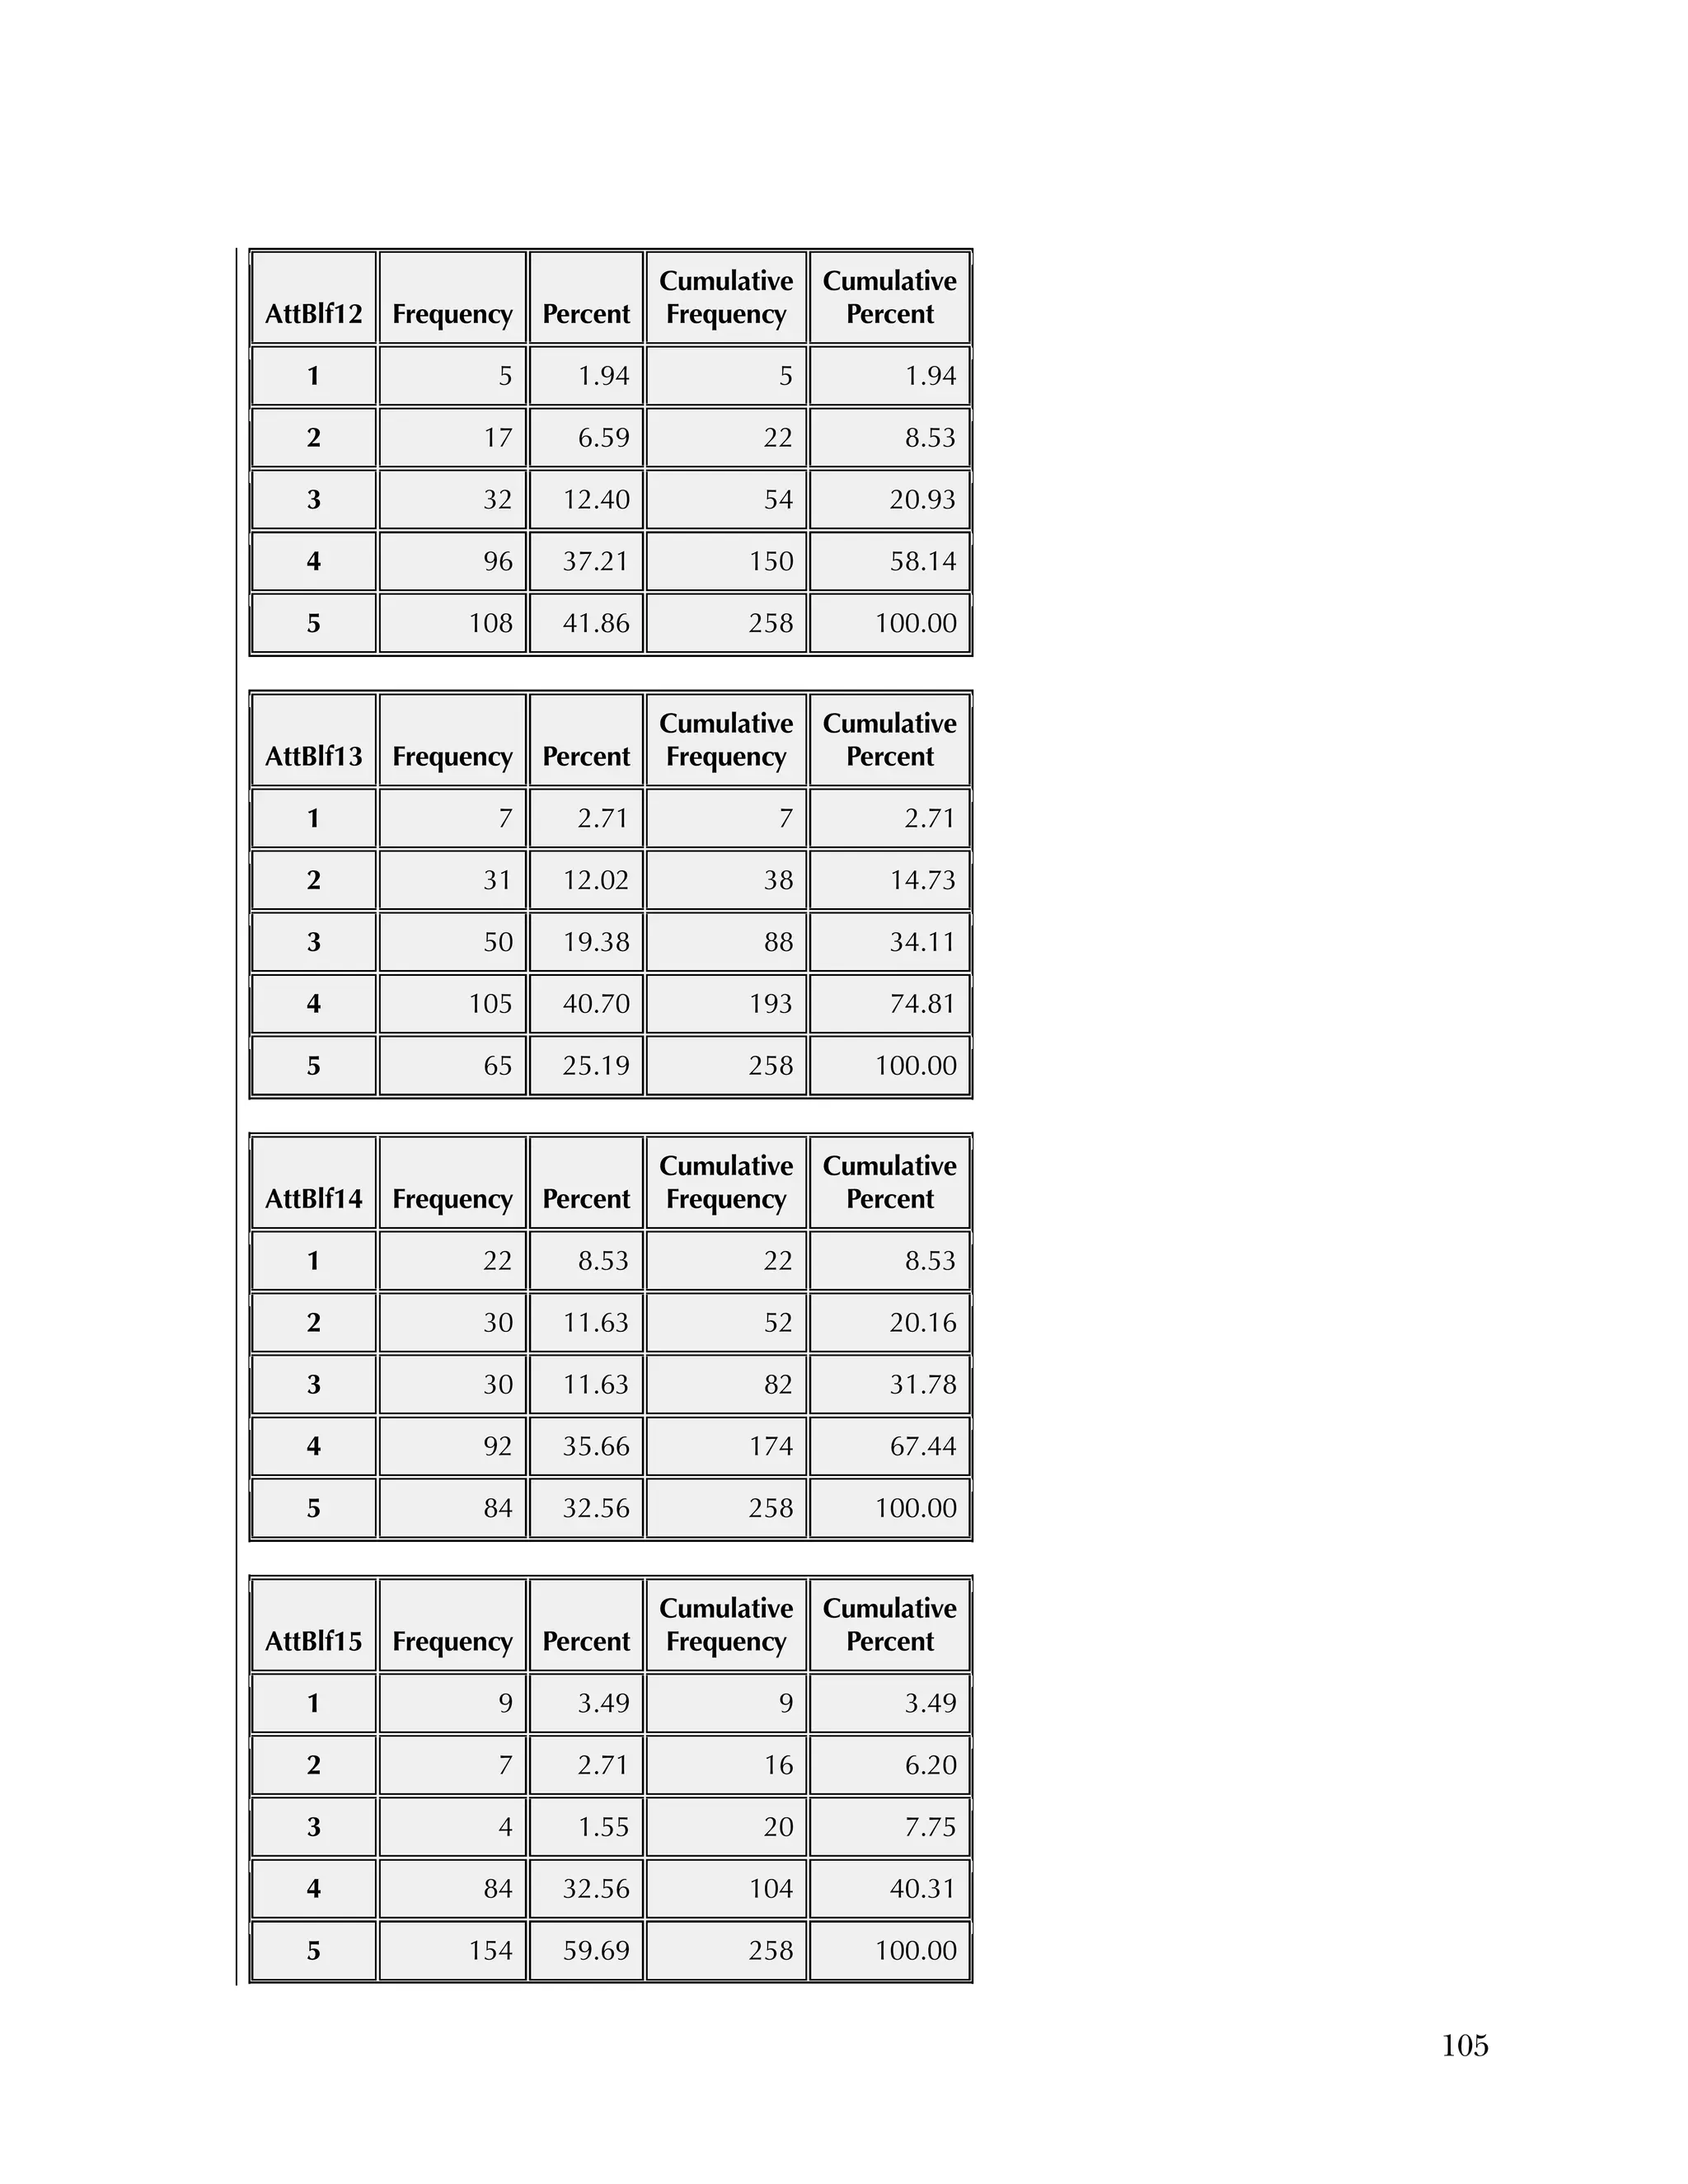
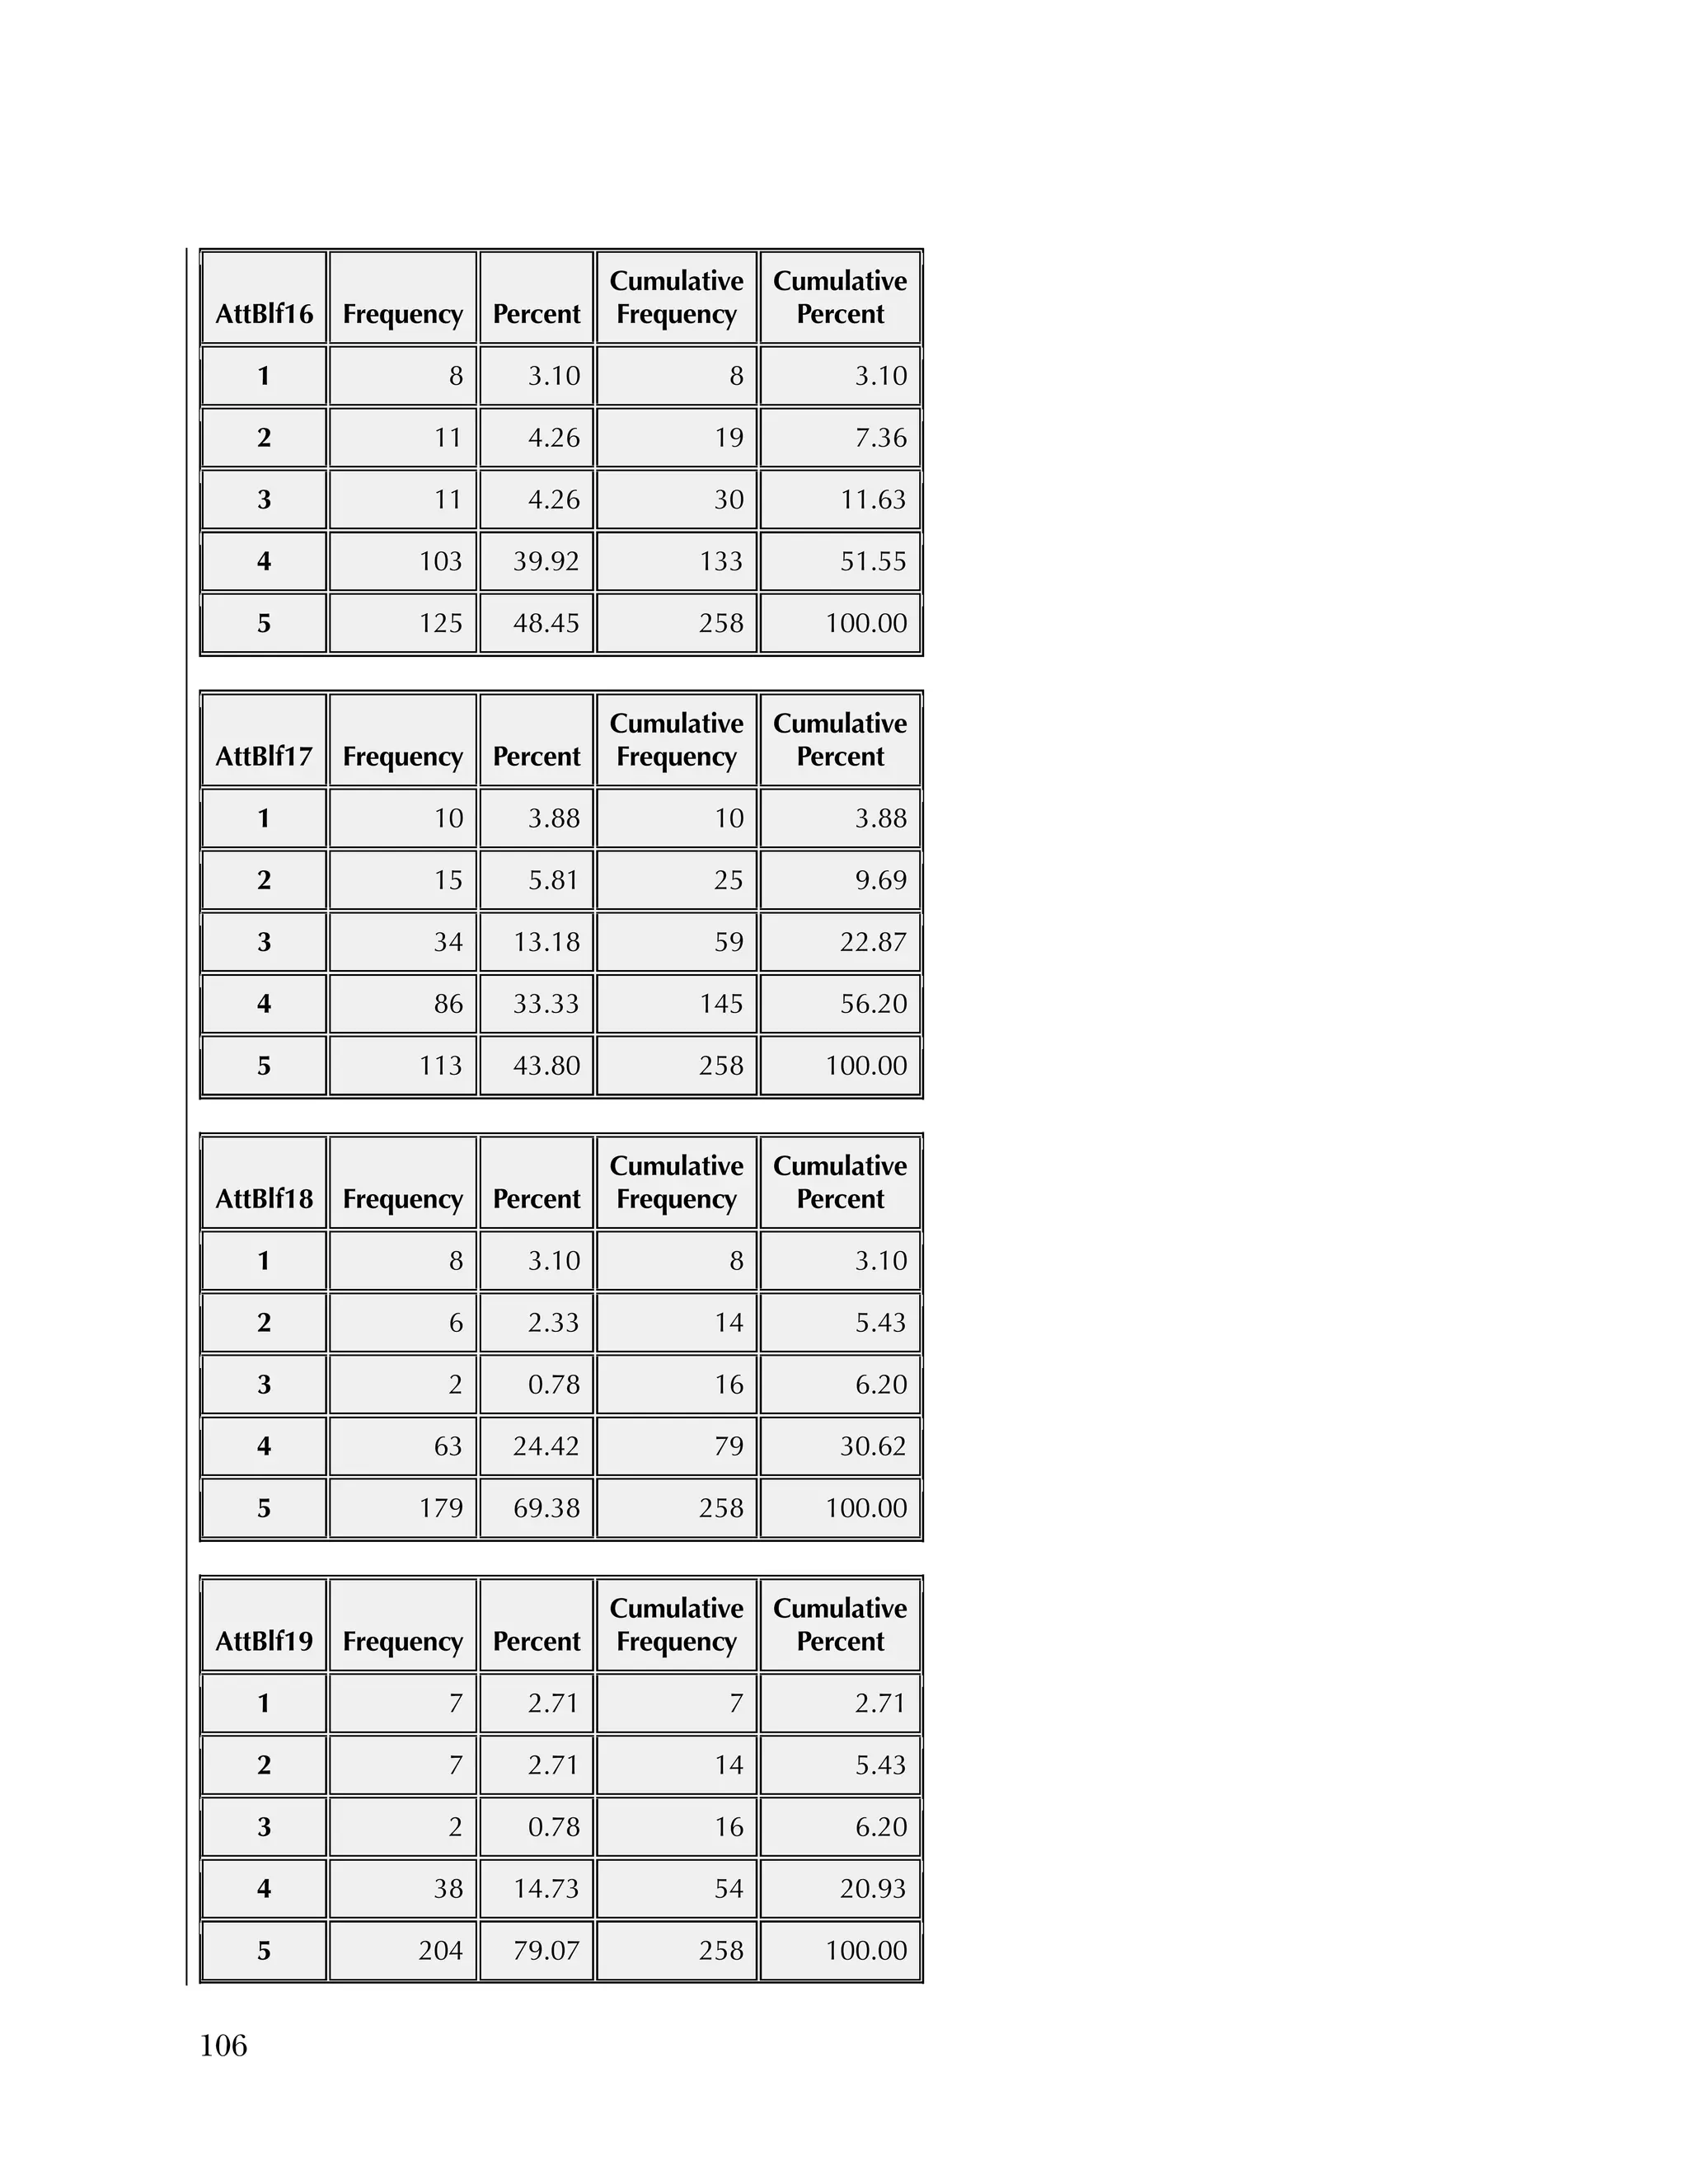
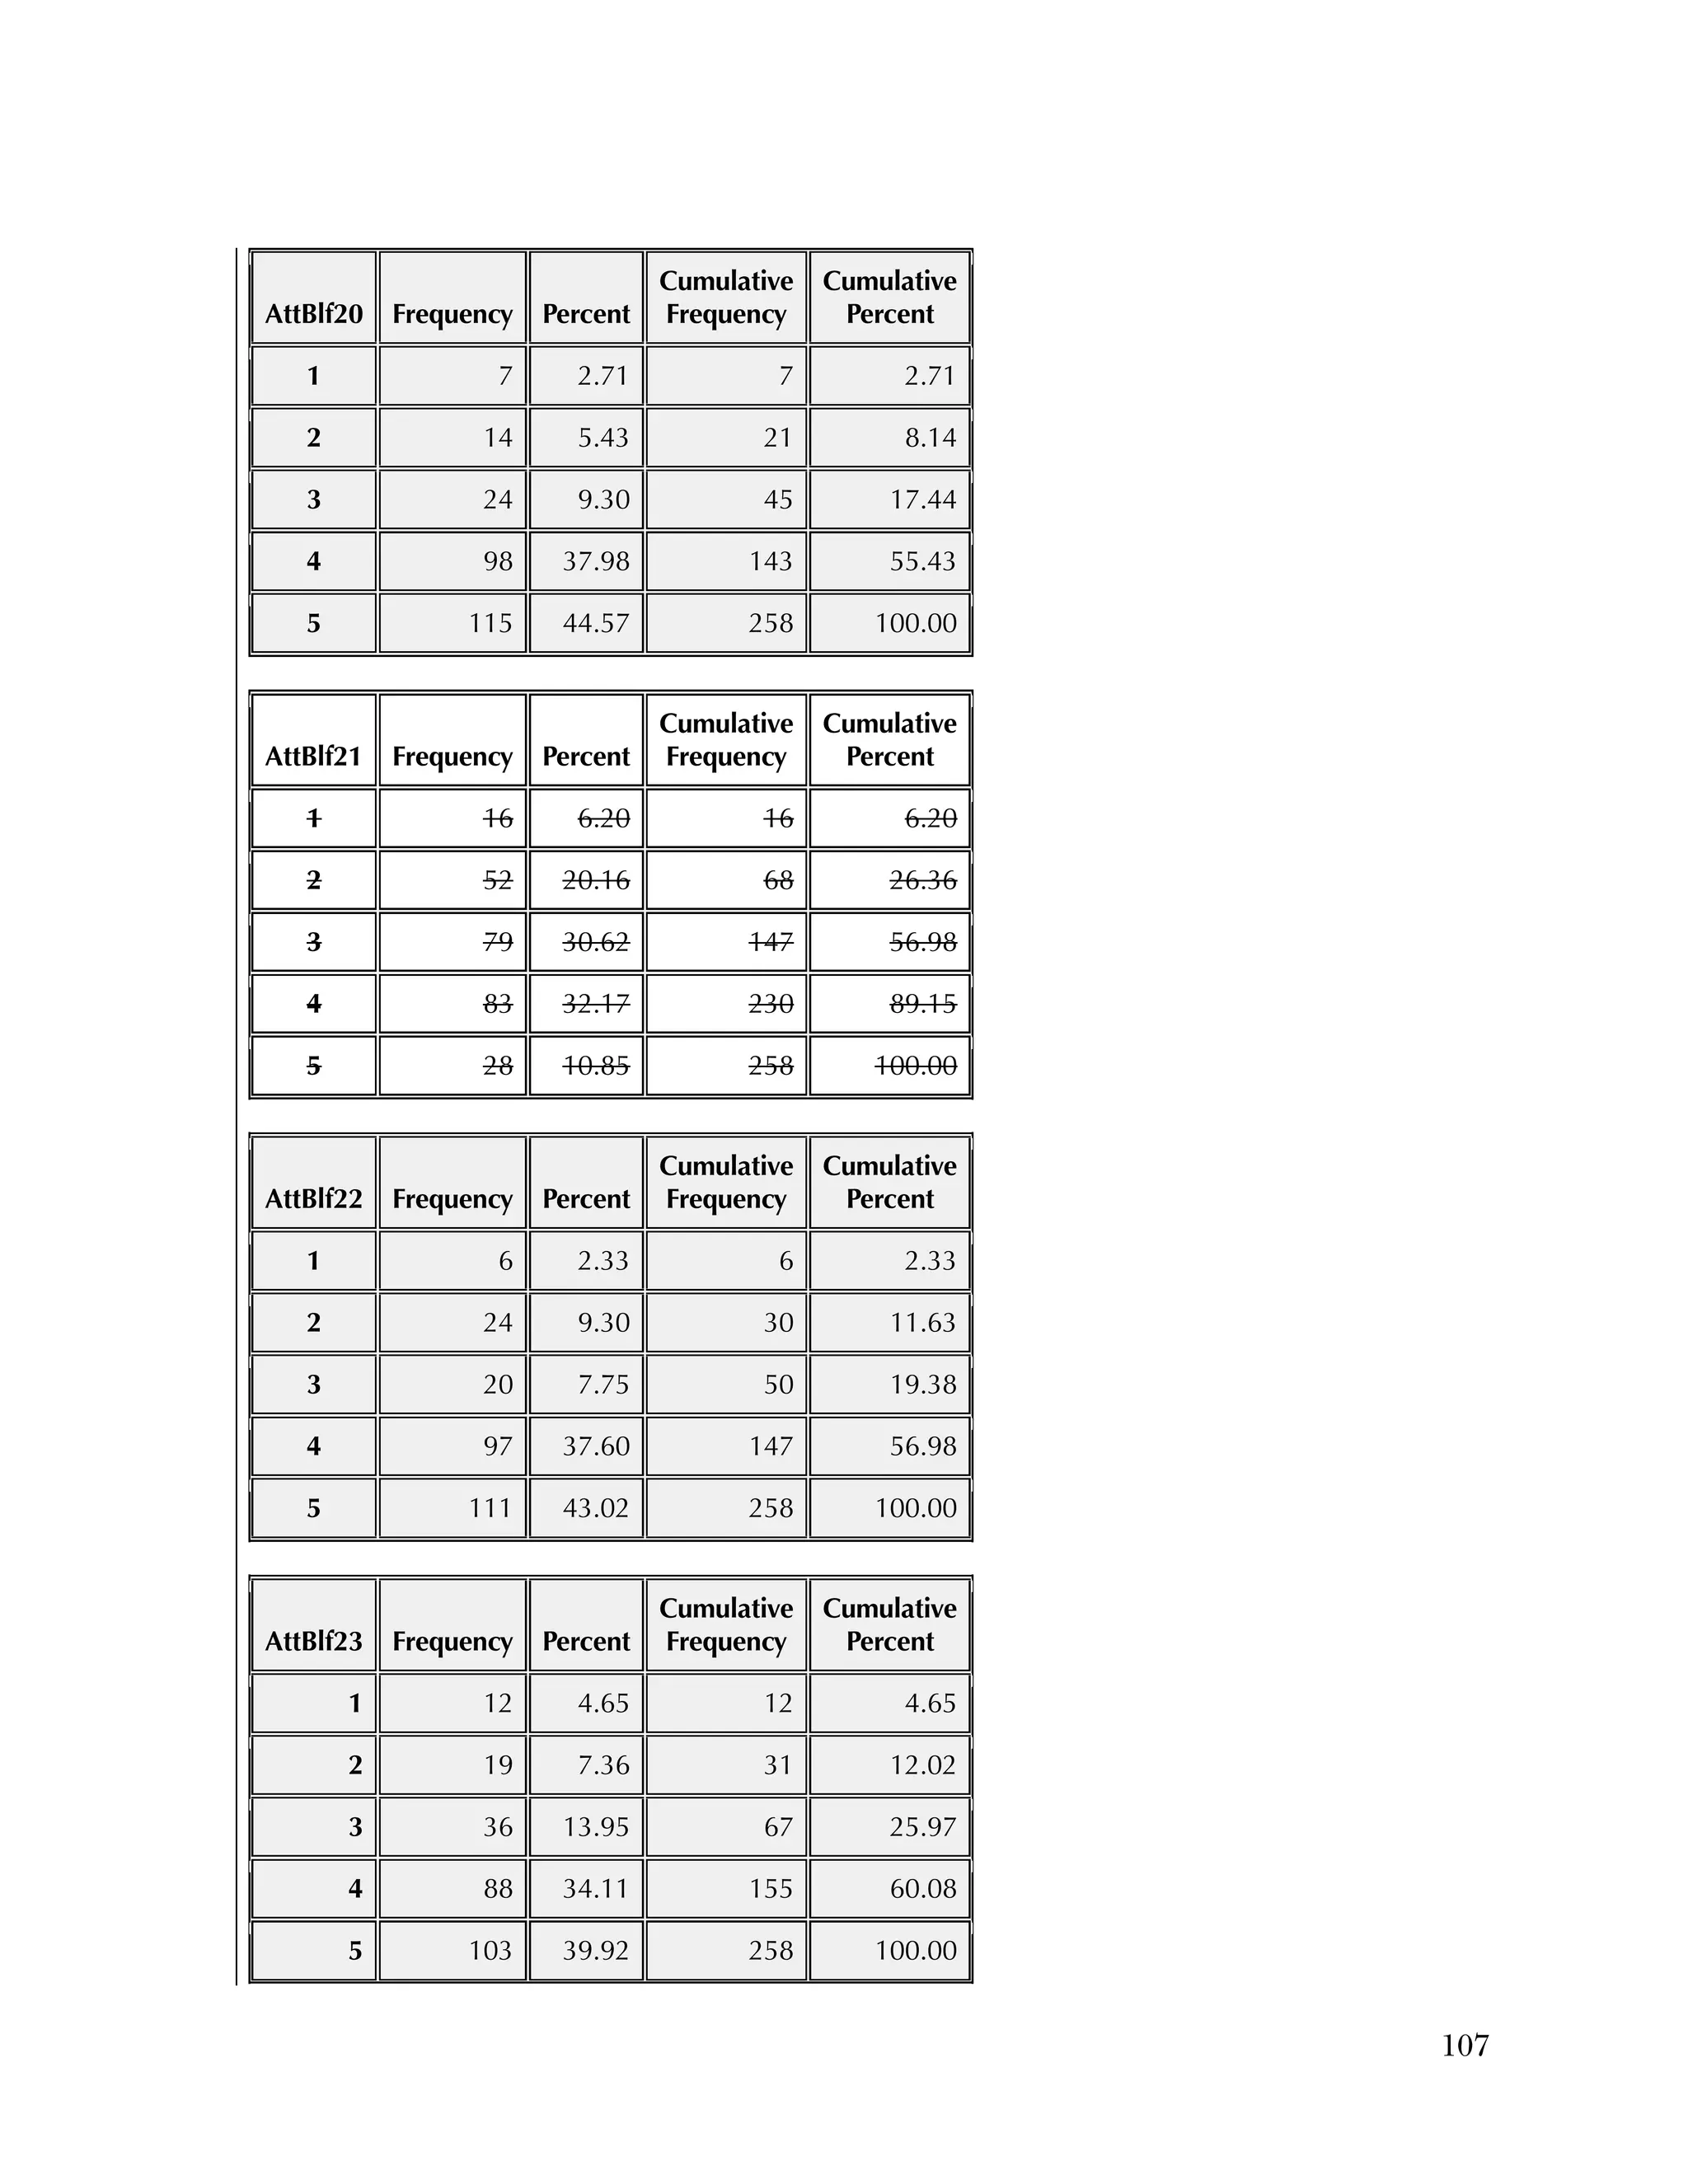
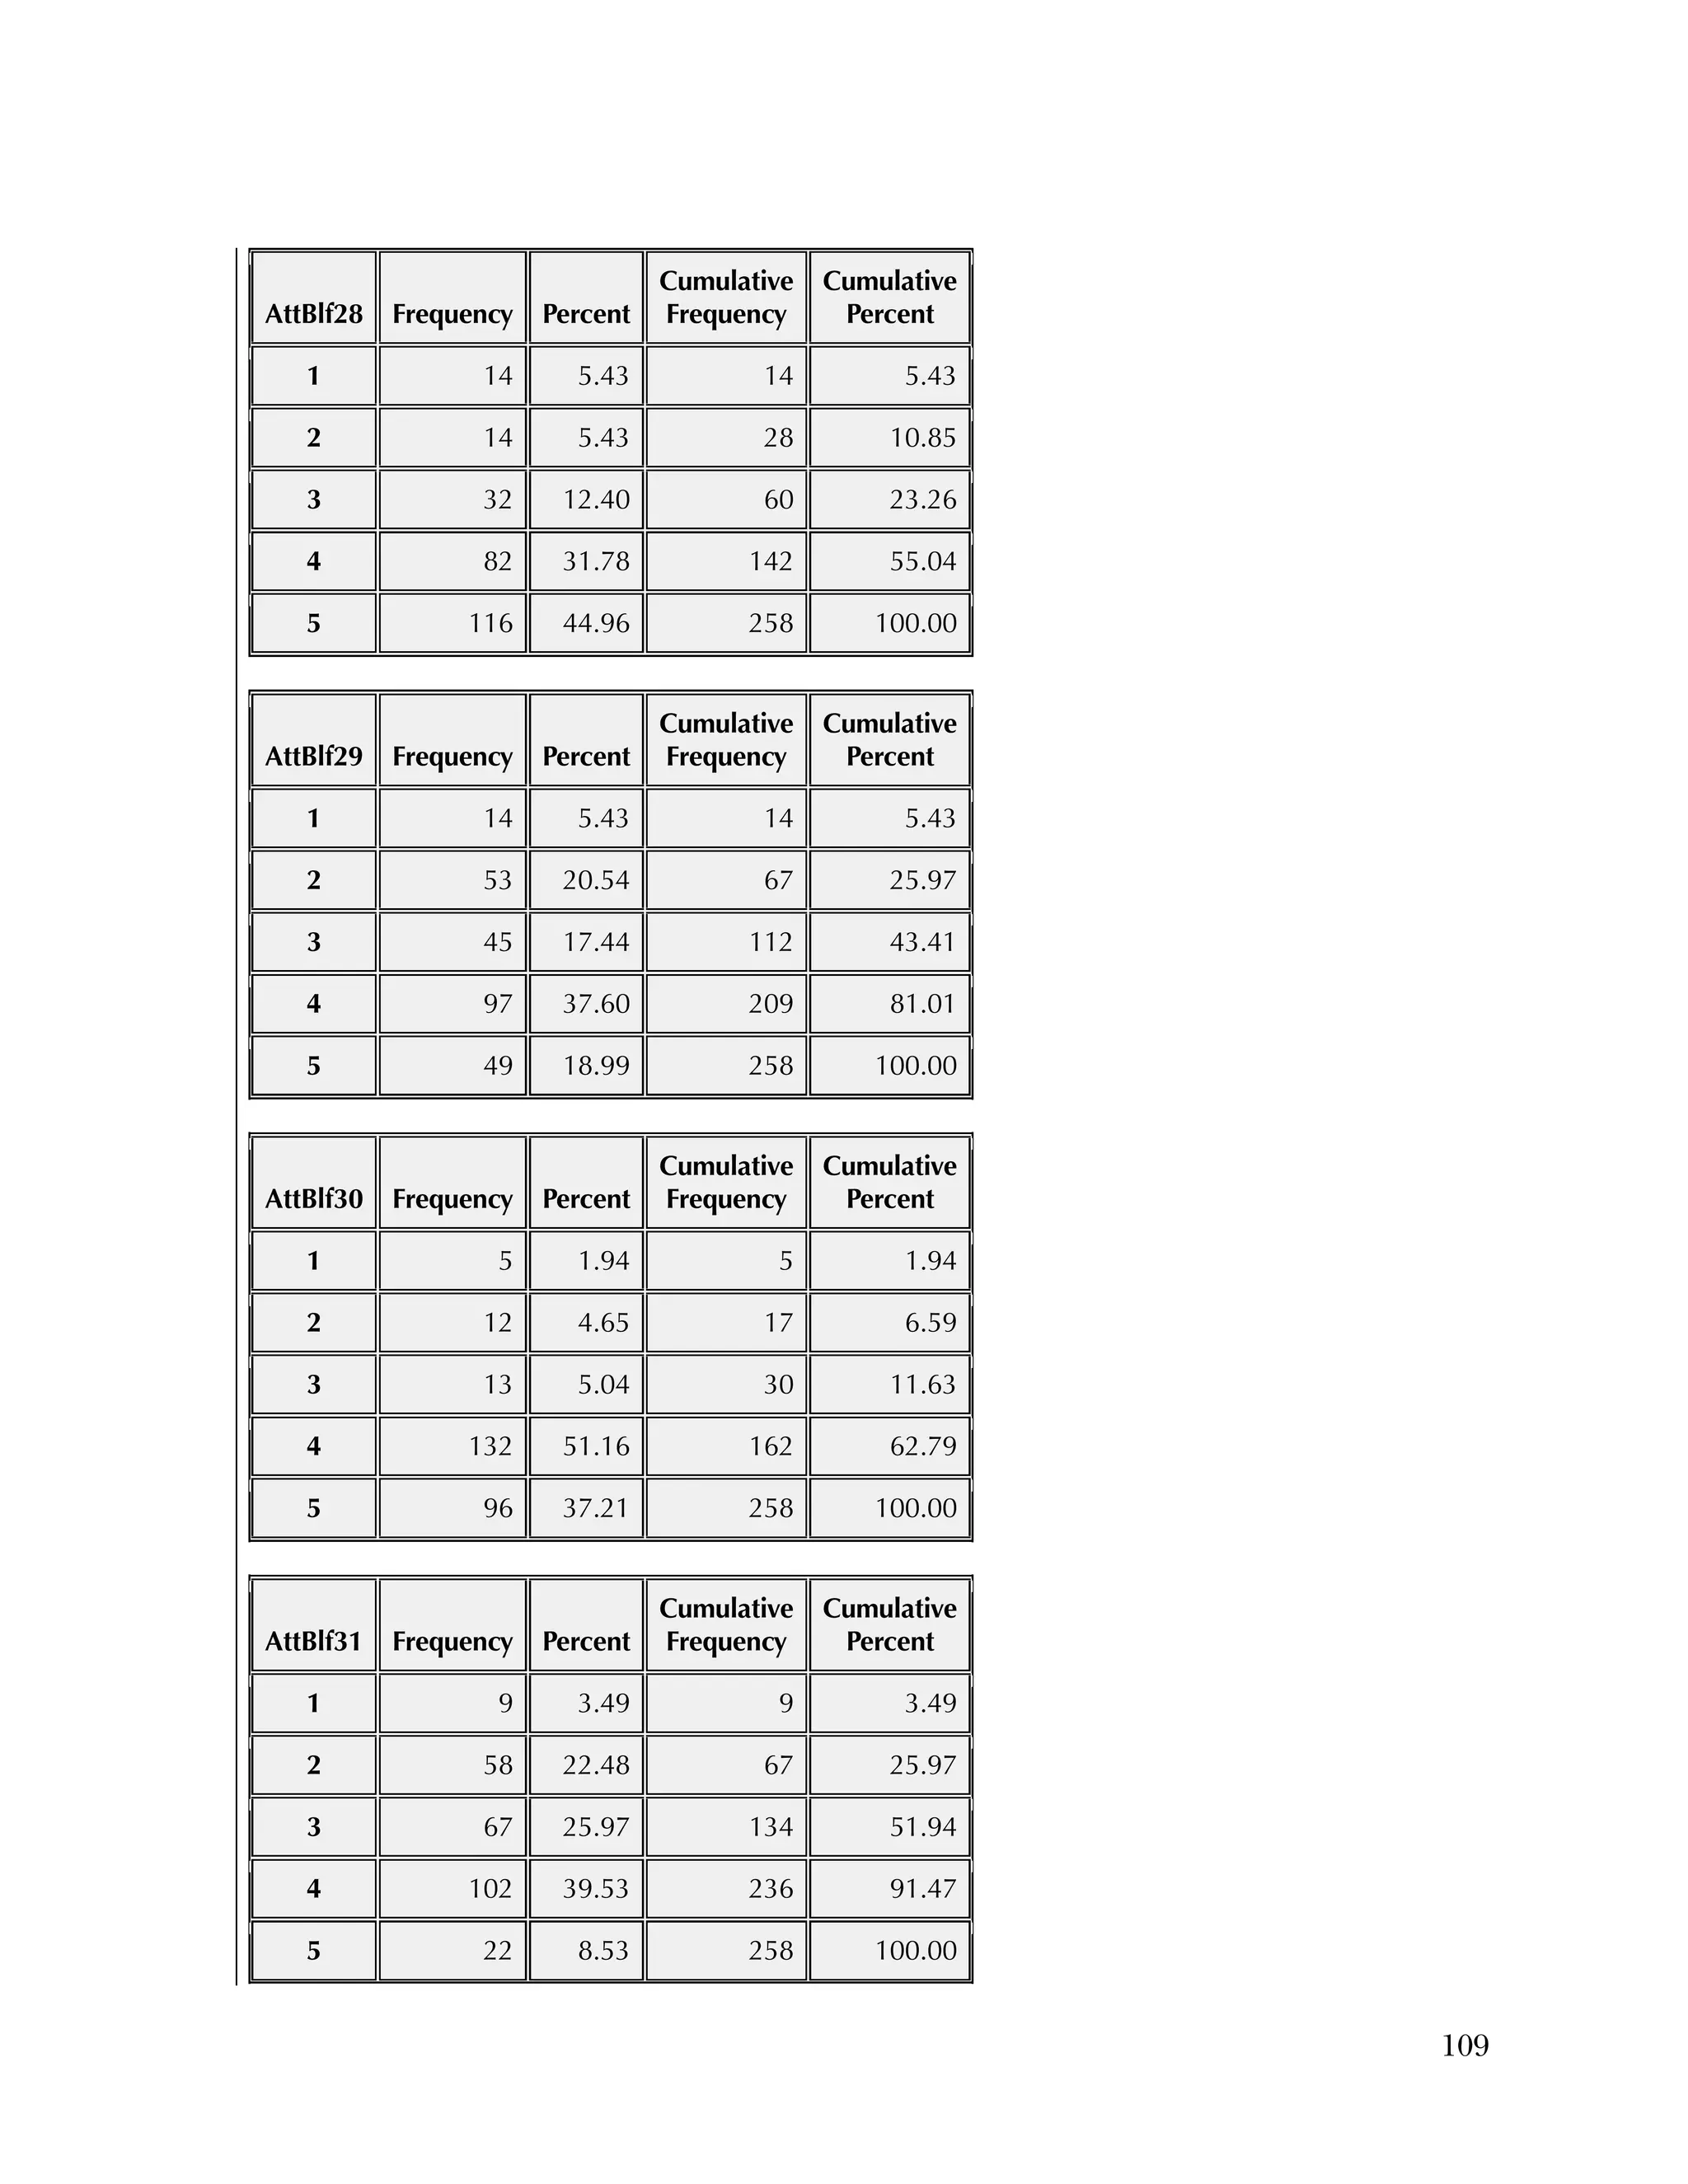
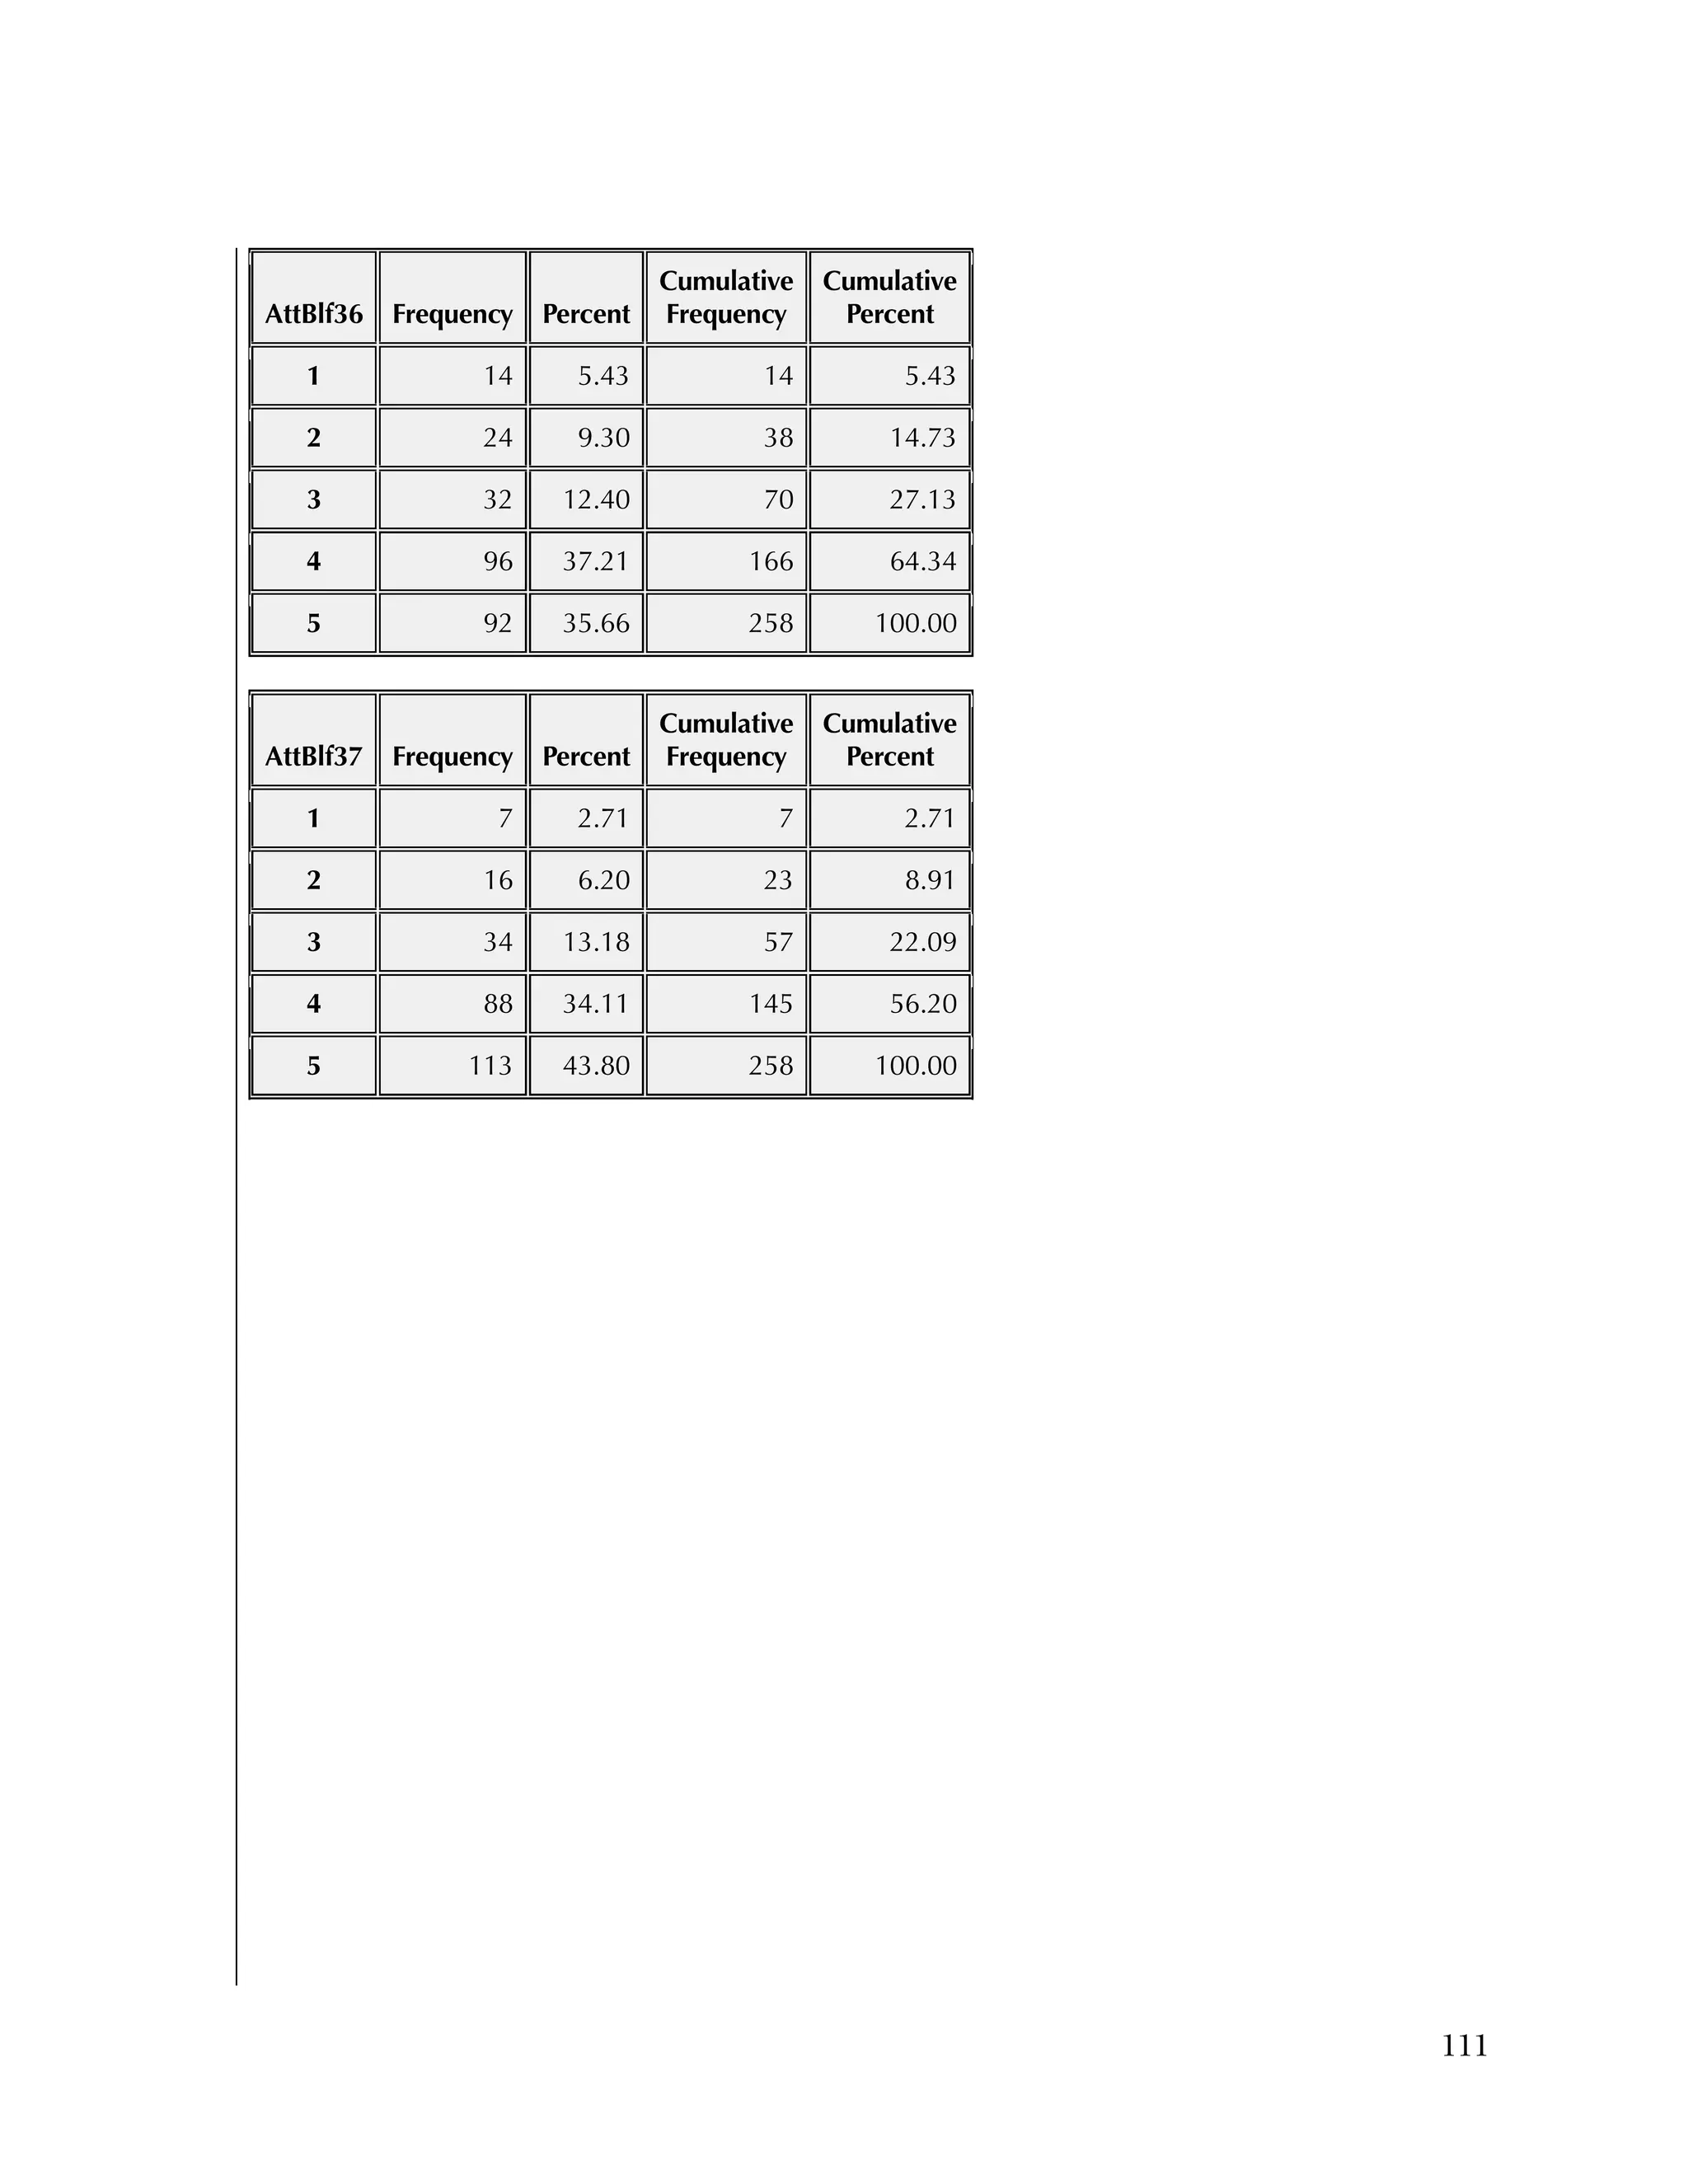
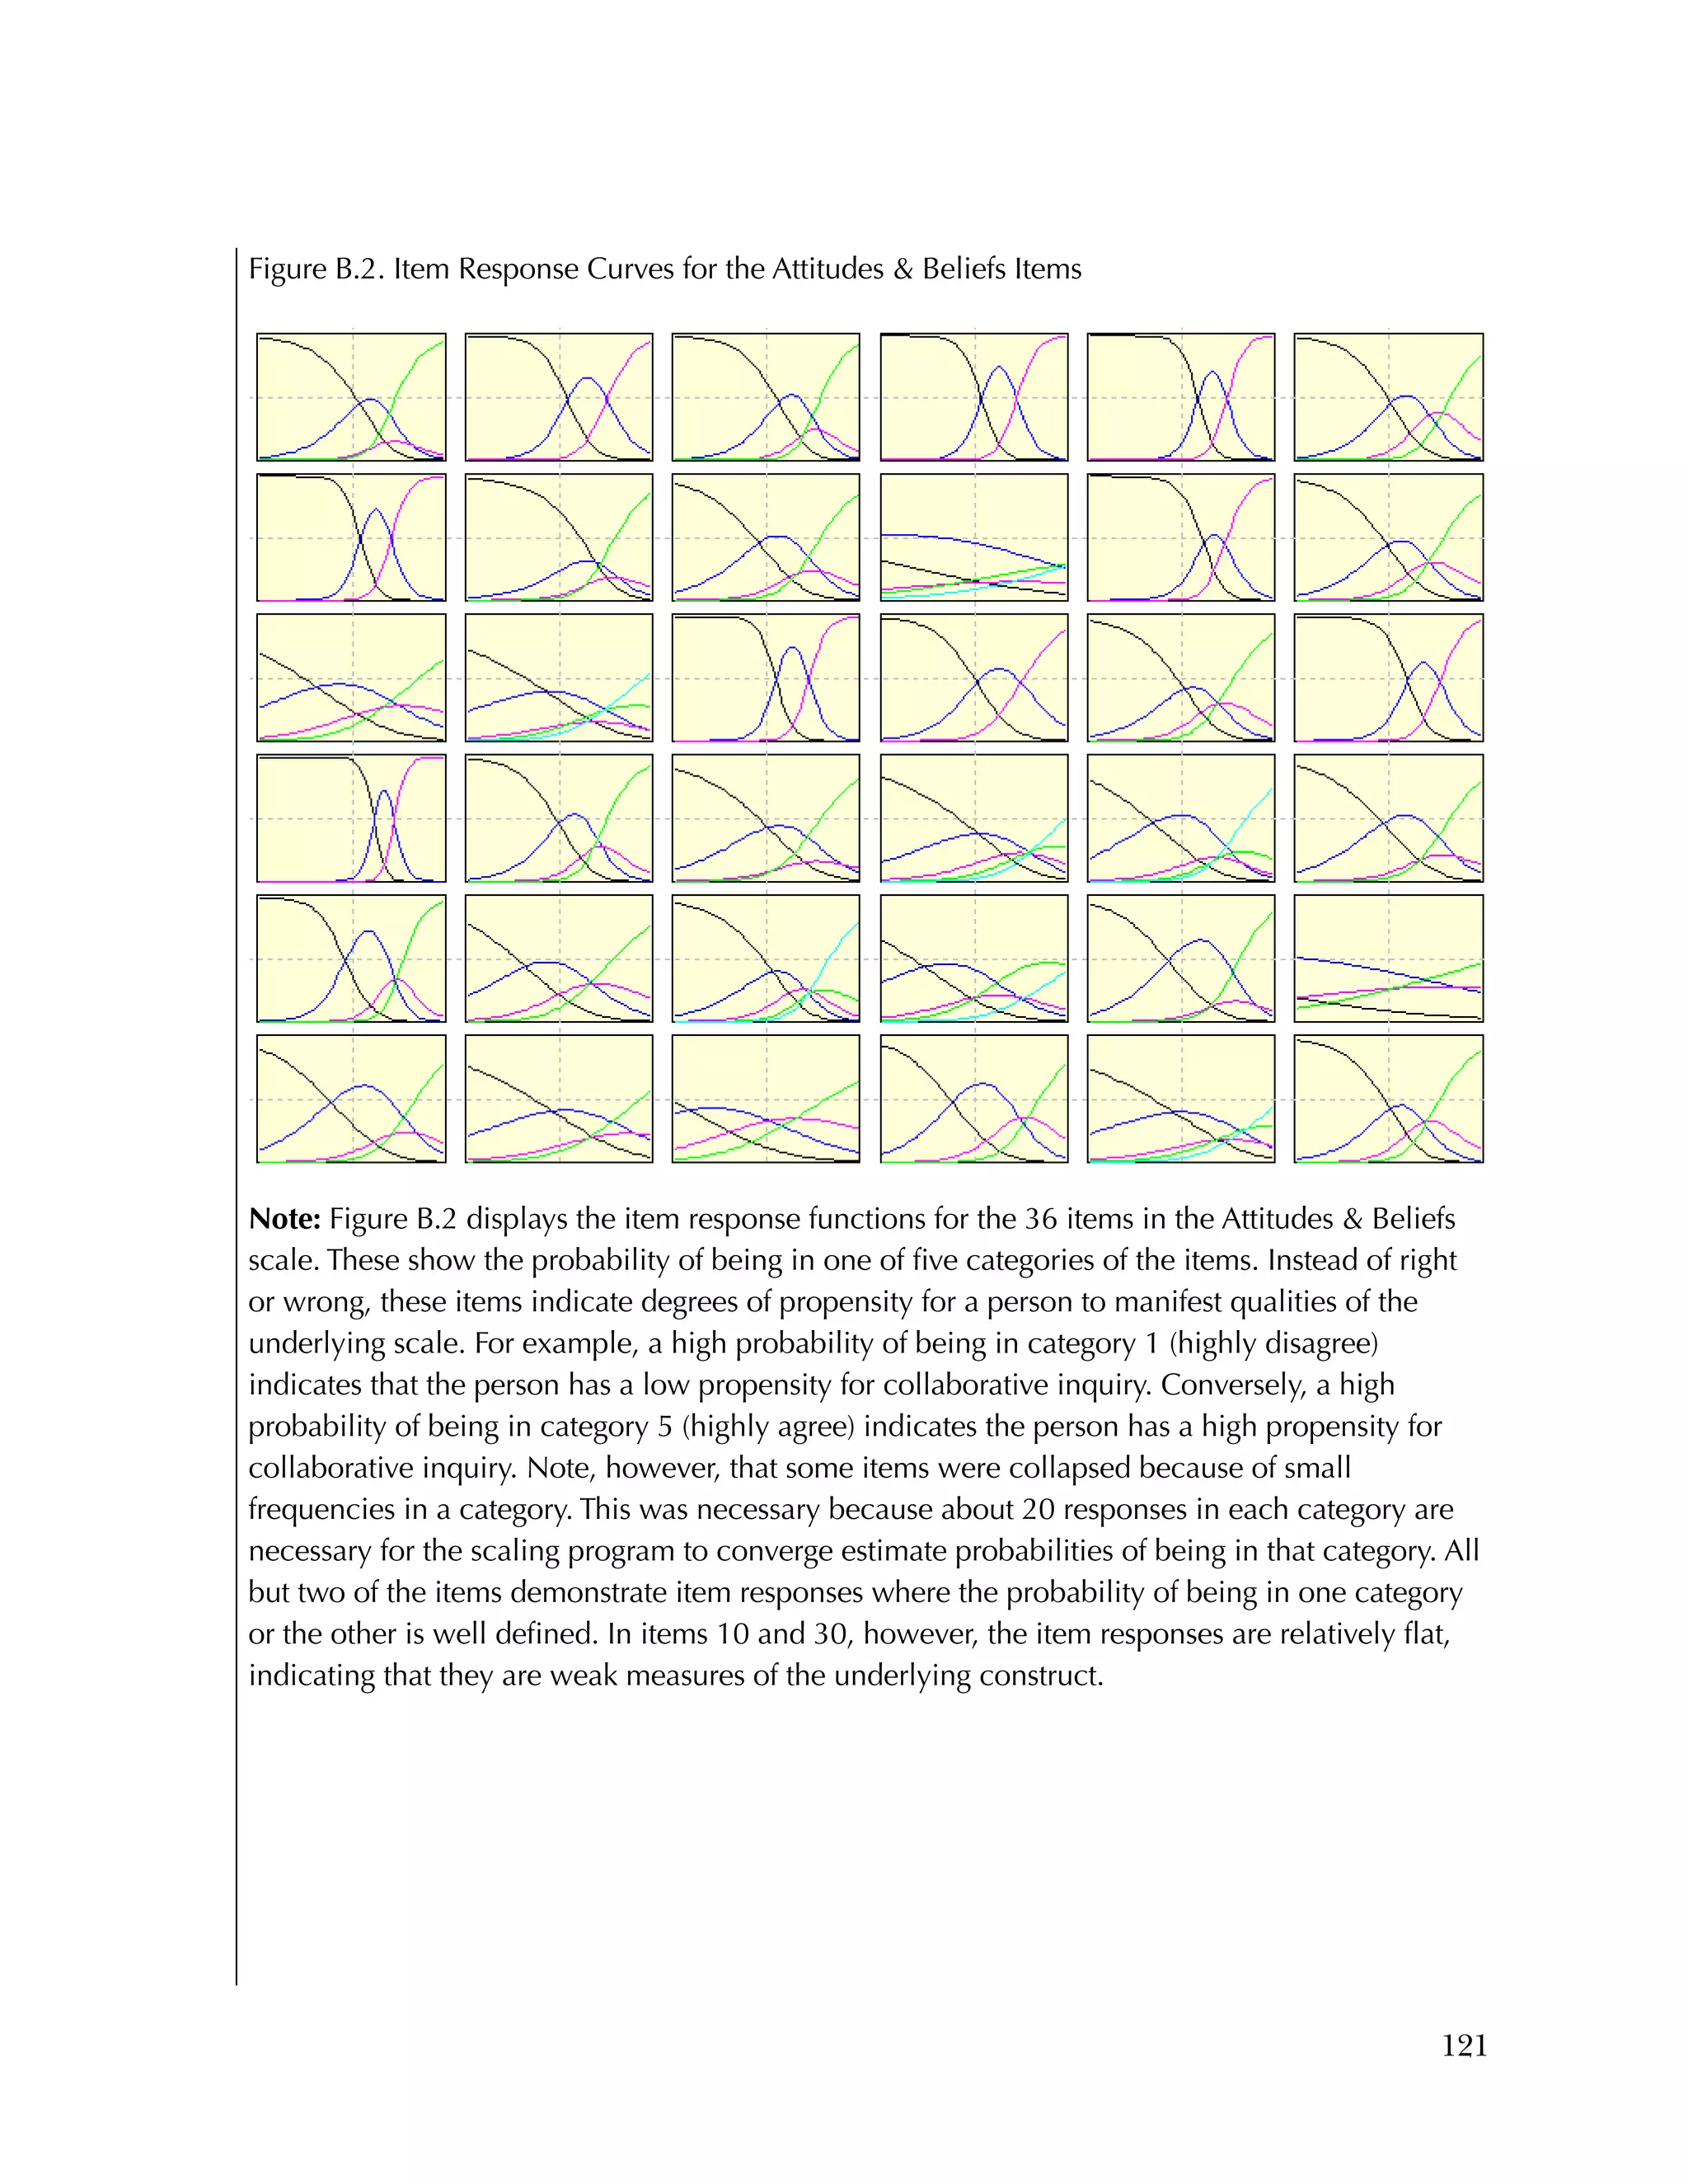
For the Attitudes & Beliefs questionnaire, items were scored from
1=strongly agree to 5=strongly disagree, with five categories of
agreement. Some items were worded in a positive way and some in a
negative. More than half of the items were recoded to make higher
scores positive (5=strongly agree). The three same individuals were
missing for each case. Table B.5 lists the frequencies for the 37 items,
reflecting recoding to make all items positive.
Overall, the items tended to be answered positively, with 16 of the 37
items having 85 percent or higher in the most positive two categories.
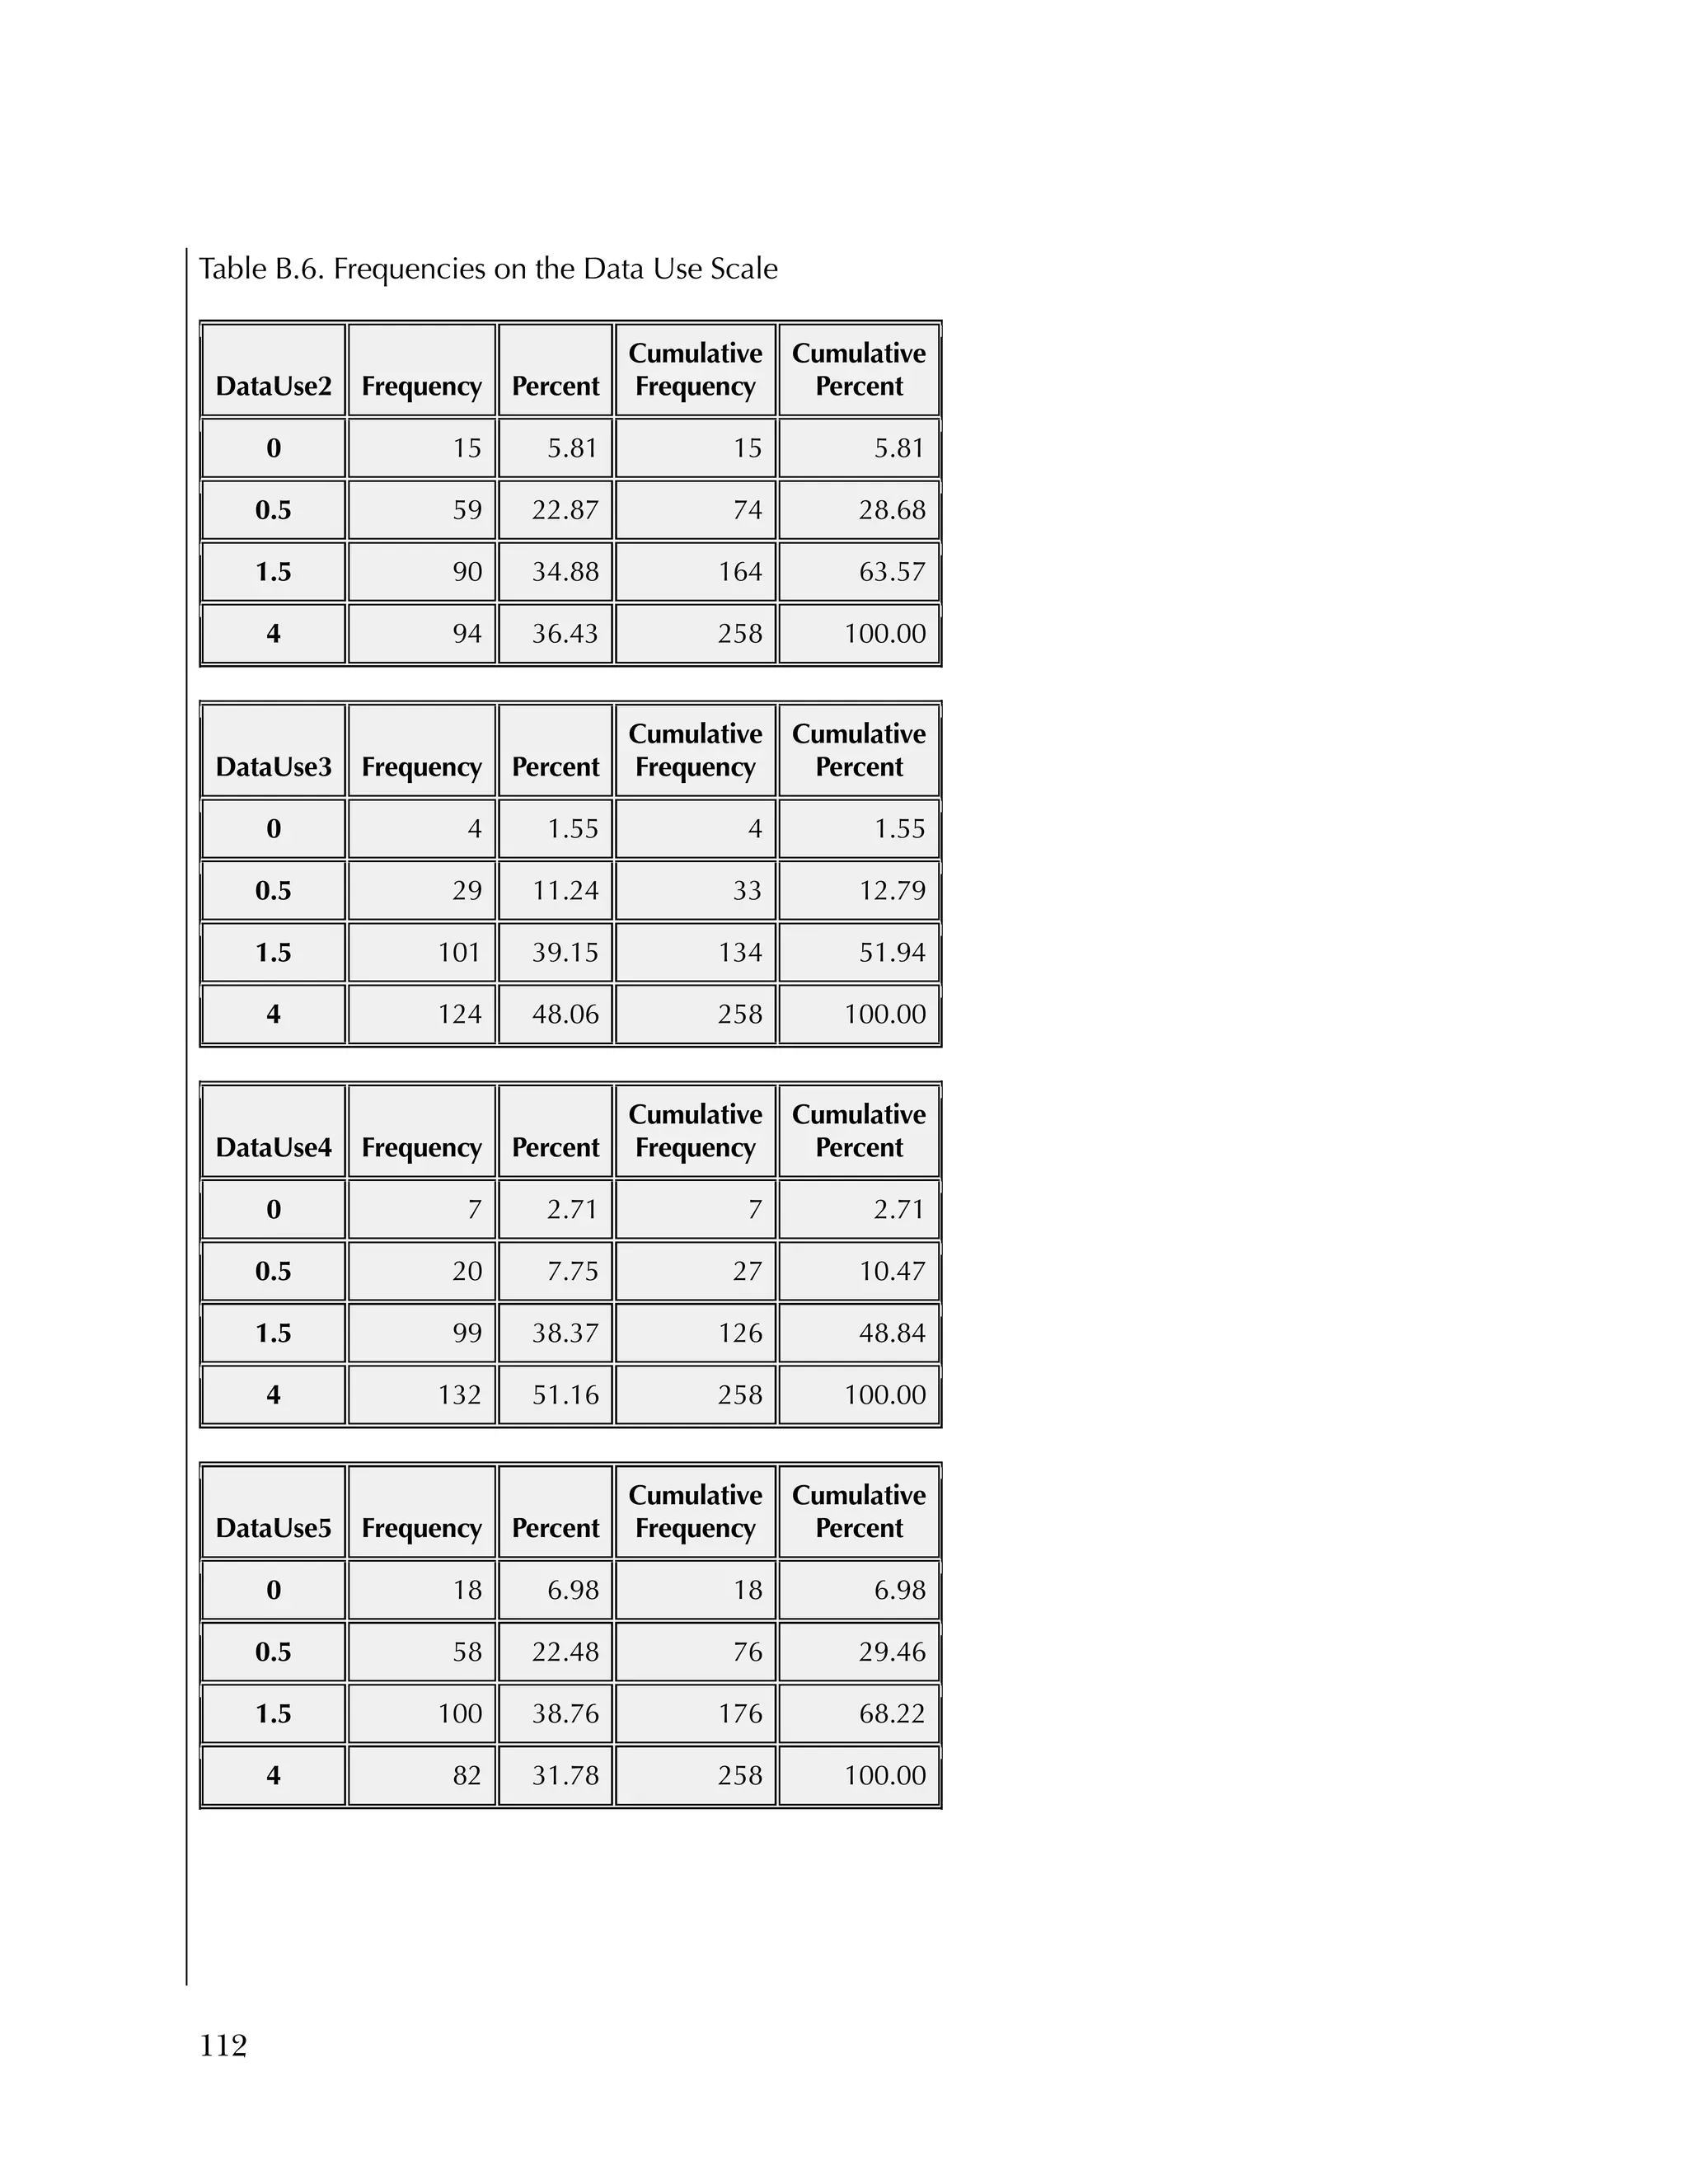
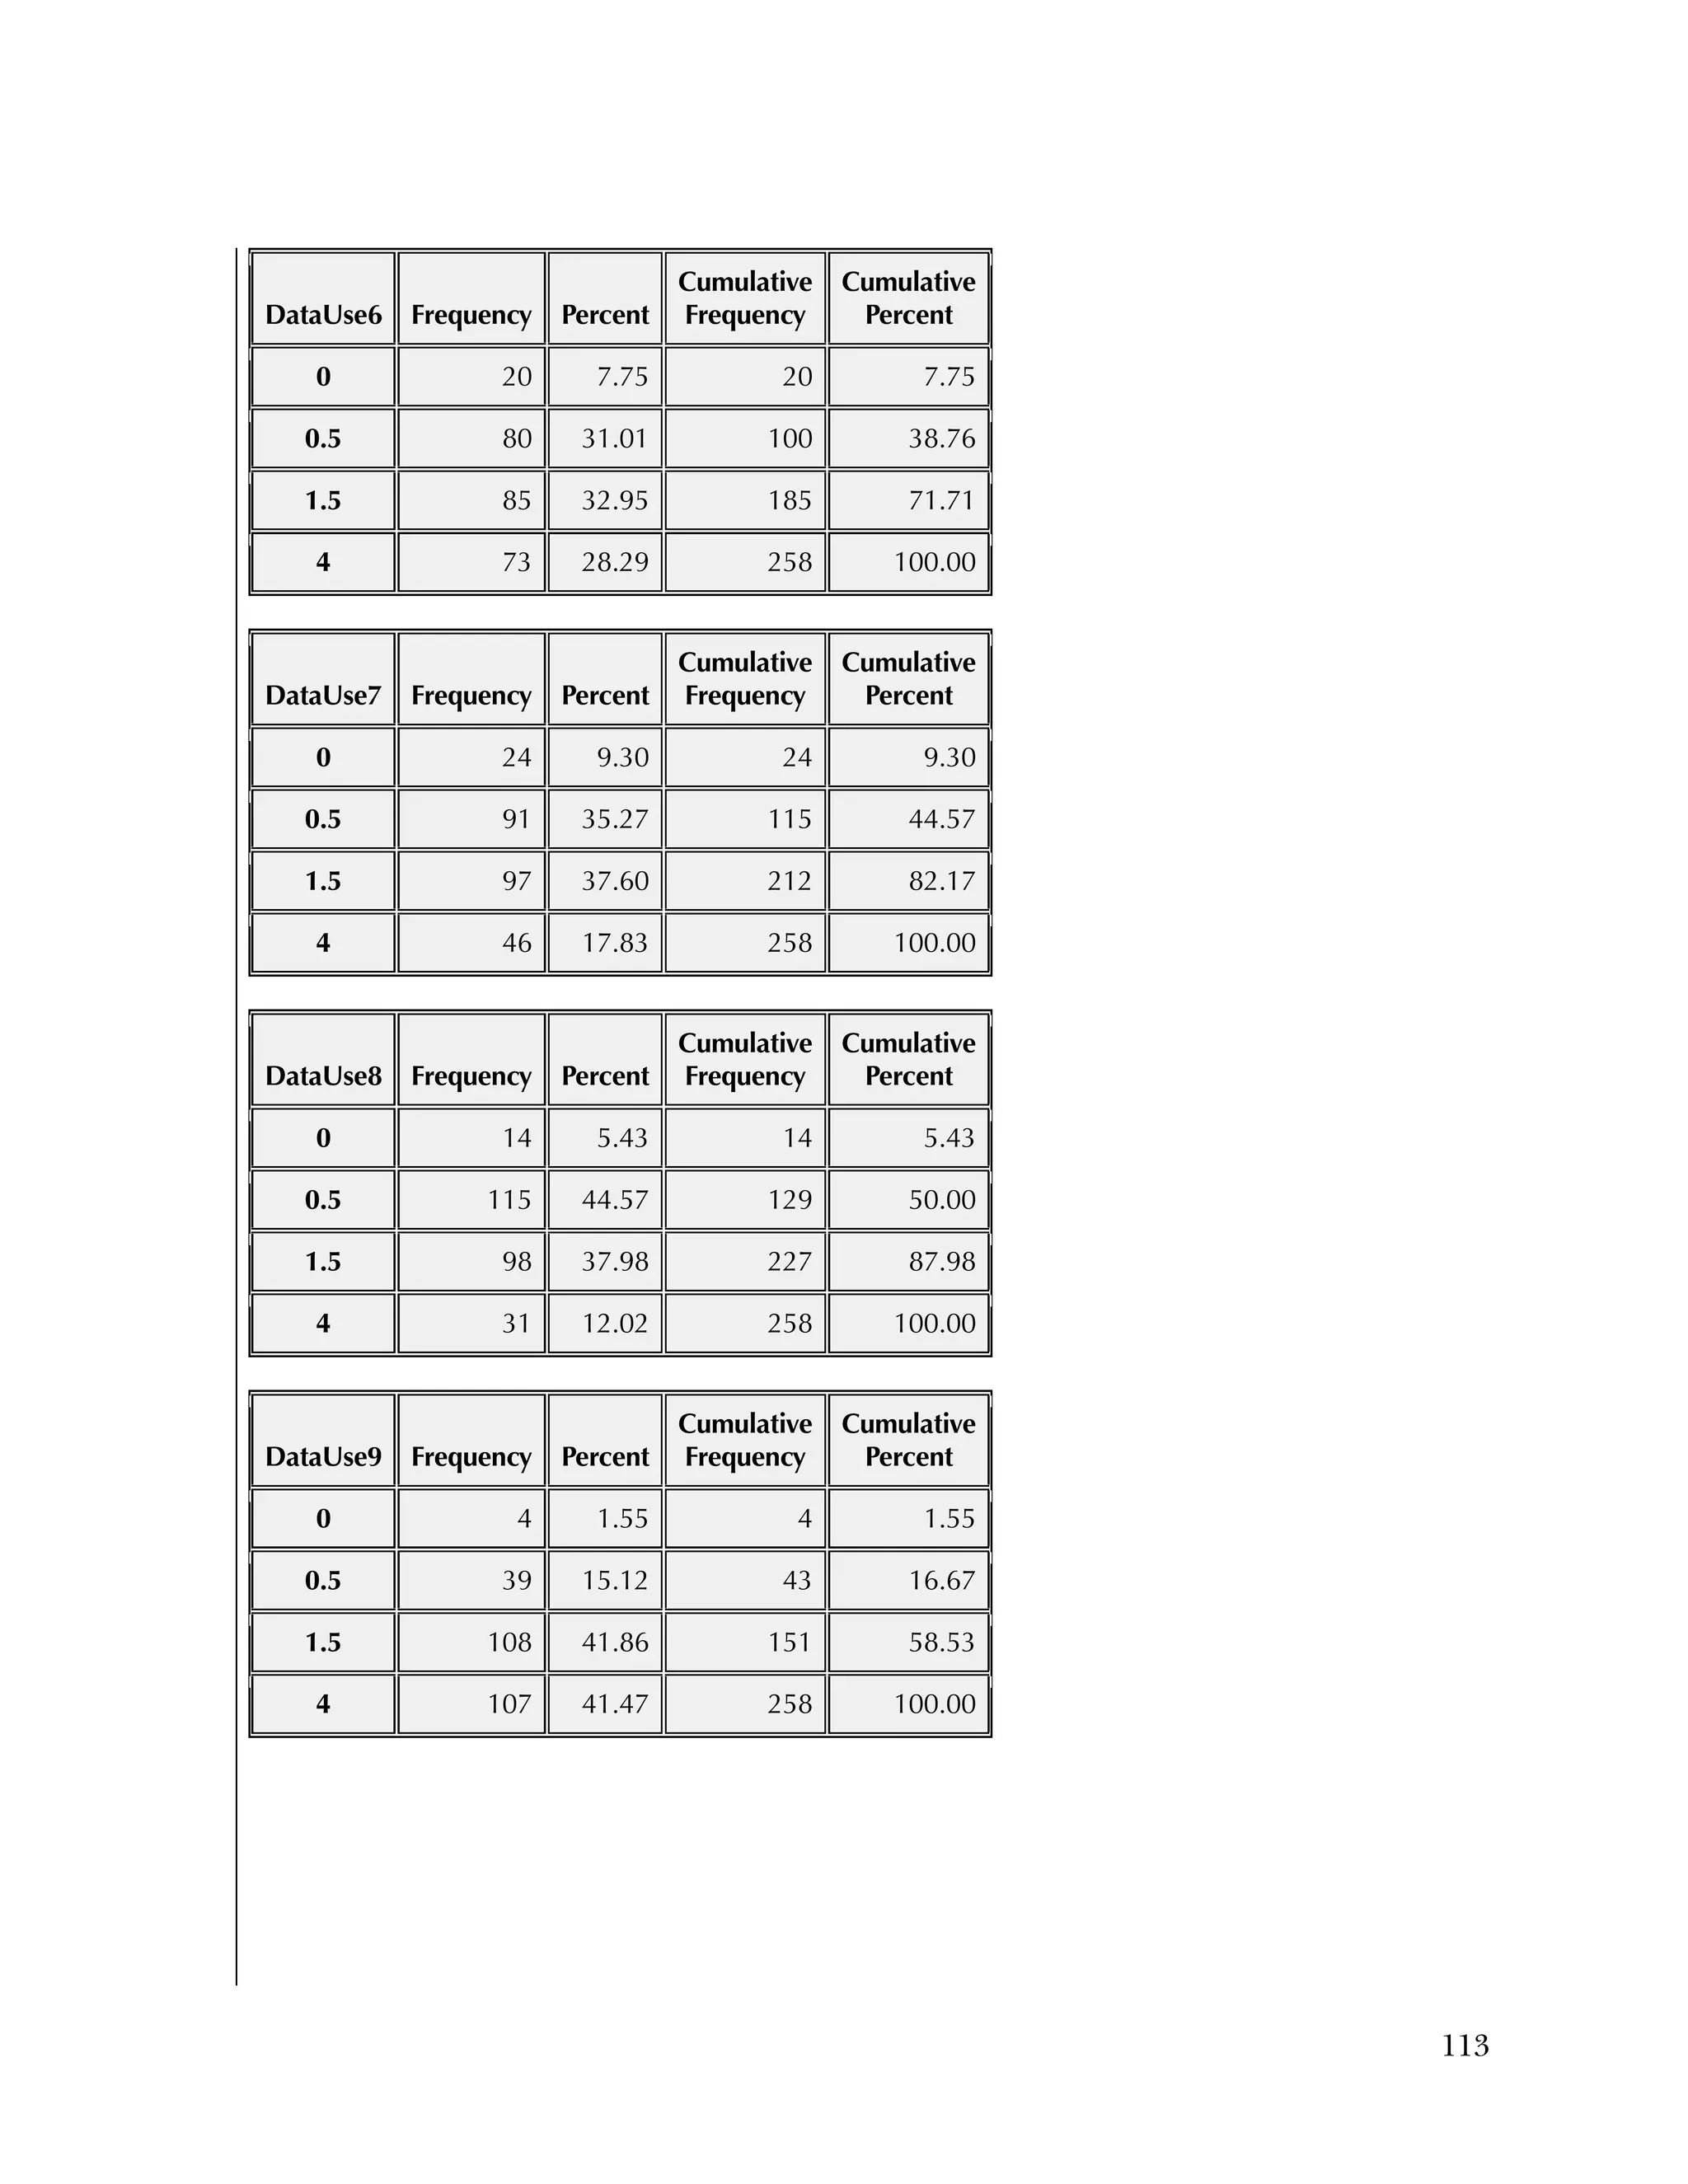
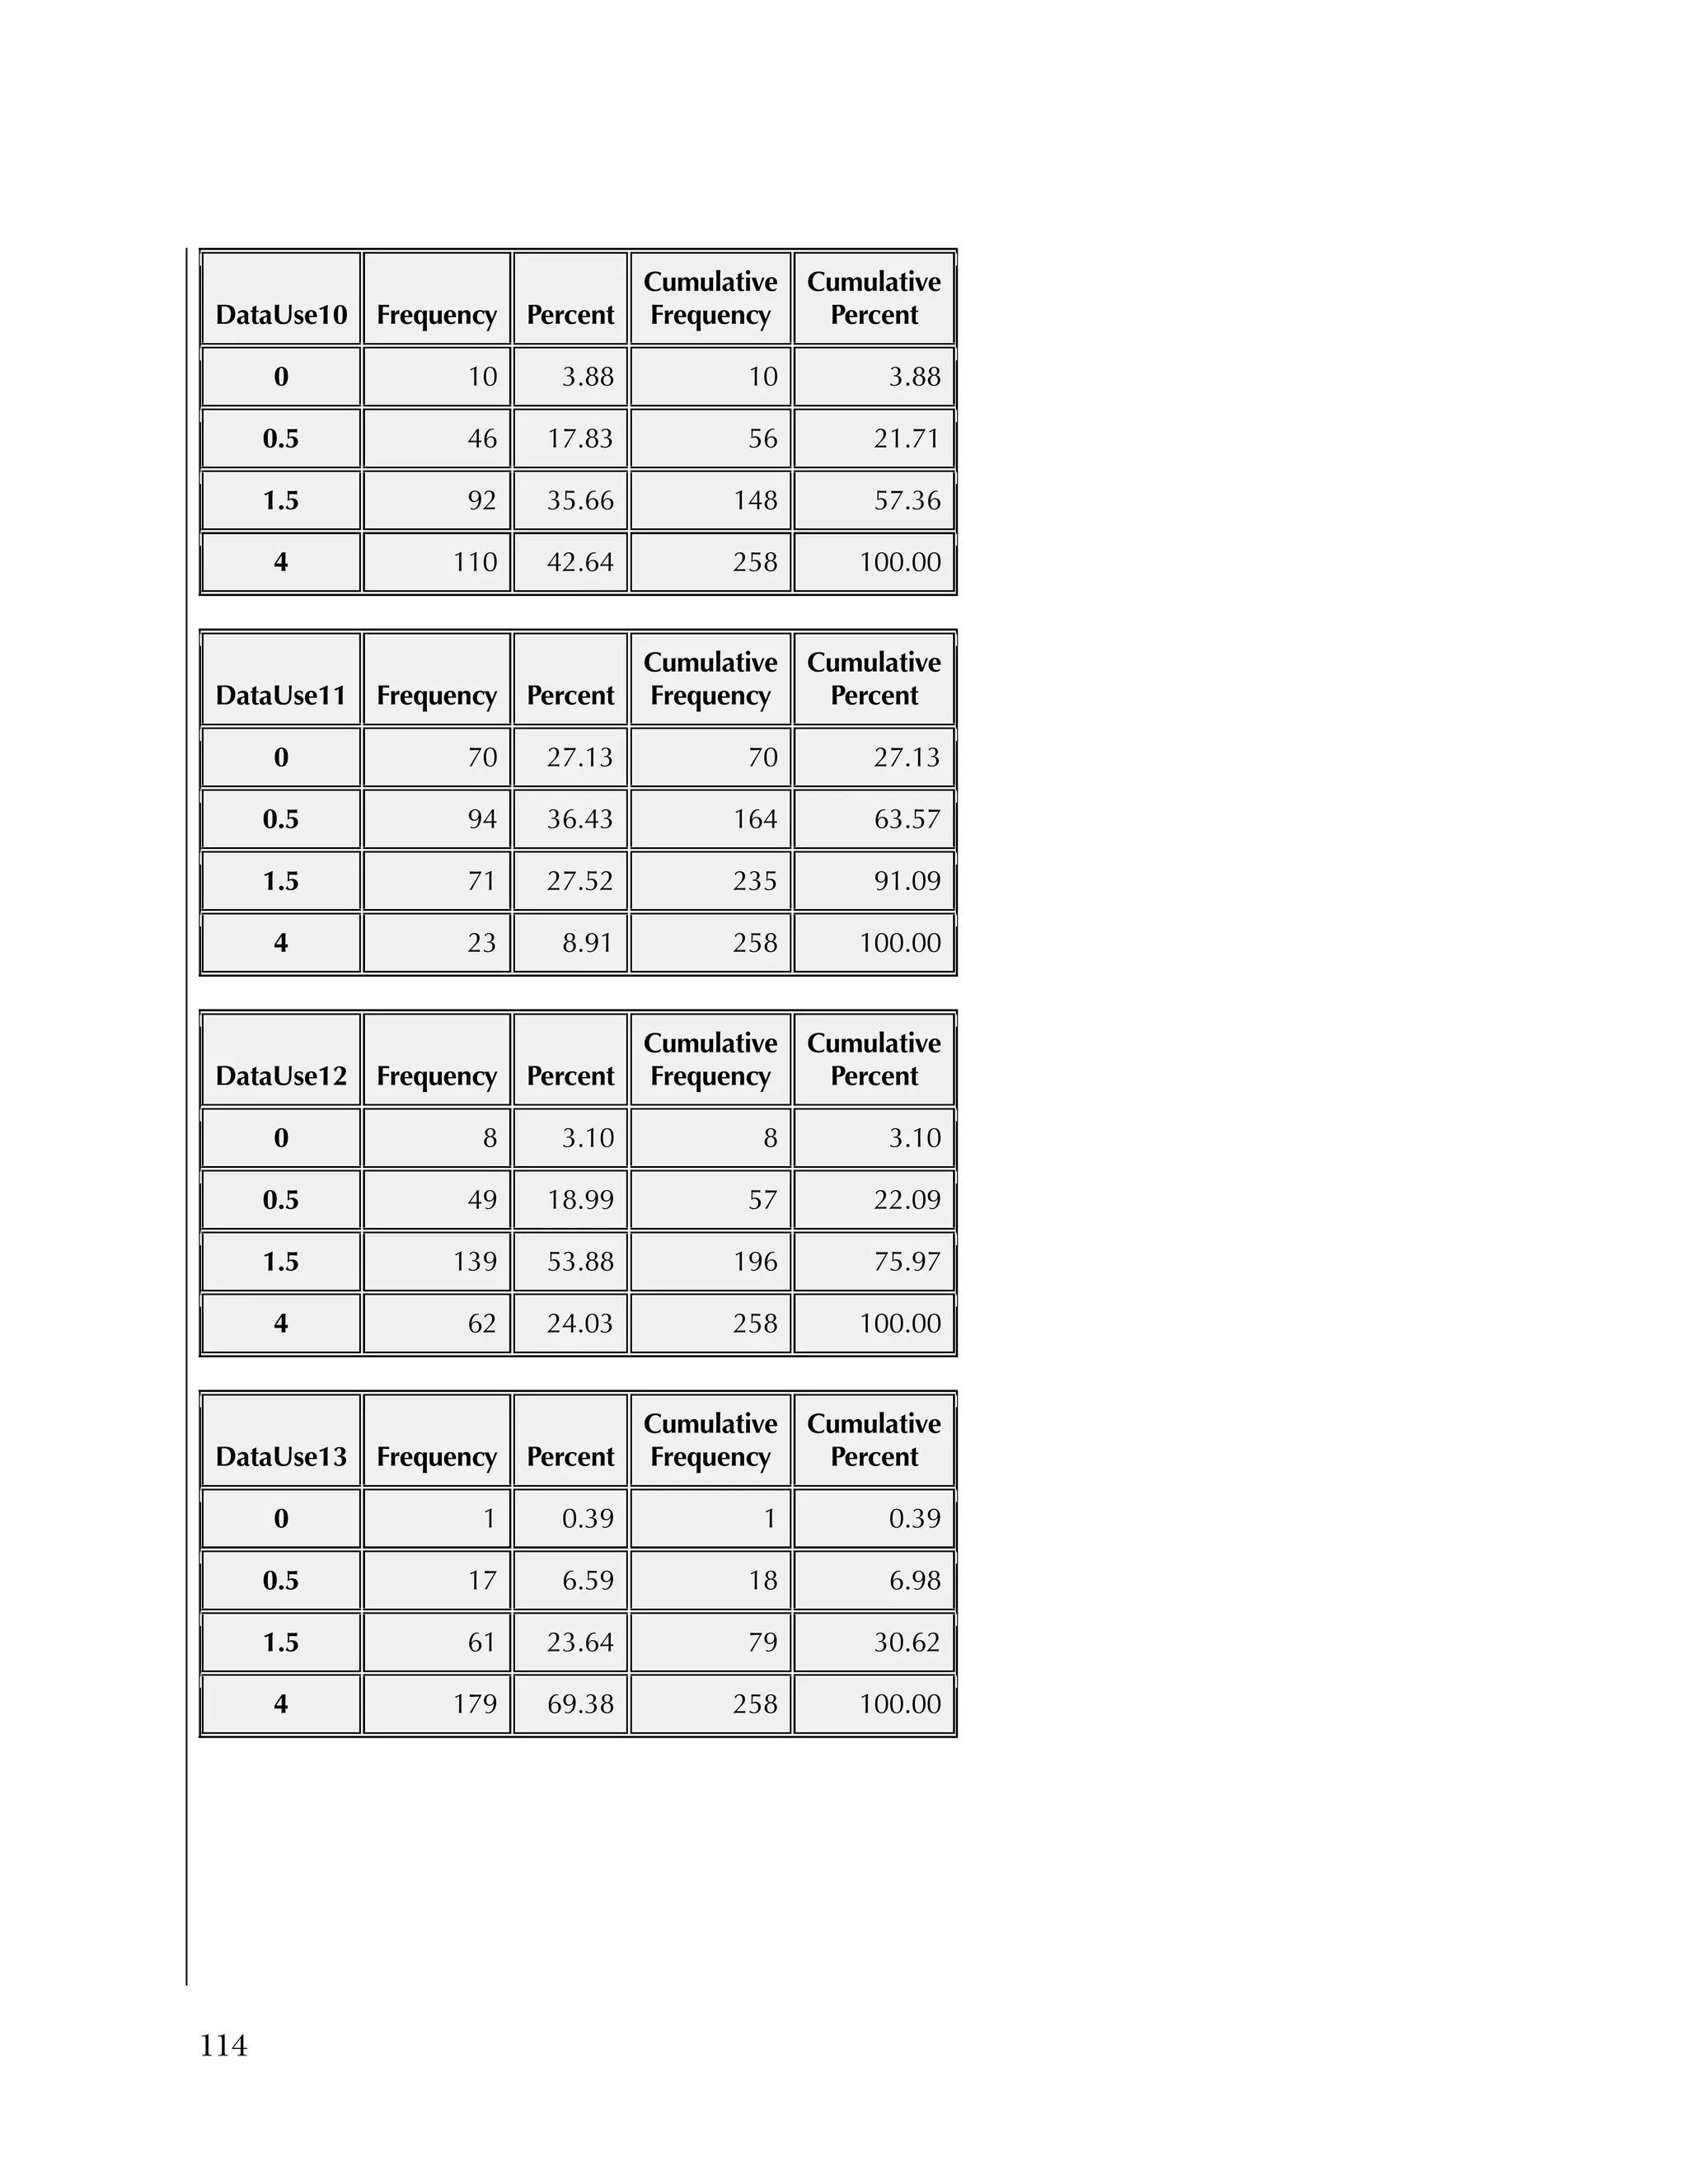
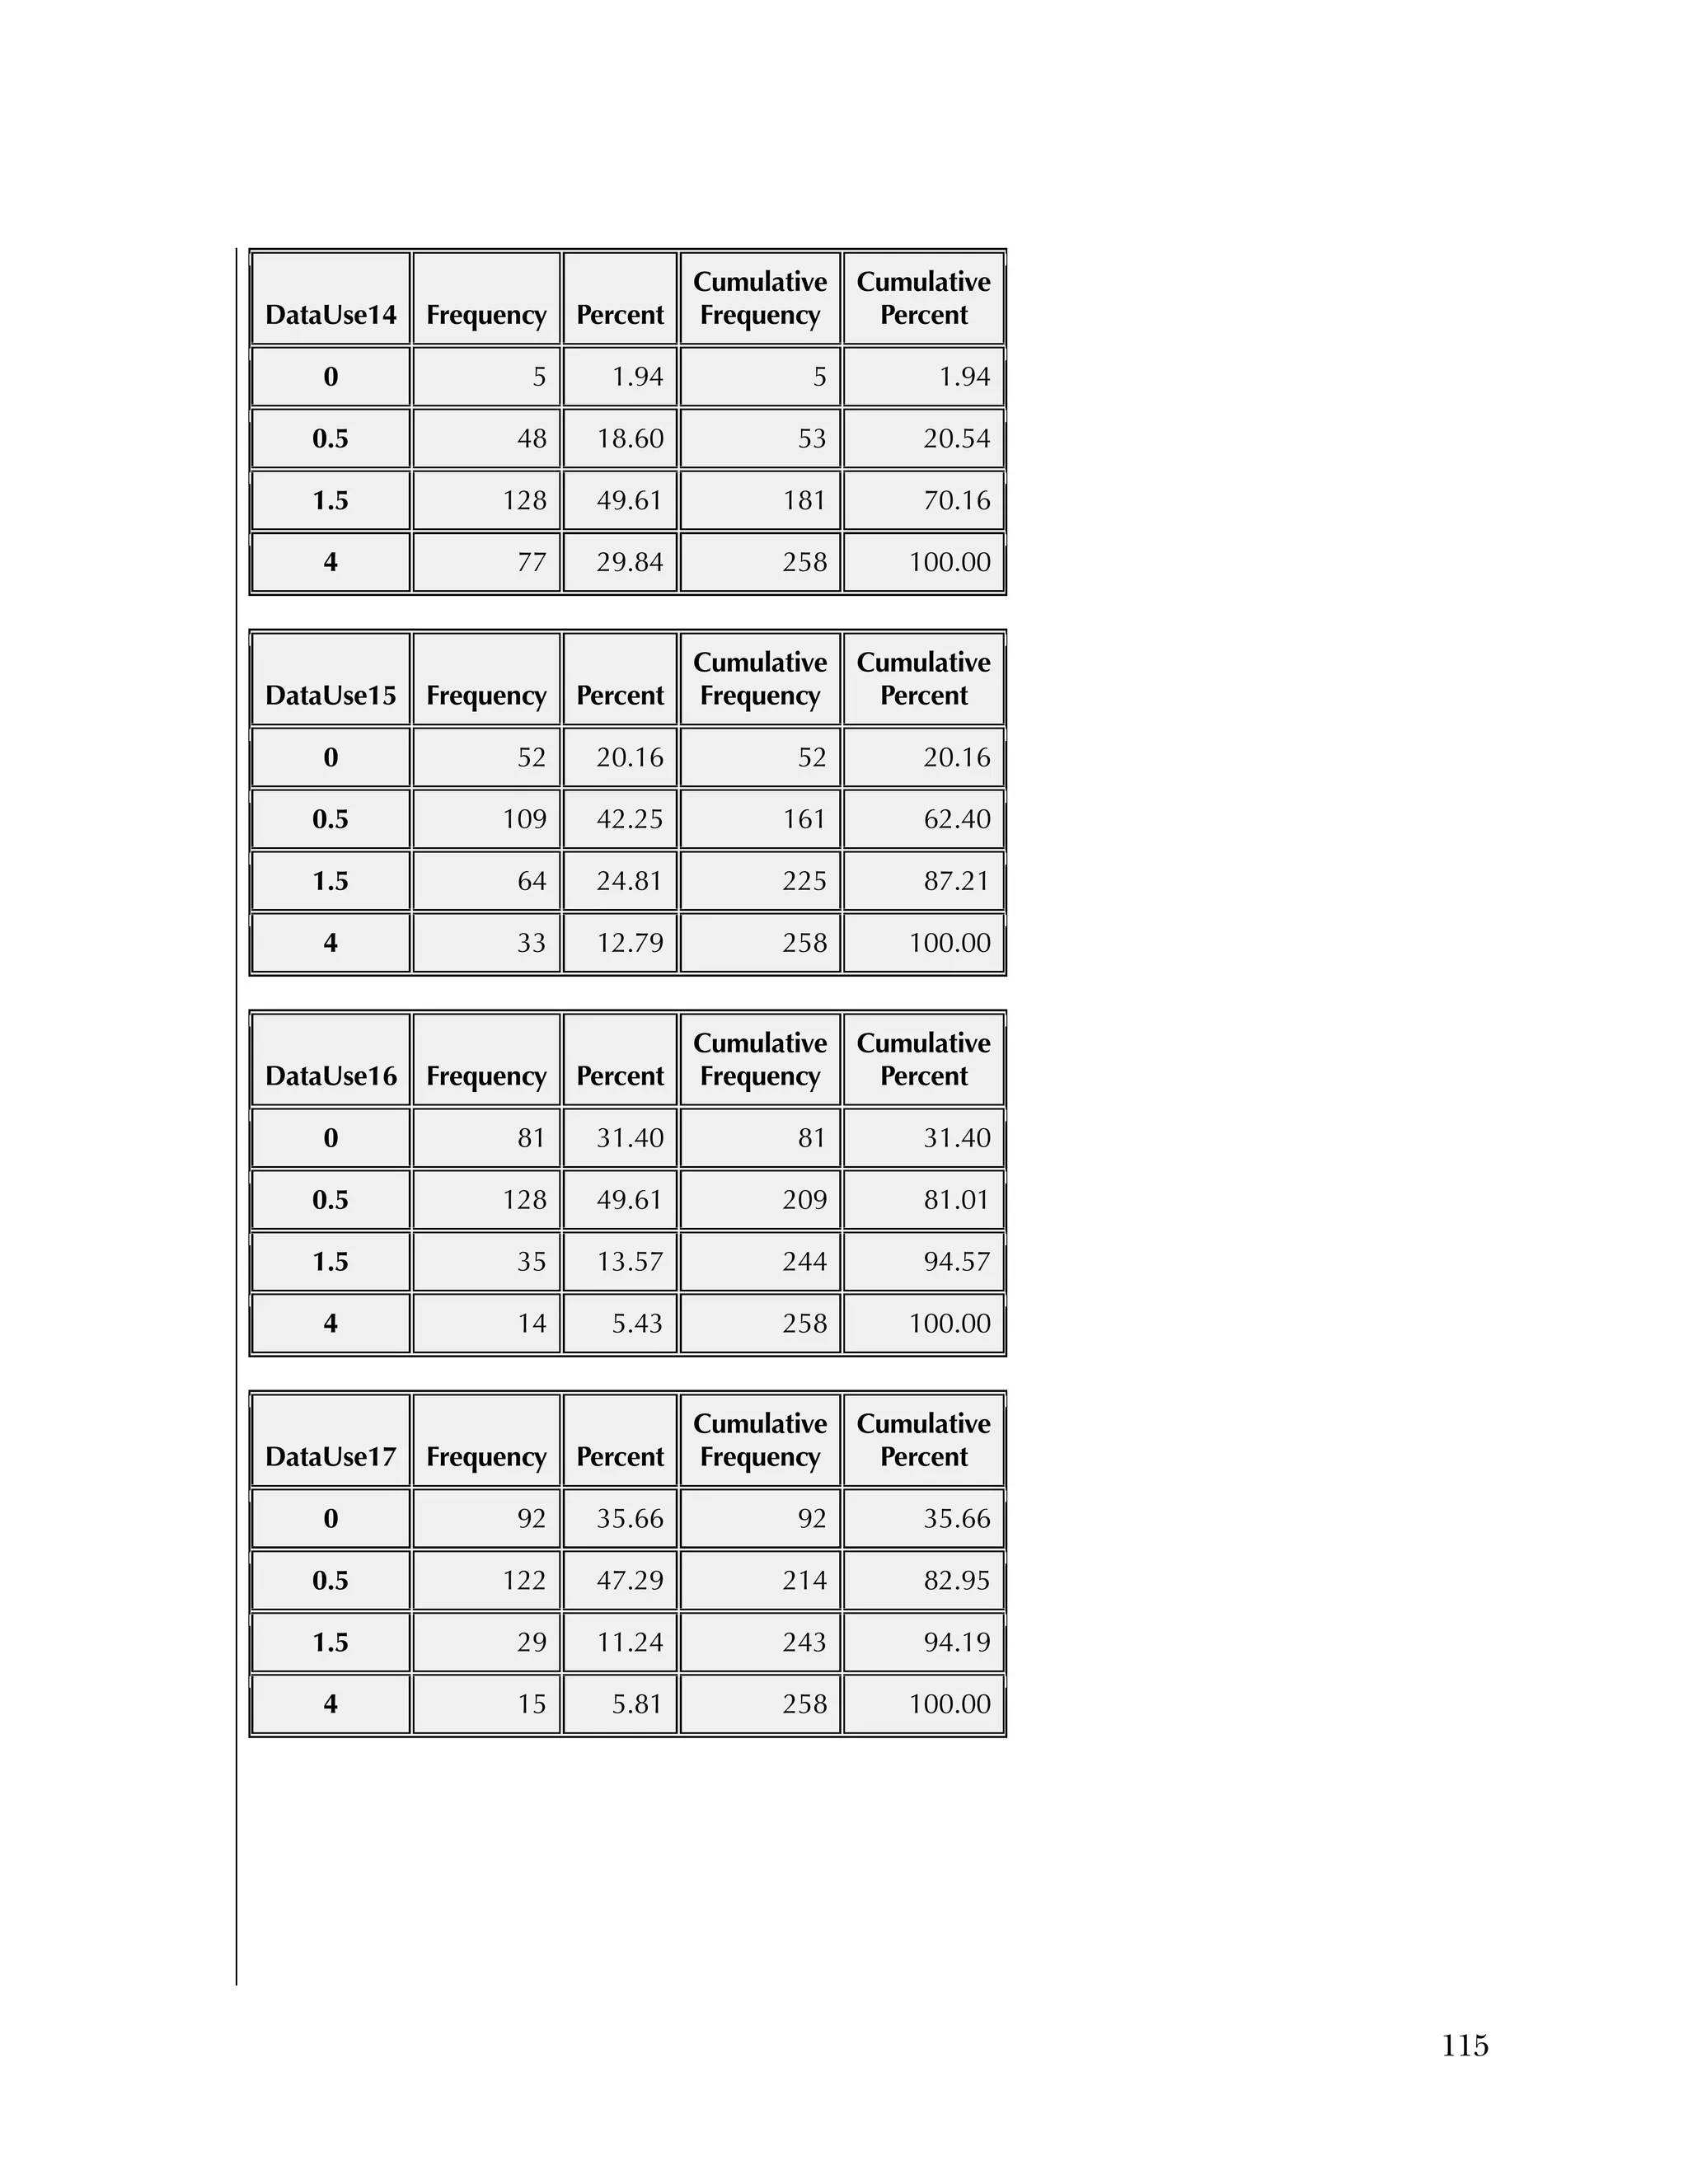
The 16 Data Use questions in the Attitudes & Beliefs questionnaire
were scored on a four-category Likert scale. The general question for
the set of items was “In the past school year how often did you [do
the following]....” In order to better reflect the spacing of categories
in the underlying time dimension, the categories were scored as
27
What Works Clearinghouse, Procedures and Standards Handbook (Version
3.0), http://ies.ed.gov/ncee/wwc/DocumentSum.aspx?sid=19.](https://image.slidesharecdn.com/40e478df-c39b-4dd7-8520-f99976663650-151230202544/75/Using-Data-98-2048.jpg)


![124
To calculate the minimum detectable effect size (MDES) associated
with a power of .8, we used Dong and Maynard’s PowerUp! tool.33
Based on these assumptions, the MDES for our teacher impact
analyses is estimated to be .42.
Table C.1. Power Analysis for Analysis of Teacher Behavior Impacts in Year 1
Model
Power Analysis
C2. Students
Table C.2 presents a power analysis for our year 2 student sample.
33
Dong, N., and Maynard, R. A. (2013). PowerUp!: A tool for calculating
minimum detectable effect sizes and sample size requirements for
experimental and quasi-experimental designs. Journal of Research on
Educational Effectiveness, 6(1), 24–67.
Covariates
Treatment indicator
3 dummy variables for blocking
Assessment pre‐score (ATTITUDES, K&S, DATAUSE)
Knowledge and Skills pre‐score
Level
2 School
1 Classroom/teacher
Assumptions
Alpha Level (α) 0.05
Two-tailed or One-tailed Test? 2
Power (1-β) 0.80
Rho2 (ICC2) 0.10
P 0.48
R1
2 0.20
R2
2 0.15
g2* 4
n (Average Sample Size for Level 1) 3
J (Average Sample Size for Level 2) 15
K (Sample Size [# of Level 3 units]) 4 Number of Level 3 units
M (Multiplier) 2.86 Computed from T1 and T2
T1 (Precision) 2.01 Determined from alpha level, given two-tailed or one-tailed test
T2 (Power) 0.85 Determined from given power level
MDES 0.421
Proportion of variance among Level 2 units (V2/(V1 + V2))
Proportion of variance in Level 1 outcome explained by Level 1 covariates
Proportion of variance in Level 2 outcome explained by Block and Level 2
Comments
Proportion of Level 2 units randomized to treatment: JT / (JT + JC)
Probability of a Type I error
Statistical power (1-probability of a Type II error)
Number of Level 2 covariates
Mean number of Level 1 units per Level 2 unit (harmonic mean recommended)
Minimum Detectable Effect Size
Mean number of Level 2 units per Level 3 unit (harmonic mean recommended)](https://image.slidesharecdn.com/40e478df-c39b-4dd7-8520-f99976663650-151230202544/75/Using-Data-128-2048.jpg)

![126
Power Analysis
Assumptions
Alpha Level (α) 0.05
Two-tailed or One-tailed Test? 2
Power (1-β) 0.80
Rho2 (ICC2) 0.10
P 0.51
R1
2 0.20
R2
2 0.50
g2* 4
n (Average Sample Size for Level 1) 174
J (Average Sample Size for Level 2) 15
K (Sample Size [# of Level 3 units]) 4 Number of Level 3 units
M (Multiplier) 2.86 Computed from T1 and T2
T1 (Precision) 2.01 Determined from alpha level, given two-tailed or one-tailed test
T2 (Power) 0.85 Determined from given power level
MDES 0.173
Number of Level 2 covariates
Mean number of Level 1 units per Level 2 unit (harmonic mean recommended)
Minimum Detectable Effect Size
Mean number of Level 2 units per Level 3 unit (harmonic mean recommended)
Proportion of variance among Level 2 units (V2/(V1 + V2))
Proportion of variance in Level 1 outcome explained by Level 1 covariates
Proportion of variance in Level 2 outcome explained by Block and Level 2
covariates
Comments
Proportion of Level 2 units randomized to treatment: JT / (JT + JC)
Probability of a Type I error
Statistical power (1-probability of a Type II error)](https://image.slidesharecdn.com/40e478df-c39b-4dd7-8520-f99976663650-151230202544/75/Using-Data-130-2048.jpg)


![Data driven ppt_presentation[1]](https://cdn.slidesharecdn.com/ss_thumbnails/datadrivenpptpresentation1-100710102551-phpapp02-thumbnail.jpg?width=640&height=640&fit=bounds)


