Download to read offline


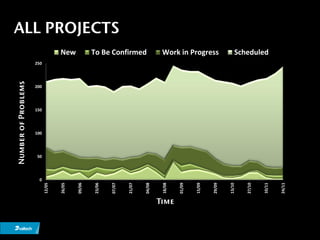
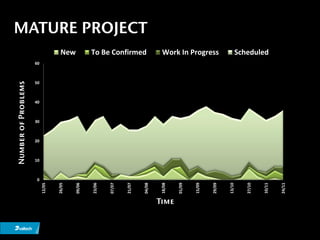
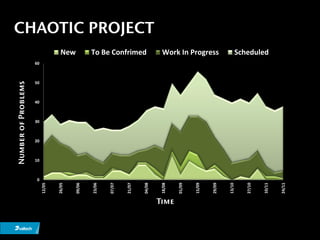
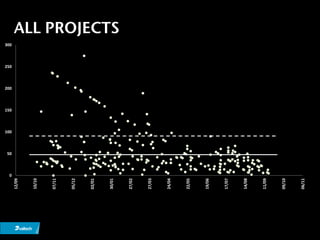
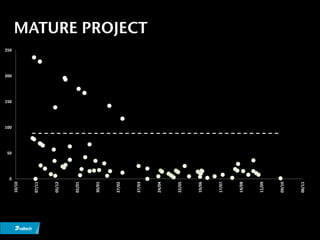
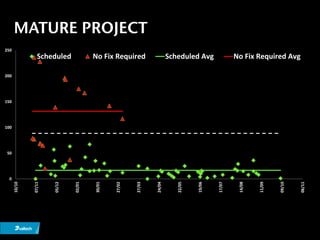
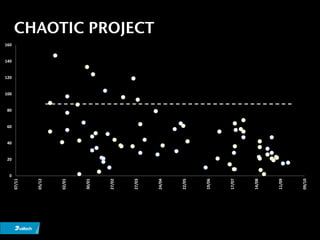
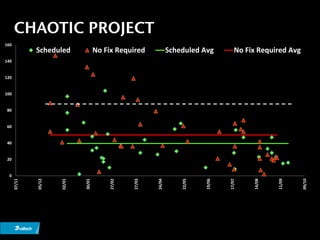


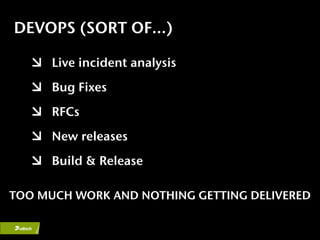


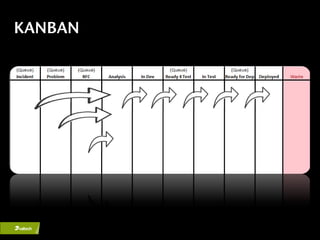
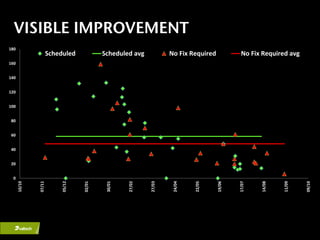


This document discusses using Cumulative Flow Diagrams (CFD), Statistical Process Control (SPC) charts, and Kanban techniques on 50 UK government IT projects with 50 development teams serving 50 different customers across 7 separate locations. CFDs show the flow of work over time for all projects and reveal patterns between mature and chaotic projects. SPC charts compare scheduled work to unplanned work for all, mature, and chaotic projects over time. Implementing Kanban techniques like limiting work in progress and visualizing the flow of work resulted in improved visibility and delivery compared to the previous "sort of DevOps" approach.