This presentation was for the Crisis Communications conference in Brisbane in March 2011 sponsored by the Eidos Institute and Queensland University of Technology. The presentation covers the use of Ushahidi and Crowdmap during the Queensland floods in January 2011 for crowdsourced reports by the Australian Broadcasting Corporation.
Social Media, Open Data and Bushfire ConnectBGTT_SYD
The last year has seen a rapid take-up of social media, crowdsourcing and mapping tools such as Twitter, Facebook and Ushahidi in managing disasters in Queensland, Victoria, Christchurch and Japan.
Now that the use of social media for emergency management is becoming more or less ‘established’ and even accepted in the Response and Recovery phases, the next question is how this can be extended into Planning and Preparation, to strengthen community resilience?
Attendees will see actual examples from e.g. the RFS and community initiatives such as Random Hack of Kindness and BushfireConnect, and learn how to best harness the power of crowdsourced crisis information to empower both citizens and responders.
Connector Corner: Automate dynamic content and events by pushing a buttonDianaGray10
Here is something new! In our next Connector Corner webinar, we will demonstrate how you can use a single workflow to:
Create a campaign using Mailchimp with merge tags/fields
Send an interactive Slack channel message (using buttons)
Have the message received by managers and peers along with a test email for review
But there’s more:
In a second workflow supporting the same use case, you’ll see:
Your campaign sent to target colleagues for approval
If the “Approve” button is clicked, a Jira/Zendesk ticket is created for the marketing design team
But—if the “Reject” button is pushed, colleagues will be alerted via Slack message
Join us to learn more about this new, human-in-the-loop capability, brought to you by Integration Service connectors.
And...
Speakers:
Akshay Agnihotri, Product Manager
Charlie Greenberg, Host
GraphRAG is All You need? LLM & Knowledge GraphGuy Korland
Guy Korland, CEO and Co-founder of FalkorDB, will review two articles on the integration of language models with knowledge graphs.
1. Unifying Large Language Models and Knowledge Graphs: A Roadmap.
https://arxiv.org/abs/2306.08302
2. Microsoft Research's GraphRAG paper and a review paper on various uses of knowledge graphs:
https://www.microsoft.com/en-us/research/blog/graphrag-unlocking-llm-discovery-on-narrative-private-data/
JMeter webinar - integration with InfluxDB and GrafanaRTTS
Watch this recorded webinar about real-time monitoring of application performance. See how to integrate Apache JMeter, the open-source leader in performance testing, with InfluxDB, the open-source time-series database, and Grafana, the open-source analytics and visualization application.
In this webinar, we will review the benefits of leveraging InfluxDB and Grafana when executing load tests and demonstrate how these tools are used to visualize performance metrics.
Length: 30 minutes
Session Overview
-------------------------------------------
During this webinar, we will cover the following topics while demonstrating the integrations of JMeter, InfluxDB and Grafana:
- What out-of-the-box solutions are available for real-time monitoring JMeter tests?
- What are the benefits of integrating InfluxDB and Grafana into the load testing stack?
- Which features are provided by Grafana?
- Demonstration of InfluxDB and Grafana using a practice web application
To view the webinar recording, go to:
https://www.rttsweb.com/jmeter-integration-webinar
Key Trends Shaping the Future of Infrastructure.pdfCheryl Hung
Keynote at DIGIT West Expo, Glasgow on 29 May 2024.
Cheryl Hung, ochery.com
Sr Director, Infrastructure Ecosystem, Arm.
The key trends across hardware, cloud and open-source; exploring how these areas are likely to mature and develop over the short and long-term, and then considering how organisations can position themselves to adapt and thrive.
Slack (or Teams) Automation for Bonterra Impact Management (fka Social Soluti...Jeffrey Haguewood
Sidekick Solutions uses Bonterra Impact Management (fka Social Solutions Apricot) and automation solutions to integrate data for business workflows.
We believe integration and automation are essential to user experience and the promise of efficient work through technology. Automation is the critical ingredient to realizing that full vision. We develop integration products and services for Bonterra Case Management software to support the deployment of automations for a variety of use cases.
This video focuses on the notifications, alerts, and approval requests using Slack for Bonterra Impact Management. The solutions covered in this webinar can also be deployed for Microsoft Teams.
Interested in deploying notification automations for Bonterra Impact Management? Contact us at sales@sidekicksolutionsllc.com to discuss next steps.
Elevating Tactical DDD Patterns Through Object CalisthenicsDorra BARTAGUIZ
After immersing yourself in the blue book and its red counterpart, attending DDD-focused conferences, and applying tactical patterns, you're left with a crucial question: How do I ensure my design is effective? Tactical patterns within Domain-Driven Design (DDD) serve as guiding principles for creating clear and manageable domain models. However, achieving success with these patterns requires additional guidance. Interestingly, we've observed that a set of constraints initially designed for training purposes remarkably aligns with effective pattern implementation, offering a more ‘mechanical’ approach. Let's explore together how Object Calisthenics can elevate the design of your tactical DDD patterns, offering concrete help for those venturing into DDD for the first time!
LF Energy Webinar: Electrical Grid Modelling and Simulation Through PowSyBl -...DanBrown980551
Do you want to learn how to model and simulate an electrical network from scratch in under an hour?
Then welcome to this PowSyBl workshop, hosted by Rte, the French Transmission System Operator (TSO)!
During the webinar, you will discover the PowSyBl ecosystem as well as handle and study an electrical network through an interactive Python notebook.
PowSyBl is an open source project hosted by LF Energy, which offers a comprehensive set of features for electrical grid modelling and simulation. Among other advanced features, PowSyBl provides:
- A fully editable and extendable library for grid component modelling;
- Visualization tools to display your network;
- Grid simulation tools, such as power flows, security analyses (with or without remedial actions) and sensitivity analyses;
The framework is mostly written in Java, with a Python binding so that Python developers can access PowSyBl functionalities as well.
What you will learn during the webinar:
- For beginners: discover PowSyBl's functionalities through a quick general presentation and the notebook, without needing any expert coding skills;
- For advanced developers: master the skills to efficiently apply PowSyBl functionalities to your real-world scenarios.
2024 State of Marketing Report – by HubspotMarius Sescu
https://www.hubspot.com/state-of-marketing
· Scaling relationships and proving ROI
· Social media is the place for search, sales, and service
· Authentic influencer partnerships fuel brand growth
· The strongest connections happen via call, click, chat, and camera.
· Time saved with AI leads to more creative work
· Seeking: A single source of truth
· TLDR; Get on social, try AI, and align your systems.
· More human marketing, powered by robots
ChatGPT is a revolutionary addition to the world since its introduction in 2022. A big shift in the sector of information gathering and processing happened because of this chatbot. What is the story of ChatGPT? How is the bot responding to prompts and generating contents? Swipe through these slides prepared by Expeed Software, a web development company regarding the development and technical intricacies of ChatGPT!
Product Design Trends in 2024 | Teenage EngineeringsPixeldarts
The realm of product design is a constantly changing environment where technology and style intersect. Every year introduces fresh challenges and exciting trends that mold the future of this captivating art form. In this piece, we delve into the significant trends set to influence the look and functionality of product design in the year 2024.
How Race, Age and Gender Shape Attitudes Towards Mental HealthThinkNow
Mental health has been in the news quite a bit lately. Dozens of U.S. states are currently suing Meta for contributing to the youth mental health crisis by inserting addictive features into their products, while the U.S. Surgeon General is touring the nation to bring awareness to the growing epidemic of loneliness and isolation. The country has endured periods of low national morale, such as in the 1970s when high inflation and the energy crisis worsened public sentiment following the Vietnam War. The current mood, however, feels different. Gallup recently reported that national mental health is at an all-time low, with few bright spots to lift spirits.
To better understand how Americans are feeling and their attitudes towards mental health in general, ThinkNow conducted a nationally representative quantitative survey of 1,500 respondents and found some interesting differences among ethnic, age and gender groups.
Technology
For example, 52% agree that technology and social media have a negative impact on mental health, but when broken out by race, 61% of Whites felt technology had a negative effect, and only 48% of Hispanics thought it did.
While technology has helped us keep in touch with friends and family in faraway places, it appears to have degraded our ability to connect in person. Staying connected online is a double-edged sword since the same news feed that brings us pictures of the grandkids and fluffy kittens also feeds us news about the wars in Israel and Ukraine, the dysfunction in Washington, the latest mass shooting and the climate crisis.
Hispanics may have a built-in defense against the isolation technology breeds, owing to their large, multigenerational households, strong social support systems, and tendency to use social media to stay connected with relatives abroad.
Age and Gender
When asked how individuals rate their mental health, men rate it higher than women by 11 percentage points, and Baby Boomers rank it highest at 83%, saying it’s good or excellent vs. 57% of Gen Z saying the same.
Gen Z spends the most amount of time on social media, so the notion that social media negatively affects mental health appears to be correlated. Unfortunately, Gen Z is also the generation that’s least comfortable discussing mental health concerns with healthcare professionals. Only 40% of them state they’re comfortable discussing their issues with a professional compared to 60% of Millennials and 65% of Boomers.
Race Affects Attitudes
As seen in previous research conducted by ThinkNow, Asian Americans lag other groups when it comes to awareness of mental health issues. Twenty-four percent of Asian Americans believe that having a mental health issue is a sign of weakness compared to the 16% average for all groups. Asians are also considerably less likely to be aware of mental health services in their communities (42% vs. 55%) and most likely to seek out information on social media (51% vs. 35%).
AI Trends in Creative Operations 2024 by Artwork Flow.pdfmarketingartwork
This article is all about what AI trends will emerge in the field of creative operations in 2024. All the marketers and brand builders should be aware of these trends for their further use and save themselves some time!
A report by thenetworkone and Kurio.
The contributing experts and agencies are (in an alphabetical order): Sylwia Rytel, Social Media Supervisor, 180heartbeats + JUNG v MATT (PL), Sharlene Jenner, Vice President - Director of Engagement Strategy, Abelson Taylor (USA), Alex Casanovas, Digital Director, Atrevia (ES), Dora Beilin, Senior Social Strategist, Barrett Hoffher (USA), Min Seo, Campaign Director, Brand New Agency (KR), Deshé M. Gully, Associate Strategist, Day One Agency (USA), Francesca Trevisan, Strategist, Different (IT), Trevor Crossman, CX and Digital Transformation Director; Olivia Hussey, Strategic Planner; Simi Srinarula, Social Media Manager, The Hallway (AUS), James Hebbert, Managing Director, Hylink (CN / UK), Mundy Álvarez, Planning Director; Pedro Rojas, Social Media Manager; Pancho González, CCO, Inbrax (CH), Oana Oprea, Head of Digital Planning, Jam Session Agency (RO), Amy Bottrill, Social Account Director, Launch (UK), Gaby Arriaga, Founder, Leonardo1452 (MX), Shantesh S Row, Creative Director, Liwa (UAE), Rajesh Mehta, Chief Strategy Officer; Dhruv Gaur, Digital Planning Lead; Leonie Mergulhao, Account Supervisor - Social Media & PR, Medulla (IN), Aurelija Plioplytė, Head of Digital & Social, Not Perfect (LI), Daiana Khaidargaliyeva, Account Manager, Osaka Labs (UK / USA), Stefanie Söhnchen, Vice President Digital, PIABO Communications (DE), Elisabeth Winiartati, Managing Consultant, Head of Global Integrated Communications; Lydia Aprina, Account Manager, Integrated Marketing and Communications; Nita Prabowo, Account Manager, Integrated Marketing and Communications; Okhi, Web Developer, PNTR Group (ID), Kei Obusan, Insights Director; Daffi Ranandi, Insights Manager, Radarr (SG), Gautam Reghunath, Co-founder & CEO, Talented (IN), Donagh Humphreys, Head of Social and Digital Innovation, THINKHOUSE (IRE), Sarah Yim, Strategy Director, Zulu Alpha Kilo (CA).
Trends In Paid Search: Navigating The Digital Landscape In 2024Search Engine Journal
The search marketing landscape is evolving rapidly with new technologies, and professionals, like you, rely on innovative paid search strategies to meet changing demands.
It’s important that you’re ready to implement new strategies in 2024.
Check this out and learn the top trends in paid search advertising that are expected to gain traction, so you can drive higher ROI more efficiently in 2024.
You’ll learn:
- The latest trends in AI and automation, and what this means for an evolving paid search ecosystem.
- New developments in privacy and data regulation.
- Emerging ad formats that are expected to make an impact next year.
Watch Sreekant Lanka from iQuanti and Irina Klein from OneMain Financial as they dive into the future of paid search and explore the trends, strategies, and technologies that will shape the search marketing landscape.
If you’re looking to assess your paid search strategy and design an industry-aligned plan for 2024, then this webinar is for you.
5 Public speaking tips from TED - Visualized summarySpeakerHub
From their humble beginnings in 1984, TED has grown into the world’s most powerful amplifier for speakers and thought-leaders to share their ideas. They have over 2,400 filmed talks (not including the 30,000+ TEDx videos) freely available online, and have hosted over 17,500 events around the world.
With over one billion views in a year, it’s no wonder that so many speakers are looking to TED for ideas on how to share their message more effectively.
The article “5 Public-Speaking Tips TED Gives Its Speakers”, by Carmine Gallo for Forbes, gives speakers five practical ways to connect with their audience, and effectively share their ideas on stage.
Whether you are gearing up to get on a TED stage yourself, or just want to master the skills that so many of their speakers possess, these tips and quotes from Chris Anderson, the TED Talks Curator, will encourage you to make the most impactful impression on your audience.
See the full article and more summaries like this on SpeakerHub here: https://speakerhub.com/blog/5-presentation-tips-ted-gives-its-speakers
See the original article on Forbes here:
http://www.forbes.com/forbes/welcome/?toURL=http://www.forbes.com/sites/carminegallo/2016/05/06/5-public-speaking-tips-ted-gives-its-speakers/&refURL=&referrer=#5c07a8221d9b
ChatGPT and the Future of Work - Clark Boyd Clark Boyd
Everyone is in agreement that ChatGPT (and other generative AI tools) will shape the future of work. Yet there is little consensus on exactly how, when, and to what extent this technology will change our world.
Businesses that extract maximum value from ChatGPT will use it as a collaborative tool for everything from brainstorming to technical maintenance.
For individuals, now is the time to pinpoint the skills the future professional will need to thrive in the AI age.
Check out this presentation to understand what ChatGPT is, how it will shape the future of work, and how you can prepare to take advantage.
A brief introduction to DataScience with explaining of the concepts, algorithms, machine learning, supervised and unsupervised learning, clustering, statistics, data preprocessing, real-world applications etc.
It's part of a Data Science Corner Campaign where I will be discussing the fundamentals of DataScience, AIML, Statistics etc.
Time Management & Productivity - Best PracticesVit Horky
Here's my presentation on by proven best practices how to manage your work time effectively and how to improve your productivity. It includes practical tips and how to use tools such as Slack, Google Apps, Hubspot, Google Calendar, Gmail and others.
The six step guide to practical project managementMindGenius
The six step guide to practical project management
If you think managing projects is too difficult, think again.
We’ve stripped back project management processes to the
basics – to make it quicker and easier, without sacrificing
the vital ingredients for success.
“If you’re looking for some real-world guidance, then The Six Step Guide to Practical Project Management will help.”
Dr Andrew Makar, Tactical Project Management
5. Reports during crisis From Public Power outages Property damage Flood levels Roads closed/impassable Bridges closed/impassable Where to get fuel Photos of floods From ABC staff Evacuation centres Police stations Hospitals and health centres Sandbag locations Water contamination reports BOM weather advice
6. Reports during recovery From Public Emergency accommodation Volunteers wanted and available Food and drink for volunteers Clean up supplies Fuel supplies Recovery equipment Pets lost and found From ABC staff Centrelink recovery centres Community recovery centres Free vaccinations Bulk bin locations Tipping stations Schools clean up Pet emergency accommodation
9. Editorial Challenges Verified vs Unverified events Trusted sources attribution Publishing personal details Business names and references Requests for help and information
10. Next steps Broader strategy for emergency digital services Integrated mapping strategy Collaboration and partnerships Sourcing data in suitable ‘map friendly’ formats Building culture of participation
Editor's Notes
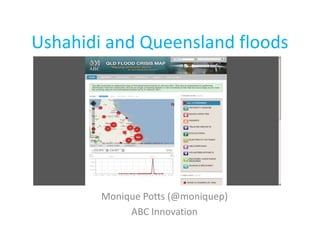
My presentation today is about a crowdsourcing mapping trial which the ABC did during the Queensland flood using a platform called Ushahidi. Ushahidi is an open source crowdsourcing platform that has been used around the world during crises and emergencies during the past few years to gather public reports and display them on a map based interface.While not strictly social media it was quite a new and different way for the ABC to engage with and seek input from our audiences during a crisis.I work for a team called strategic development team in ABC Innovation and part of our brief is to explore new platforms and technologies and look at how they might be of value across the ABC and to our audiences. We became interested in Ushahidi as a platform because it seemed to bring together a number of trends emerging in media including citizen journalism, hyperlocal information and real time mapping. I’d like to start off by giving you a bit of background on the technology and platform and then talk about our experience in using it during the Queensland floods and discuss some of the opportunities and challenges we felt is presented.
We started talk to the team at Ushahidi in early 2010 and also to teams from other media organisations who were trialling the platform for covering events. Al Jazeera were the first large media organisation to use it during the conflict in Gaza in 2009 when it was difficult to get journalists in and out of the region and reports from on the ground were very scarce. The BBC did a few trials during the spate of Tube strikes in London last year where people could report from their Tube station whether trains were running or not.
What we ended up deciding to do was to run a non emergency trial of the platform in January and collect reports of feral animal sightings from across Australia for the month of January. We called the trial Feral Month. We actually got quite an amazing response to this project too with over 1600 reports being submitted over the month.Anyway I came back to work distubingly early in January to launch this site on the 3rd of January. On the 4 of January when it became apparent that the floods were going to be of a scale we hadn’t seen for some time Local Radio came to us and asked to launch an implementation for the floods. Luckily we were able to get the site up pretty quickly using a hosted version of the platform called Crowdmap and it took a few days to get it up and running.
I’ll wanted to spend a few minutes now showing you the map and how it works for those who haven’t seen it. The way it works is you set up a series of categories which you can see here on the right hand side and when reports are submitted they are added to one or more of these categories. So you can see here some of the categories we used were Property Damage, Road Affected, Hazards, Evacuations, Electricity Outages. Then coming down we have Help/Services which you can drill down into to see Relief Centres/Emergency Accomodation, Hospitals, Police stations and other Help/Services. The last three categories we added during the recovery which were Volunteer Efforts, Recovery Assistance Required and Schools Recovery.You can see if I select one of these categories I can drill down and view the actual reports in each category in different regions. So for example if I go into Hazards and Contaminated Drinking Water you can see there are 5 reports in this region which I can drill down to view the individual reports. If I go to Stanthorpe report it saysAs a result of flooding issues at water treatment plants, residents connected to the Stanthorpe, Wallangarra and Killarney water supplies have been requested to boil any water used for consumption. Each report has a time stamp and a stamp on it to indicate whether it is verified or unverified report. You can see that this report has been verified and is marked as being from a trusted source. You can also see on the smaller map reports from surrounding areas which are mainly road closure information for Stanthorpe
This table just gives you an overview of the types of reports coming in during the crisis to the map from the public including power outages, property damage, road and bridge closures where to get fuel and photos of the floodsBefore we launched ABC staff had added police stations and hospitals and supplemented the public reports by adding locations for evacuation centres, sandbag locations, water contamination reports and Bureau of Meteorology weather advice
During the recovery period reports from the public were being added about emergency accommodation, volunteers wanted and available, clean up supplies available, food and drink for volunteers and lost and found pets.From the ABC side we were adding details of Centrelink recovery centres, Community recovery centres, free vaccinations, bulk bin locations, tipping stations, school clean ups and emergency pet accommodation
Over the 24 days of the crisis and recover we had a lot of traffic to the site with 230,000 unique visitors and 1,500 reports. We felt it reflected the large demand during the crisis for real time data and mapped data from the audience. We found there were a number of audiences for this map people affected in the region but also family and friends watching events from afar and the wider general public.
Before I finish off I just wanted to talk a bit about the purpose and role of the map and some of the editorial issues that we faced during the trial. We talked a lot during the trial about the purpose of the map. There were some people in the team that felt we should be just focusing purely on a crowdsourcing approach where we were only displaying reports from the public. Others felt we should be trying to incorporate more layers to create a more comprehensive data map that showed road closures, emergency services reports, innundation and weather patterns. In the end I think the model we used would have to be called supplemented crowdsourcing where we used the resources of the ABC to call out for reports from the public but also supplemented this heavily with reports being added by ABC staff and moderators. In a way the different information could complement each other by being displayed side by side on the same map. You could see the official reports and well as the public reports alongside each other for your area.
Just to go onto some of the editorial challenges which I think probably relate quite closely to some of the challenges of social media more generally during emergencies One of our main challenges which I mentioned at the beginning was clearly indicating which reports were verified and unverified. Originally we were thinking about displaying these reports on different layers on the map with verified reports from the ABC and emergency services on one layer and publicly contributed reports in a separate layer. We tried to verify audience reports where we could. In general the feedback we had overall from the trial was that people were able to identify pretty easily the status of the different reports and treated them differently accordingly.We did realise the importance of attribution for trusted sources and were interested in looking at ways were reports from trusted sources could be automatically be published to the map.We found particularly during the recovery stage we had to publish some personal details of people wanting and offering help to facilitate communication during this critical time. Generally we would be very cautious about allowing people to publish their personal details on ABC online however in this case it was justified and in fact essential for the reports to be useful. We later removed personal details but left people’s twitter handles. Similarly with business names where we wouldn’t usually under our editorial guidelines be able to publish business names and addresses as it could be seen as an endorsement we did allow reports from businesses offering supplies and support on the map.And lastly we had to be very careful to try to explain the purpose of the map so that people didn’t think we could assist directly during the crisis but that we could quickly pass on the details of where people could get help.
The trial we felt was very successful is showing us the strengths and weaknesses of this platform and this approach to crowdsourcing public reports during an emergency. We did realise though that because it was so resource intensive it is probably something that we could only role out for quite significant crisis events.We wanted to look at it in terms of a broader cross divisional strategy for emergency services coverage and develop a more integrated strategy for mapping crisis events. We will also be looking soon at mobile services for emergency coverage to be integrated into our current mobile offerings.We realised that in order to successfully provide the public with the near to real time mapping information they seem to want we will need to work closely in partnership with other organisations and agencies. During the trial we were adding a lot of the reports from agencies manually but it would be much better if we could use structured data and metadata to aggregate reports in one place for people. These official reports can then be complemented by reports from the public in the one location.Lastly I think it’s important to continue to build on this model of participation and acknowledge the value of it both within the ABC and more widely in the community.