Download to read offline
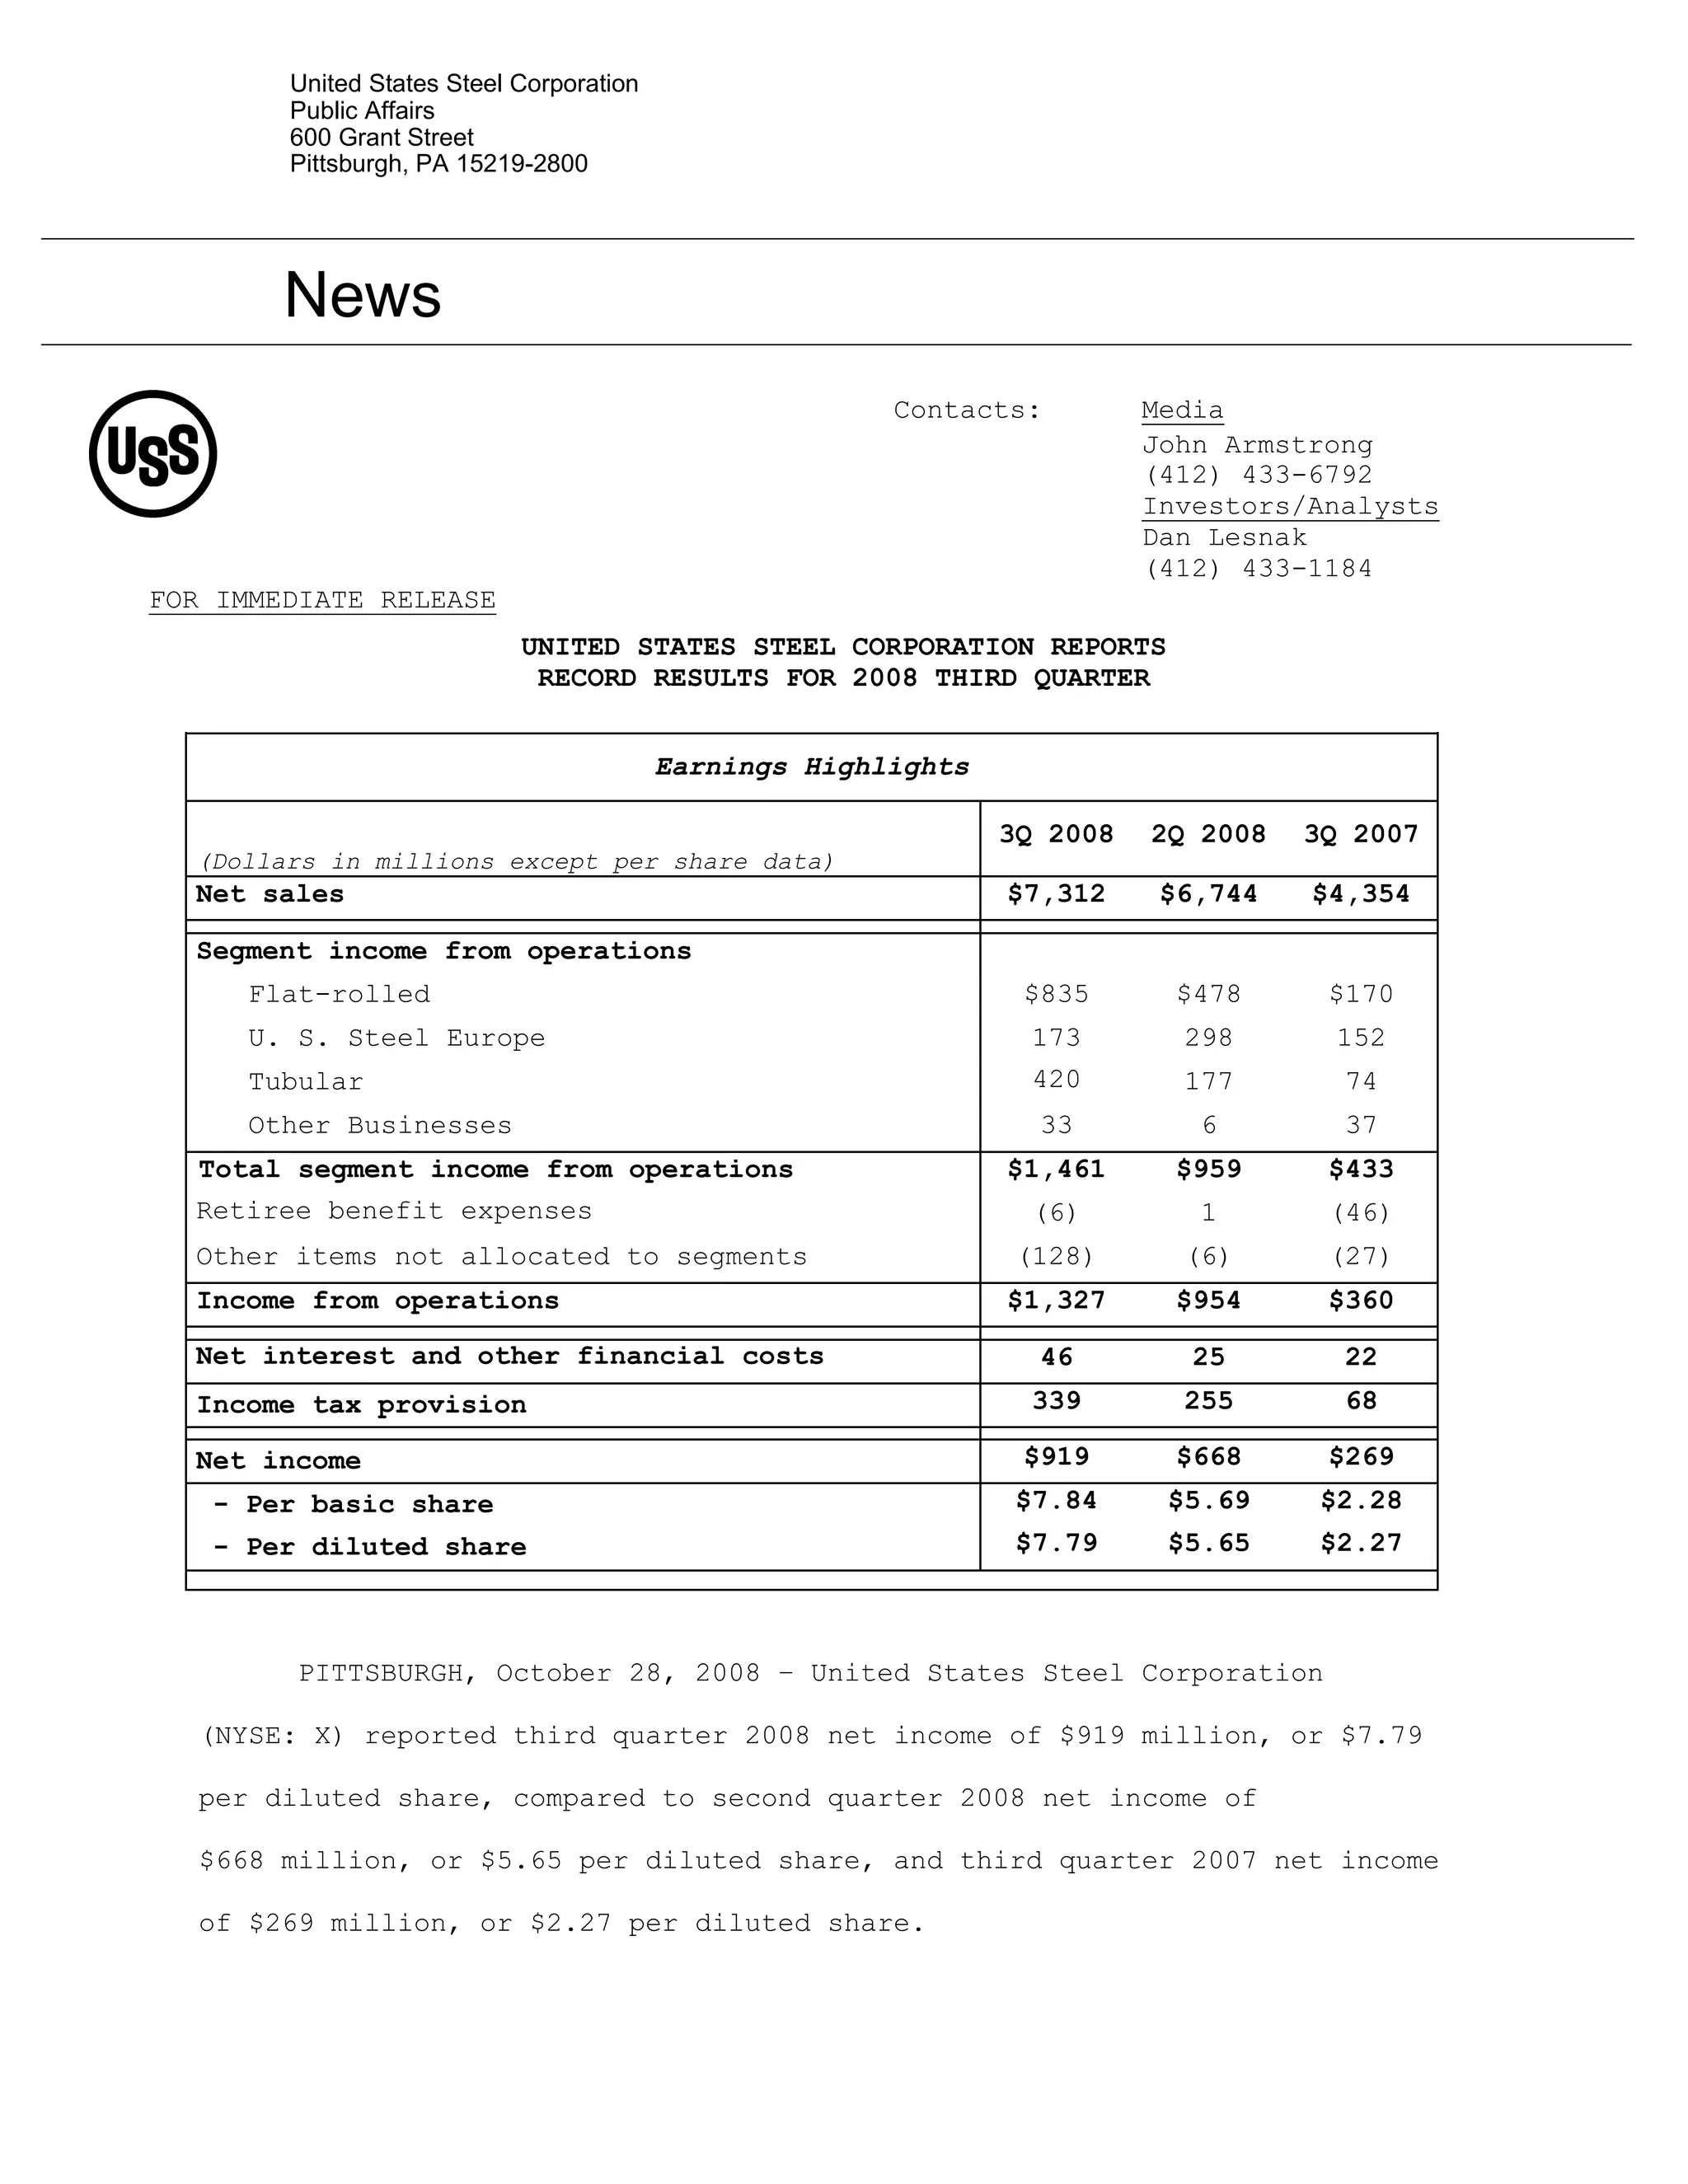
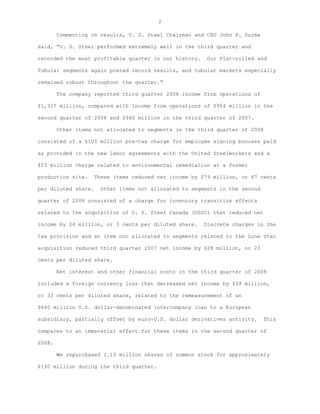
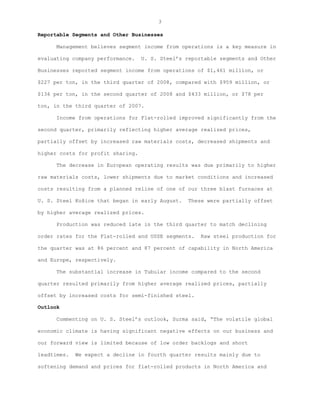
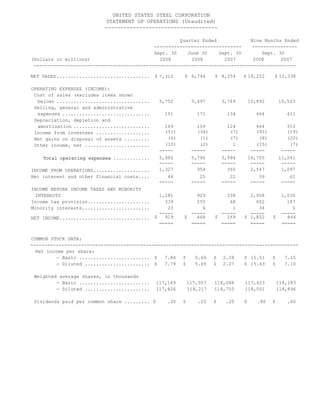
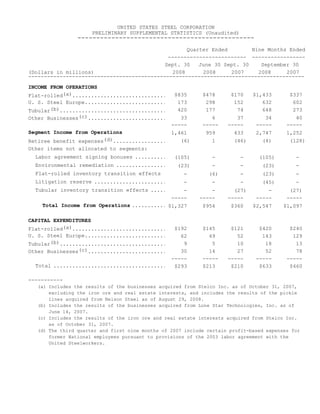
United States Steel Corporation reported record results for the third quarter of 2008 with net income of $919 million, up significantly from $668 million in the previous quarter and $269 million in the third quarter of 2007. Segment income from operations was $1,461 million, higher than the $959 million reported last quarter, driven by strong performance in the Flat-rolled and Tubular segments. However, the company expects earnings to decline in the fourth quarter due to softening demand and lower prices.


