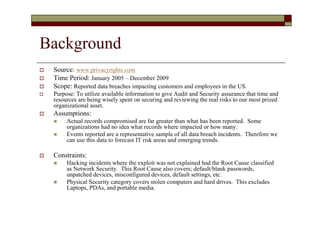
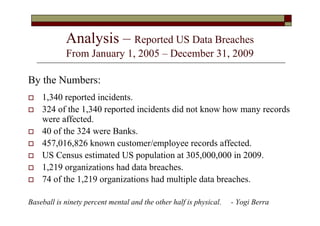
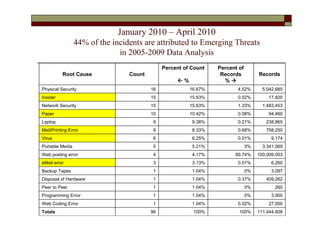
This document analyzes reported data breaches in the United States from 2005 to 2009 based on information from privacyrights.com. Some key findings include:
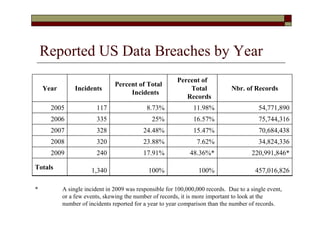
- There were 1,340 reported incidents affecting over 457 million records.
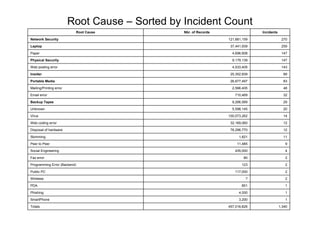
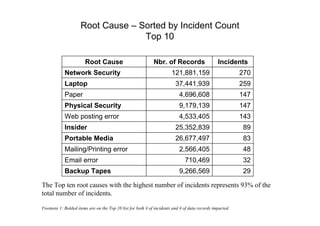
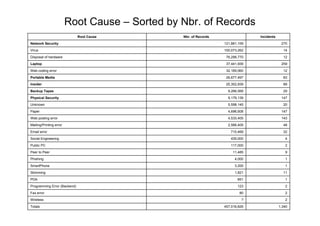
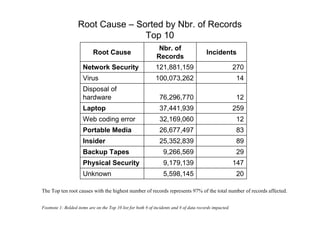
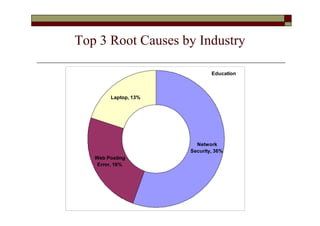
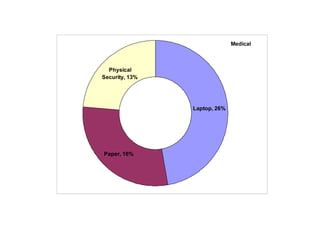
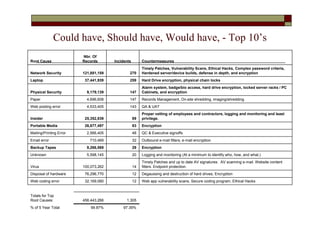
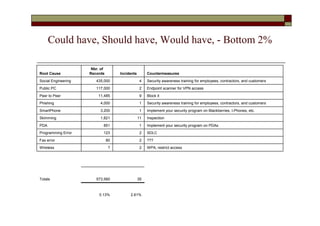
- The top root causes were network security (121.88 million records), viruses (100.07 million), and disposal of hardware (76.30 million).
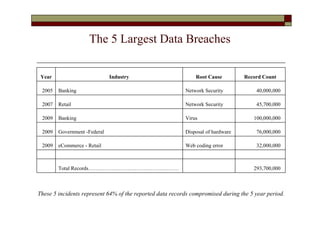
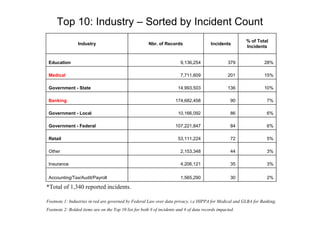
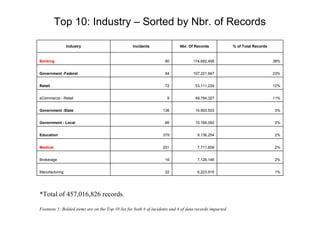
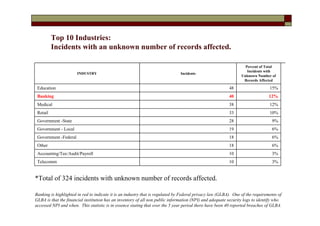
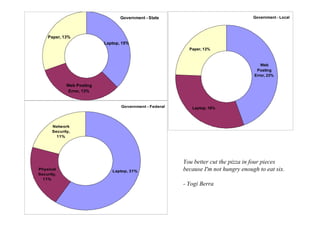
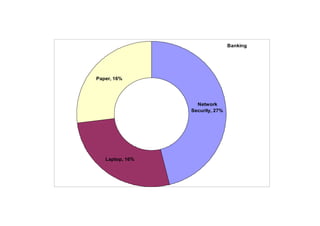
- The top industries impacted were banking (174.68 million records), government (federal and state combined over 200 million records), and retail (53.11 million records).
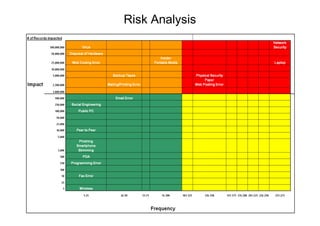
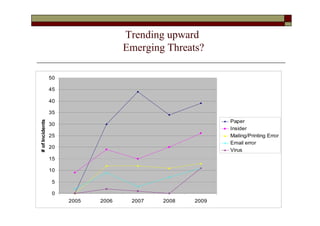
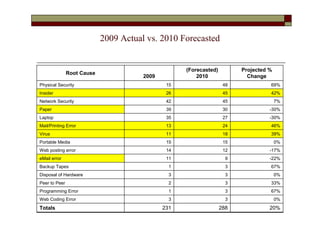
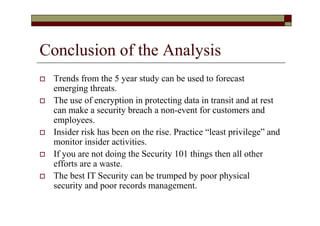
- Emerging threats like physical security, insiders, and viruses showed an increasing trend from 2009 to early 2010.