Understanding Data Analytics: Concepts, Types, and Use Cases
This presentation helps you understand data analytics from the ground up. It covers core concepts, different types of data analytics, common tools, and real-world use cases for students and professionals.
What is DataAnalytics
Data Analytics is the process of examining data to find useful information and insights.
It helps businesses and organizations understand what is happening and make better decisions.
Instead of guessing, decisions are made based on data.
What happened?
01 02 03
Why did it happen? What should we do next?
Data Analytics answers questions like:
3.
Simple Example ofData Analytics
An online shopping company collects data such as:
• Products sold
• Customer location
• Purchase time
• Payment method
Using Data Analytics, the company:
• Finds best-selling products
• Understands why sales increase or decrease
• Identifies customer buying patterns
• Plans discounts and offers
• This helps increase sales and customer satisfaction
4.
Why Data Analyticsis Important
• Companies generate large amounts of data every
day
• Data Analytics converts raw data into useful
insights
• It improves decision-making accuracy
• It saves time, money, and resources
Used in almost every industry
5.
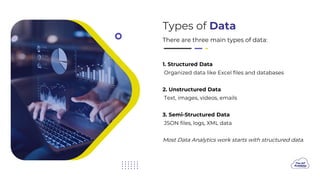
Types of Data
Thereare three main types of data:
1. Structured Data
Organized data like Excel files and databases
2. Unstructured Data
Text, images, videos, emails
3. Semi-Structured Data
JSON files, logs, XML data
Most Data Analytics work starts with structured data.
6.
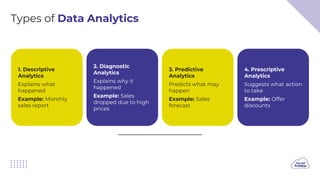
Types of DataAnalytics
1. Descriptive
Analytics
Explains what
happened
Example: Monthly
sales report
2. Diagnostic
Analytics
Explains why it
happened
Example: Sales
dropped due to high
prices
3. Predictive
Analytics
Predicts what may
happen
Example: Sales
forecast
4. Prescriptive
Analytics
Suggests what action
to take
Example: Offer
discounts
7.
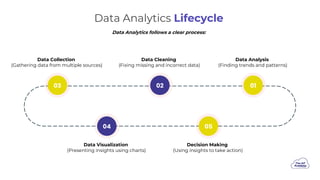
Data Analytics Lifecycle
DataAnalysis
(Finding trends and patterns)
Data Cleaning
(Fixing missing and incorrect data)
Data Collection
(Gathering data from multiple sources)
Data Visualization
(Presenting insights using charts)
Decision Making
(Using insights to take action)
02
03 01
05
04
Data Analytics follows a clear process:
8.
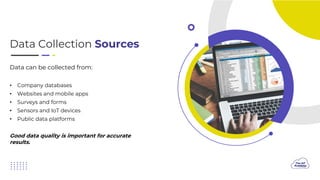
Data Collection Sources
Datacan be collected from:
• Company databases
• Websites and mobile apps
• Surveys and forms
• Sensors and IoT devices
• Public data platforms
Good data quality is important for accurate
results.
9.
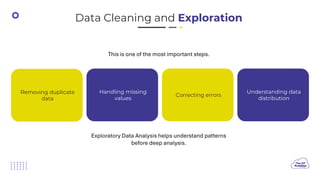
Data Cleaning andExploration
This is one of the most important steps.
Exploratory Data Analysis helps understand patterns
before deep analysis.
Removing duplicate
data
Handling missing
values
Correcting errors
Understanding data
distribution
10.
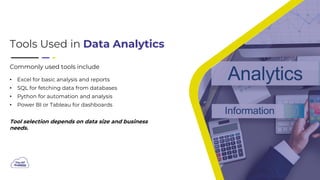
Tools Used inData Analytics
Commonly used tools include
• Excel for basic analysis and reports
• SQL for fetching data from databases
• Python for automation and analysis
• Power BI or Tableau for dashboards
Tool selection depends on data size and business
needs.
11.
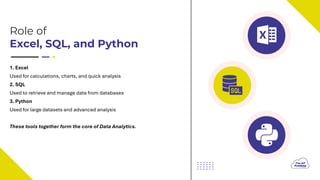
Role of
Excel, SQL,and Python
1. Excel
Used for calculations, charts, and quick analysis
2. SQL
Used to retrieve and manage data from databases
3. Python
Used for large datasets and advanced analysis
These tools together form the core of Data Analytics.
12.
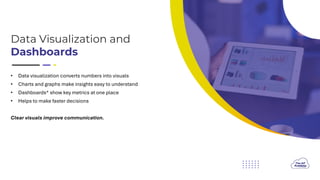
Data Visualization and
Dashboards
•Data visualization converts numbers into visuals
• Charts and graphs make insights easy to understand
• Dashboards* show key metrics at one place
• Helps to make faster decisions
Clear visuals improve communication.
13.
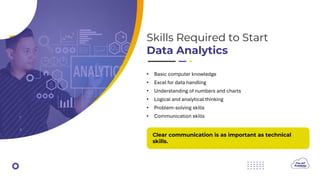
Skills Required toStart
Data Analytics
• Basic computer knowledge
• Excel for data handling
• Understanding of numbers and charts
• Logical and analytical thinking
• Problem-solving skills
• Communication skills
Clear communication is as important as technical
skills.
14.
Career Opportunities in
DataAnalytics
• Data Analyst
• Business Analyst
• Reporting Analyst
• Operations Analyst
• Entry-level Analytics Roles
15.
How to Starta Career in
Data Analytics
• Learn Excel and basic statistics
• Learn SQL for data handling
• Learn Python for analysis
• Practice with real datasets
• Build projects and dashboards