
Recommended
More Related Content
More from Wayne O'Brien
More from Wayne O'Brien (20)
Cinema audiences more professional
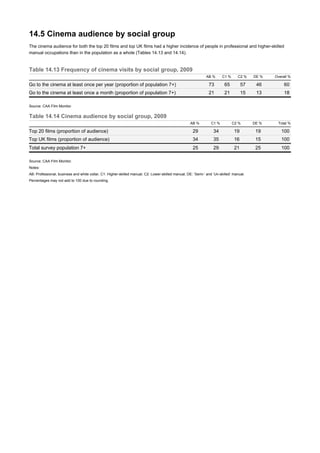
- 1. 14.5 Cinema audience by social group The cinema audience for both the top 20 films and top UK films had a higher incidence of people in professional and higher-skilled manual occupations than in the population as a whole (Tables 14.13 and 14.14). Table 14.13 Frequency of cinema visits by social group, 2009 AB % C1 % C2 % DE % Overall % Go to the cinema at least once per year (proportion of population 7+) 73 65 57 46 60 Go to the cinema at least once a month (proportion of population 7+) 21 21 15 13 18 Source: CAA Film Monitor. Table 14.14 Cinema audience by social group, 2009 AB % C1 % C2 % DE % Total % Top 20 films (proportion of audience) 29 34 19 19 100 Top UK films (proportion of audience) 34 35 16 15 100 Total survey population 7+ 25 29 21 25 100 Source: CAA Film Monitor. Notes: AB: Professional, business and white collar, C1: Higher-skilled manual, C2: Lower-skilled manual, DE: ‘Semi-’ and ‘Un-skilled’ manual. Percentages may not add to 100 due to rounding.