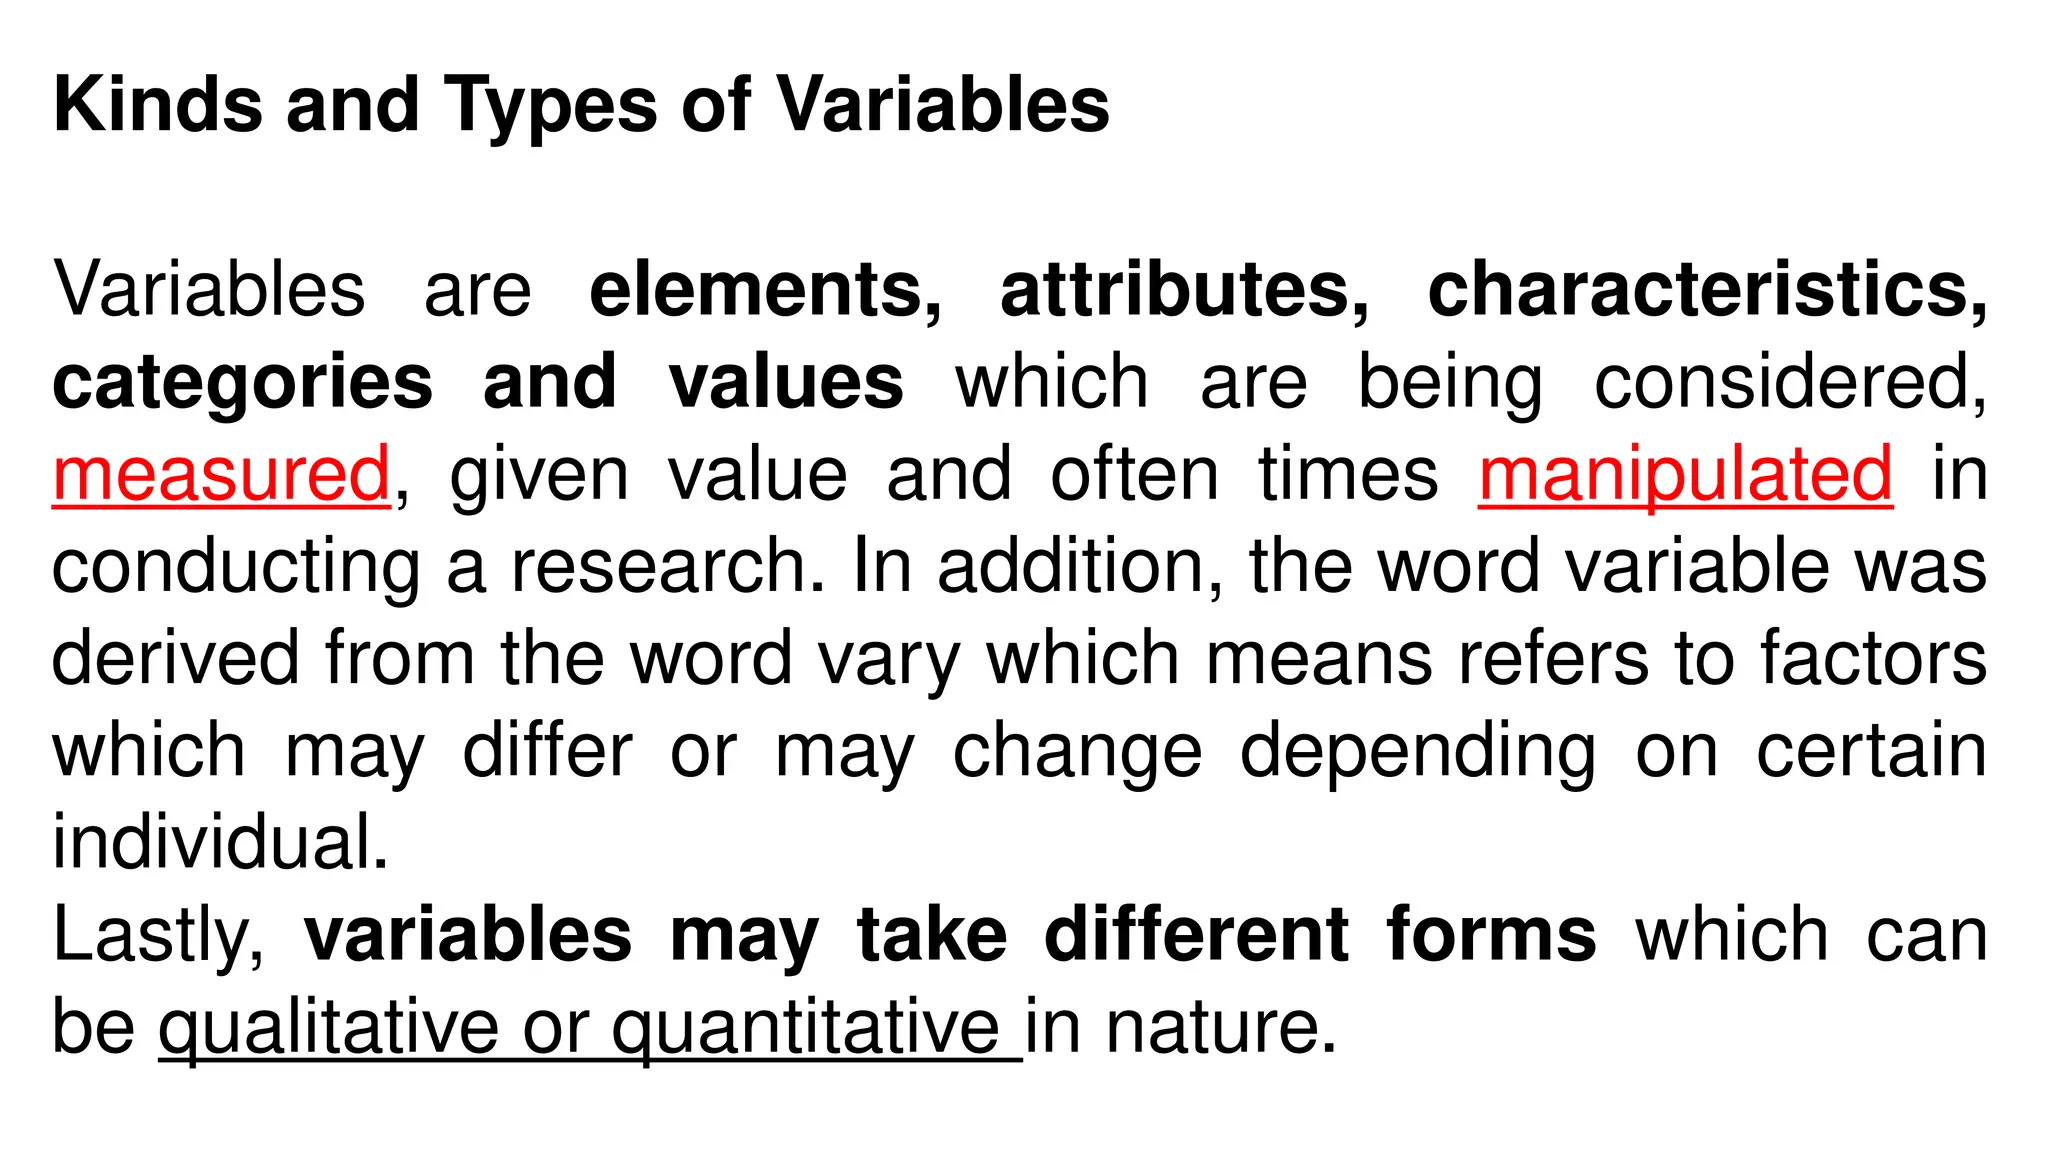
Kinds and Typesof Variables
Variables are elements, attributes, characteristics,
categories and values which are being considered,
measured, given value and often times manipulated in
conducting a research. In addition, the word variable was
derived from the word vary which means refers to factors
which may differ or may change depending on certain
individual.
Lastly, variables may take different forms which can
be qualitative or quantitative in nature.
3.
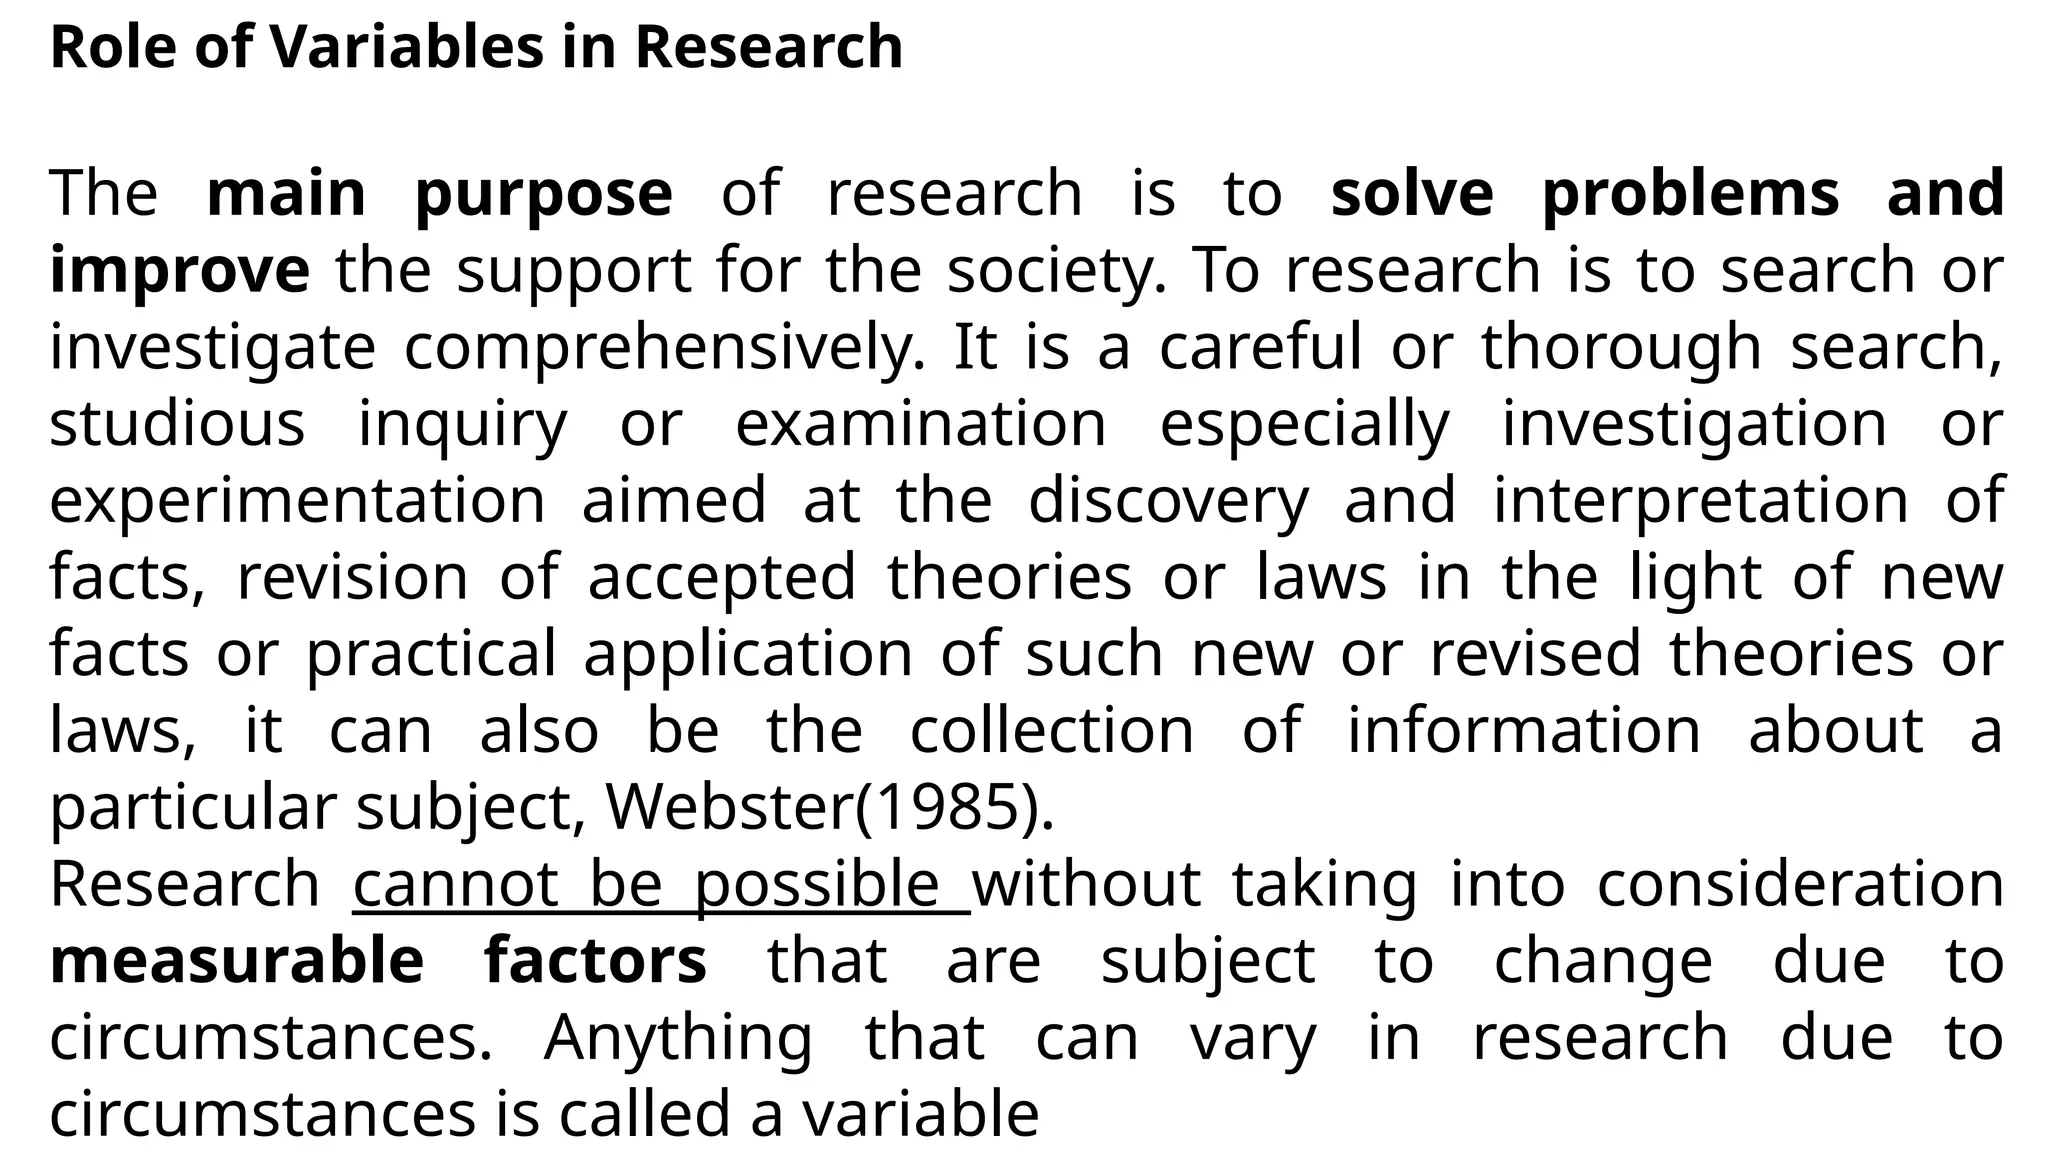
Role of Variablesin Research
The main purpose of research is to solve problems and
improve the support for the society. To research is to search or
investigate comprehensively. It is a careful or thorough search,
studious inquiry or examination especially investigation or
experimentation aimed at the discovery and interpretation of
facts, revision of accepted theories or laws in the light of new
facts or practical application of such new or revised theories or
laws, it can also be the collection of information about a
particular subject, Webster(1985).
Research cannot be possible without taking into consideration
measurable factors that are subject to change due to
circumstances. Anything that can vary in research due to
circumstances is called a variable
15.
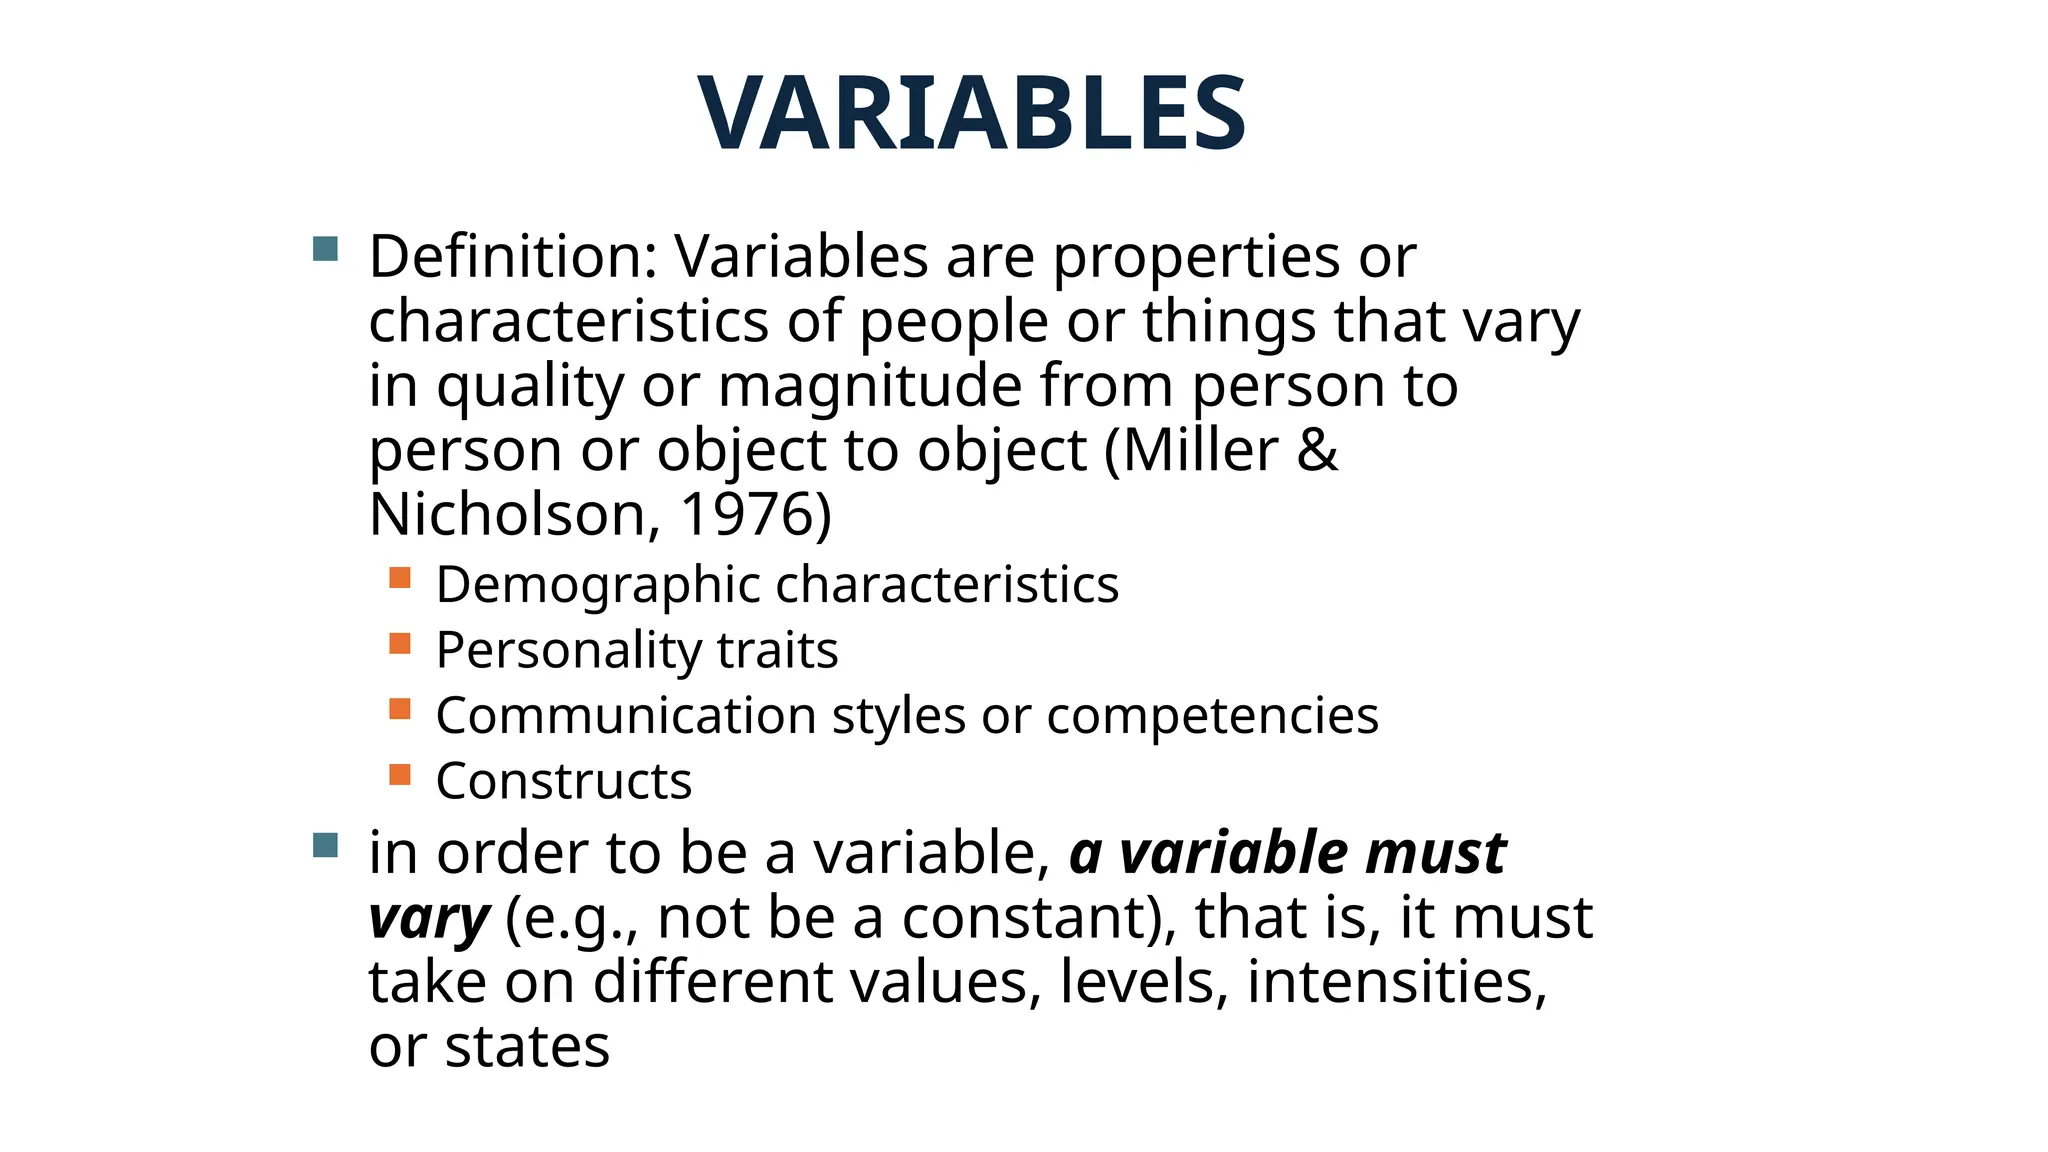
VARIABLES
Definition: Variablesare properties or
characteristics of people or things that vary
in quality or magnitude from person to
person or object to object (Miller &
Nicholson, 1976)
Demographic characteristics
Personality traits
Communication styles or competencies
Constructs
in order to be a variable, a variable must
vary (e.g., not be a constant), that is, it must
take on different values, levels, intensities,
or states
17.
b
Variables According toFunctional
Relationship
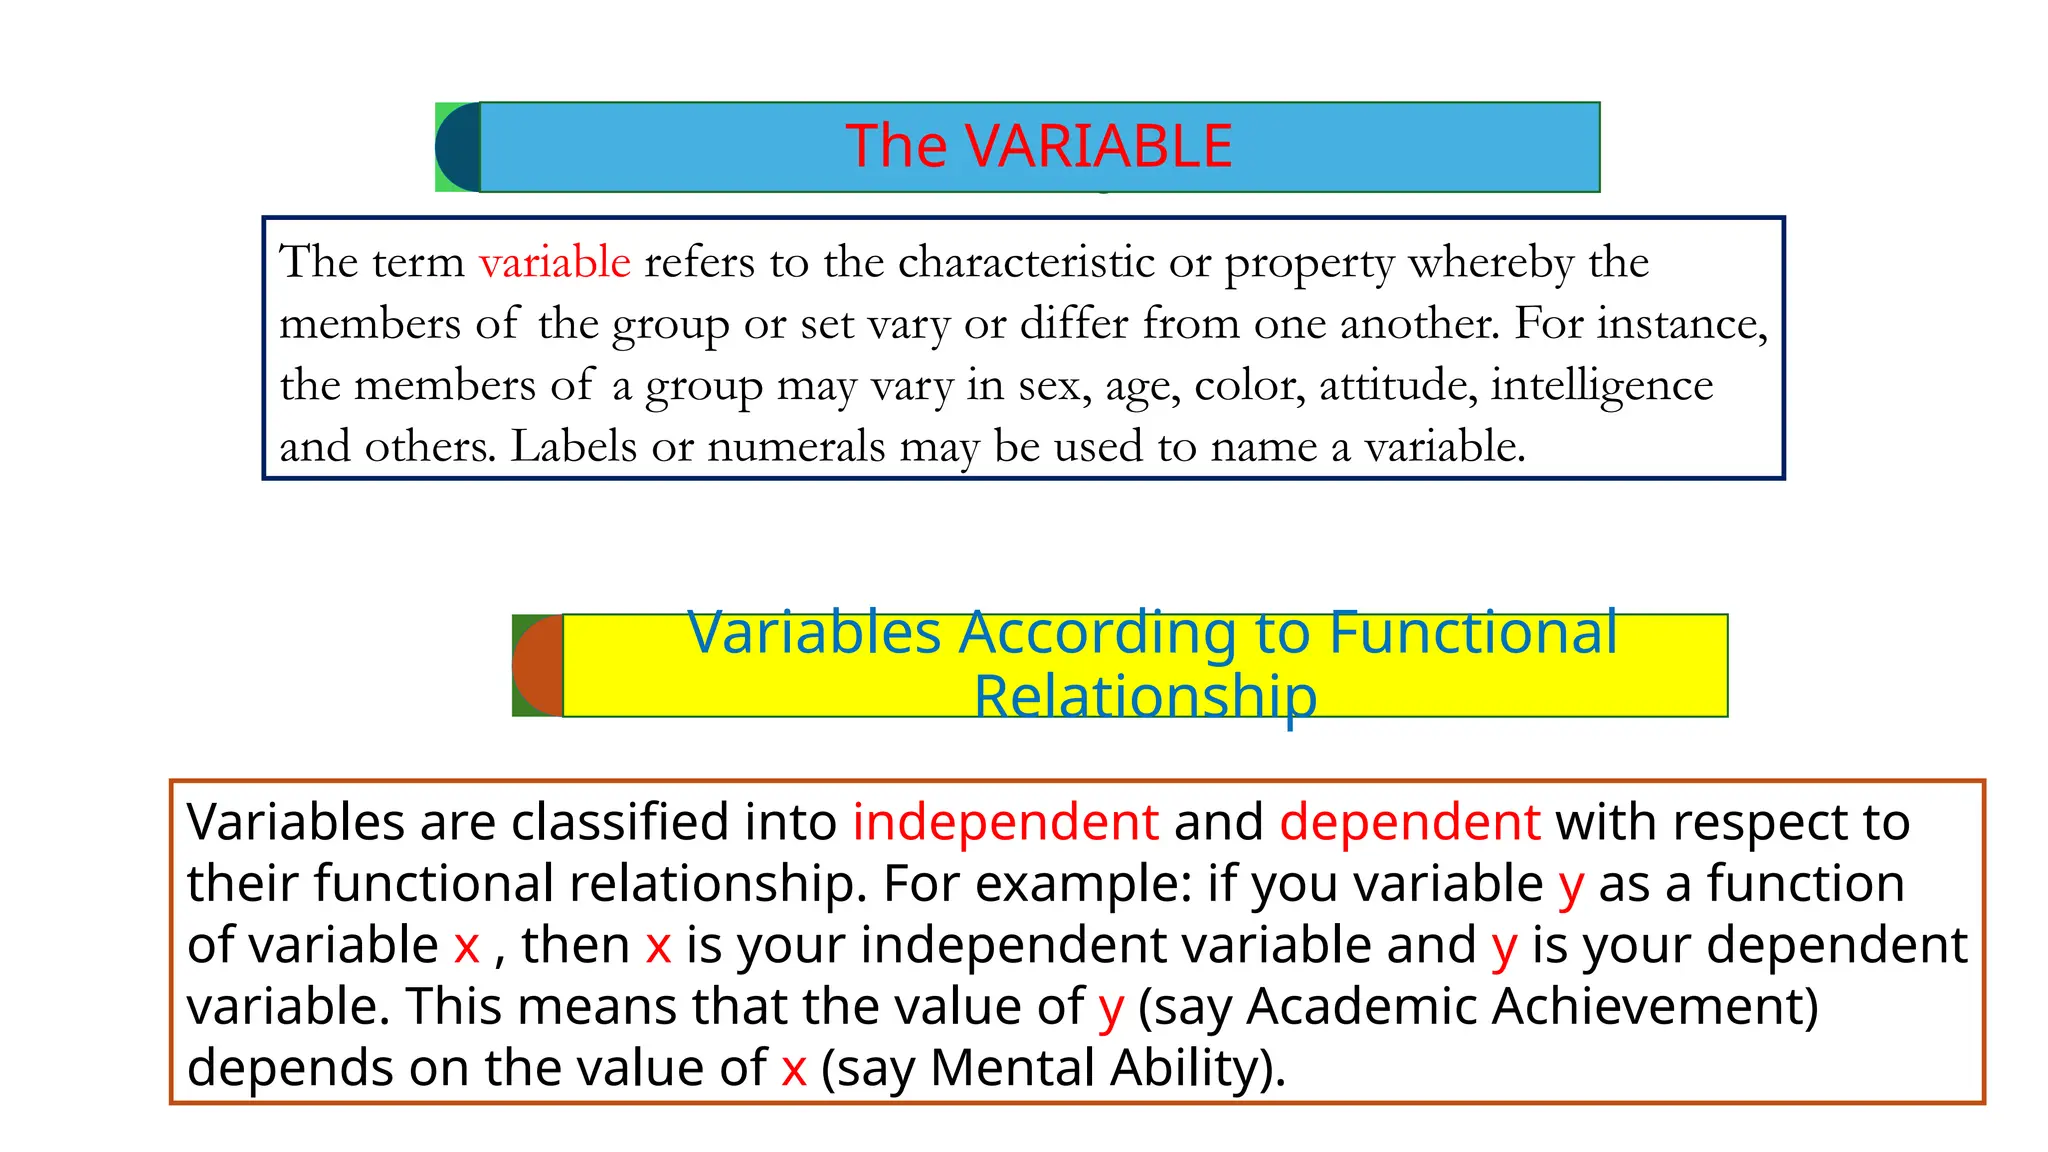
The VARIABLE
The term variable refers to the characteristic or property whereby the
members of the group or set vary or differ from one another. For instance,
the members of a group may vary in sex, age, color, attitude, intelligence
and others. Labels or numerals may be used to name a variable.
Variables are classified into independent and dependent with respect to
their functional relationship. For example: if you variable y as a function
of variable x , then x is your independent variable and y is your dependent
variable. This means that the value of y (say Academic Achievement)
depends on the value of x (say Mental Ability).
18.
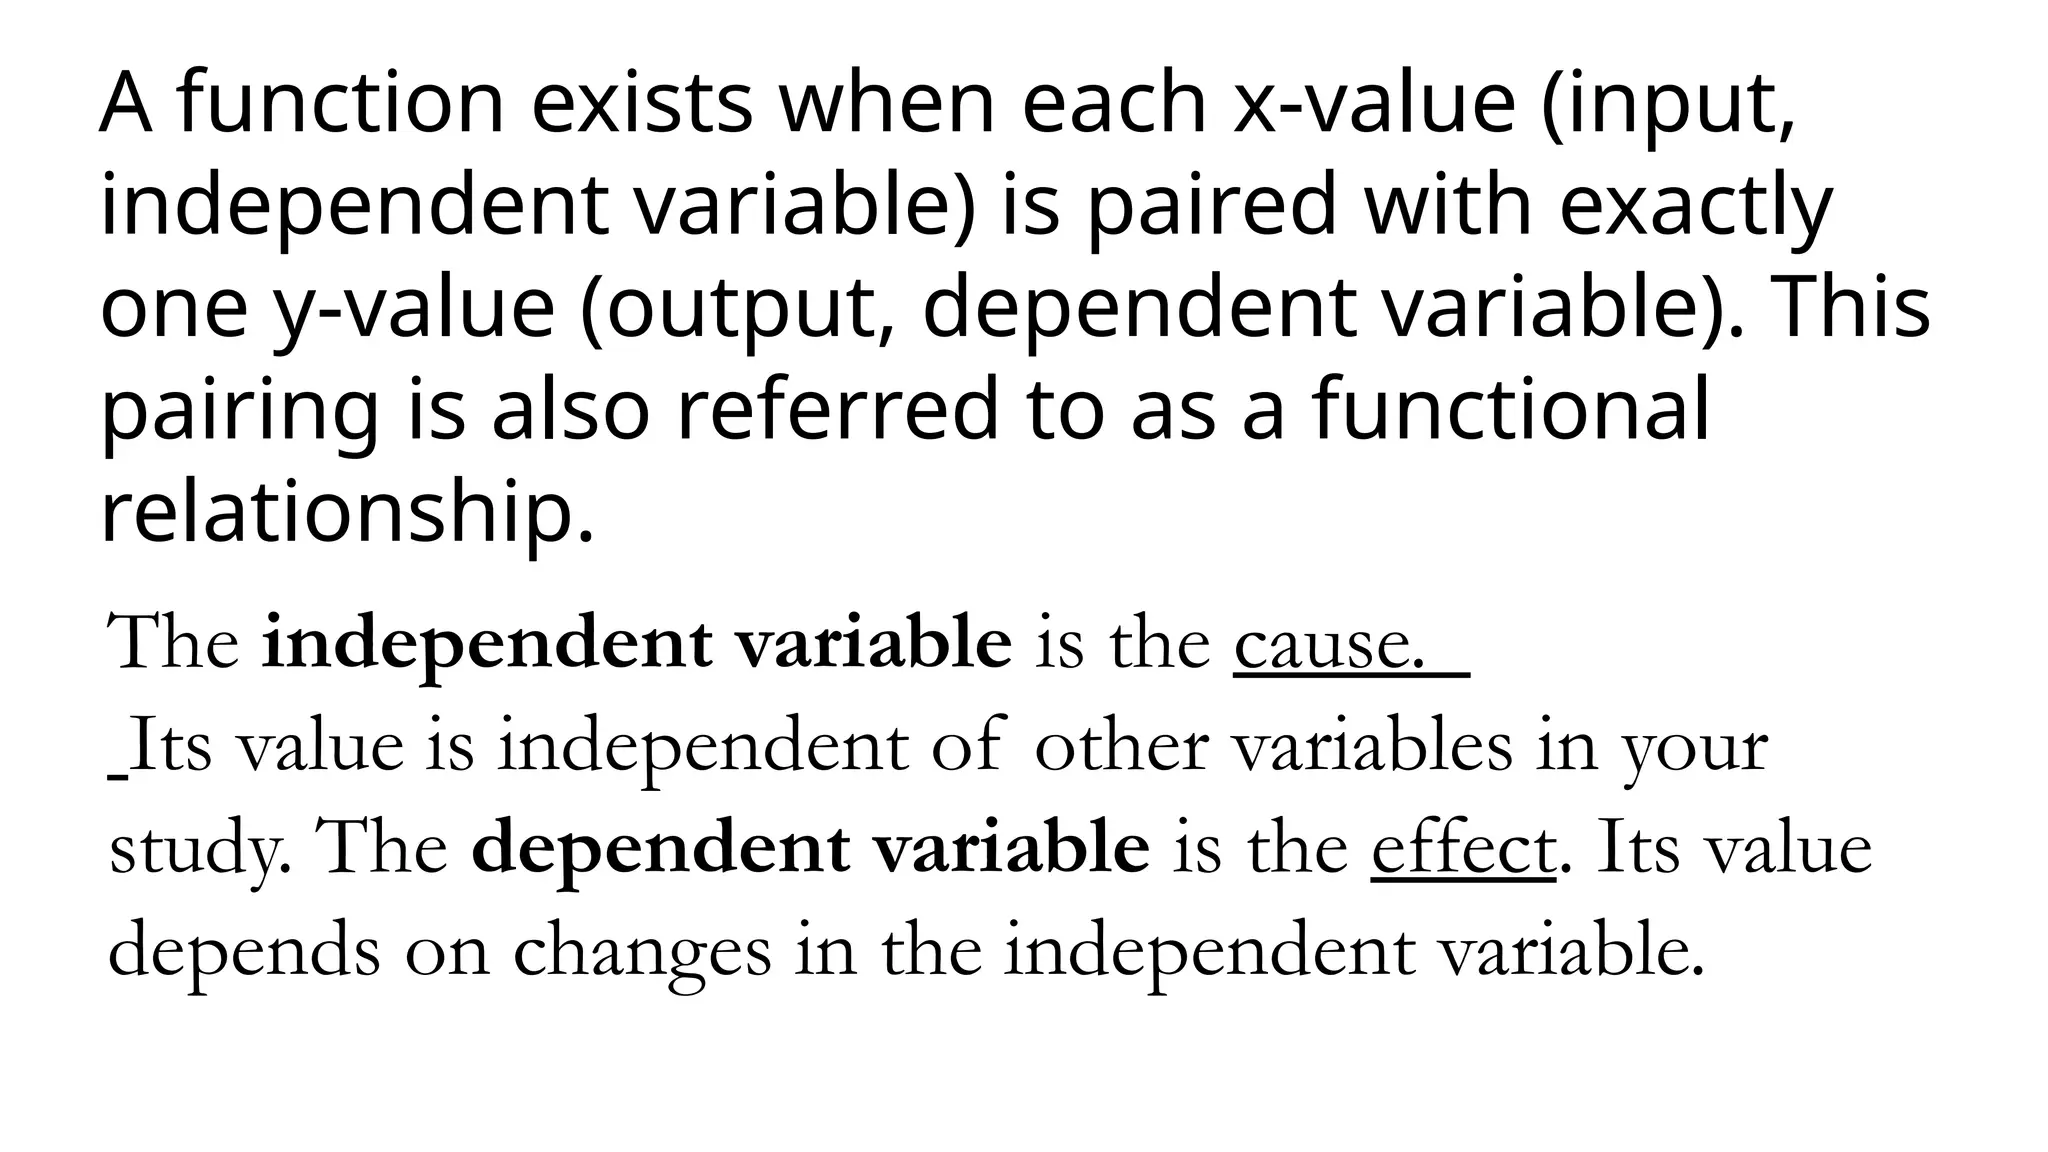
A function existswhen each x-value (input,
independent variable) is paired with exactly
one y-value (output, dependent variable). This
pairing is also referred to as a functional
relationship.
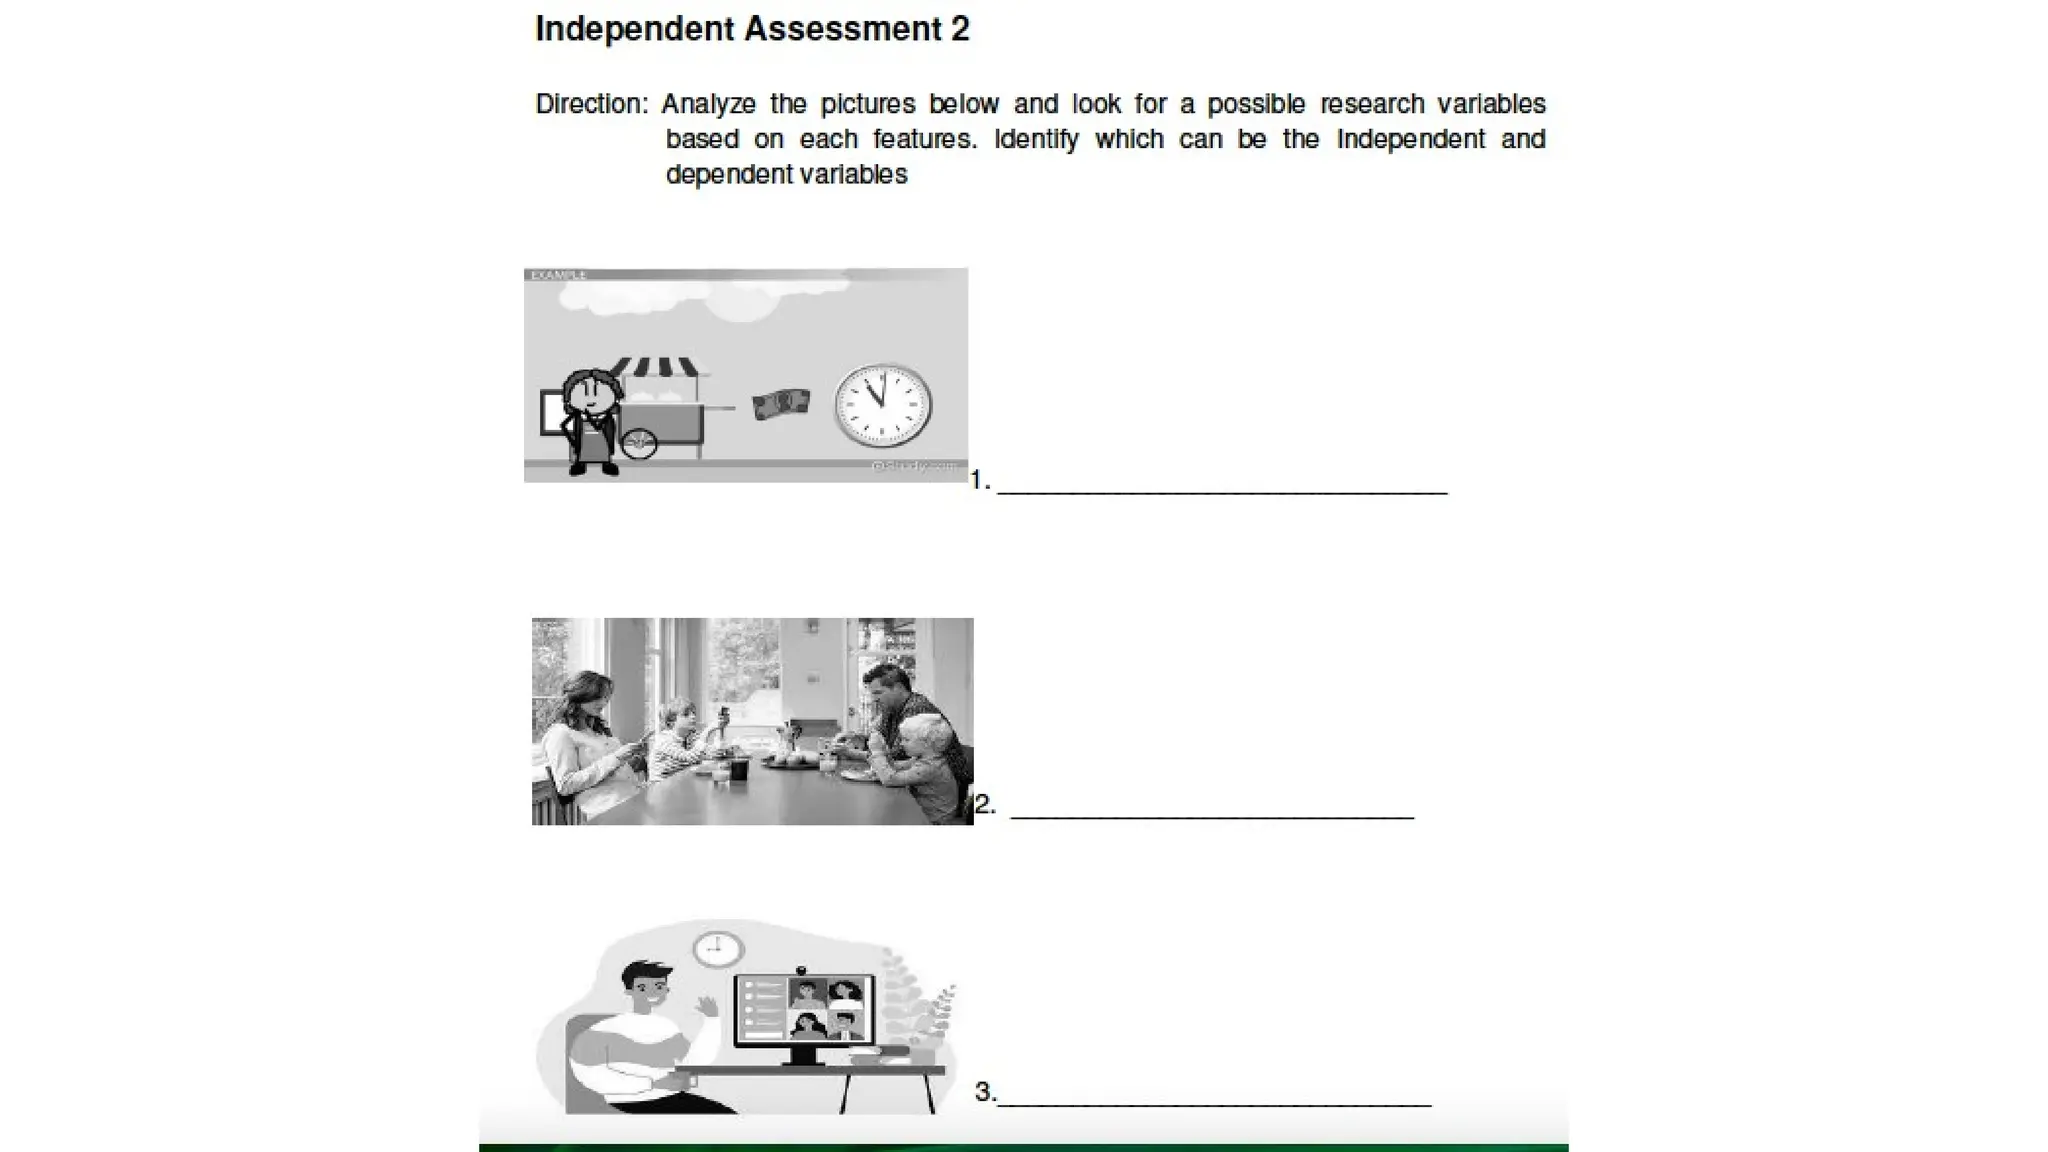
The independent variable is the cause.
Its value is independent of other variables in your
study. The dependent variable is the effect. Its value
depends on changes in the independent variable.
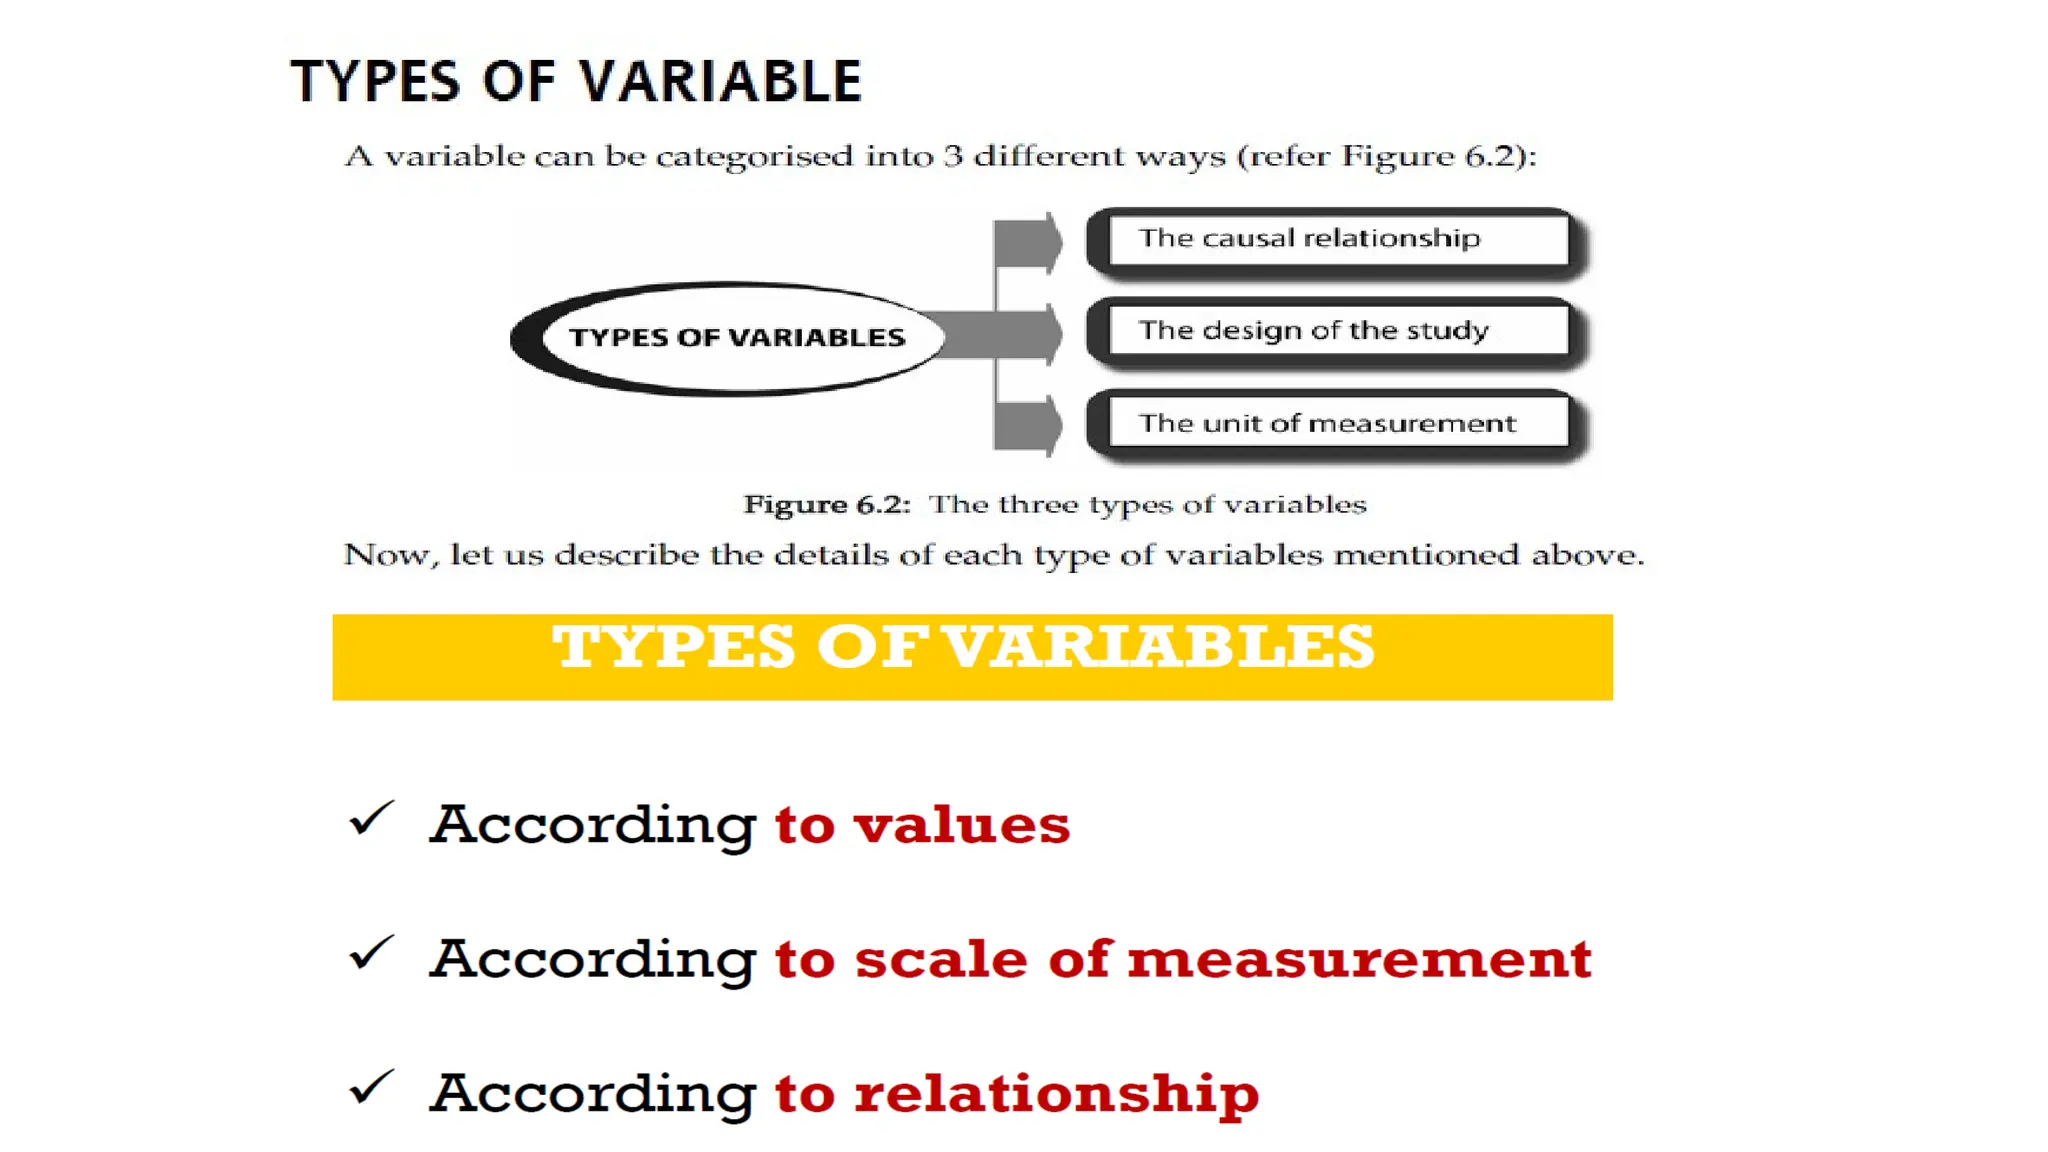
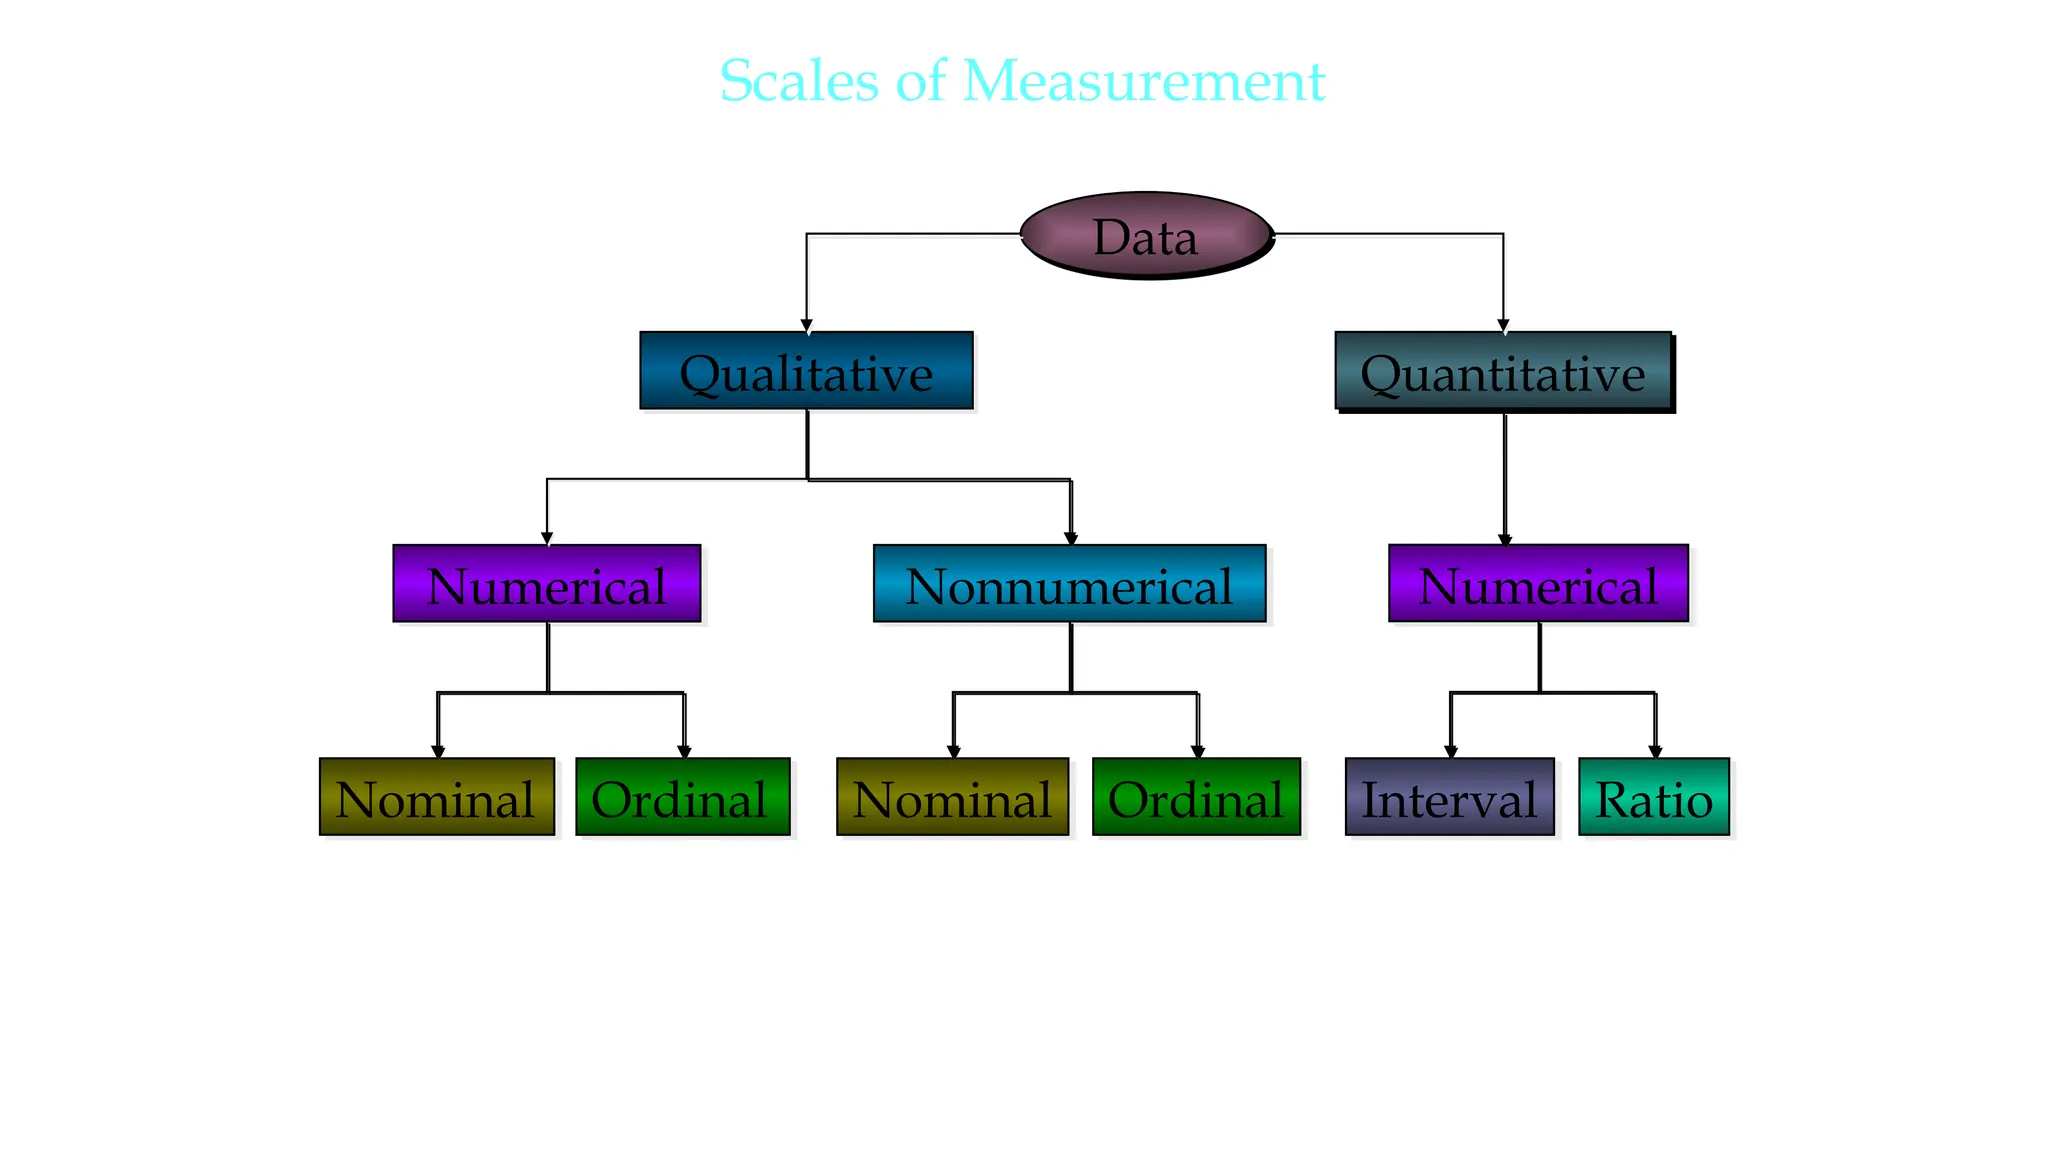
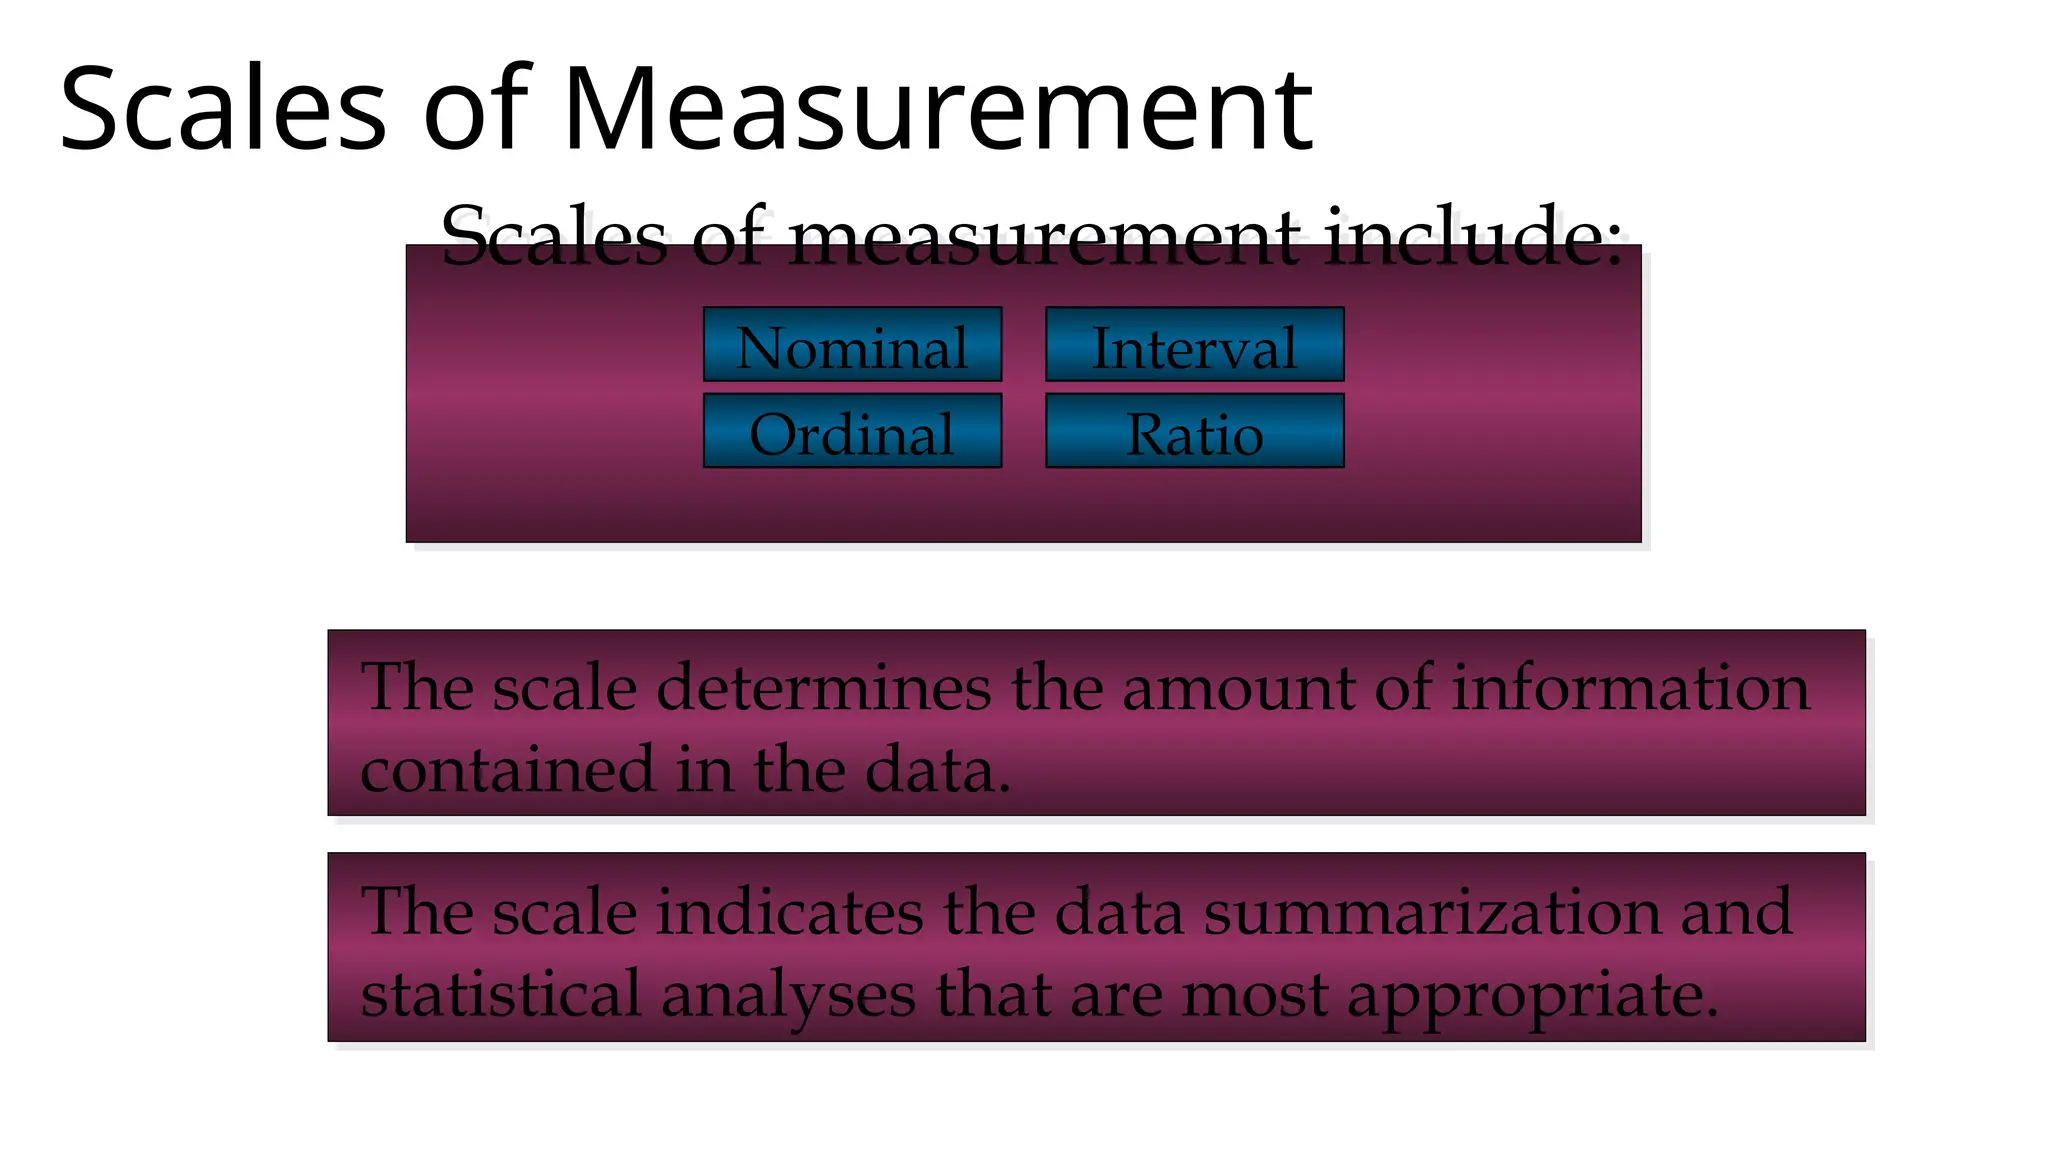
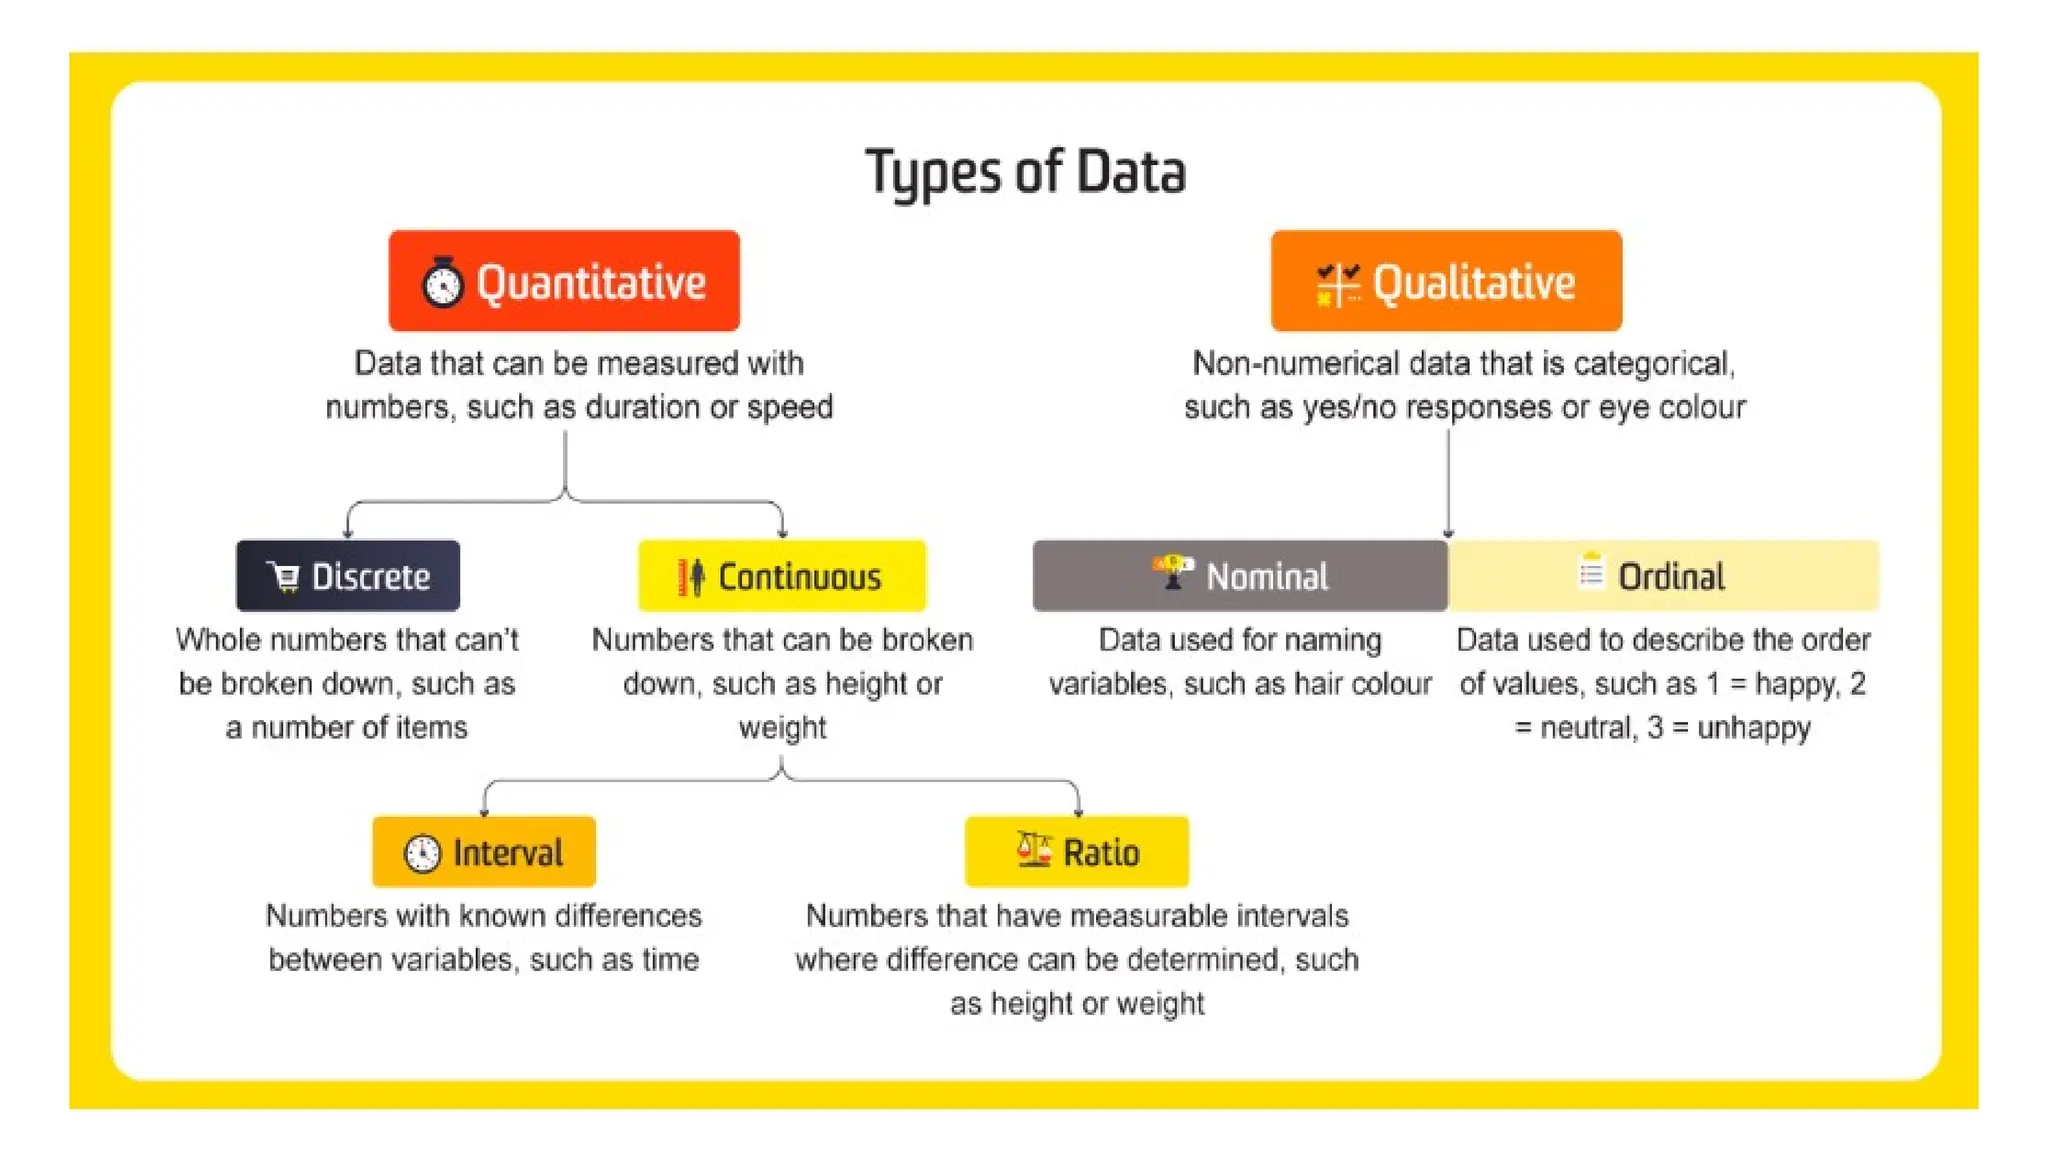
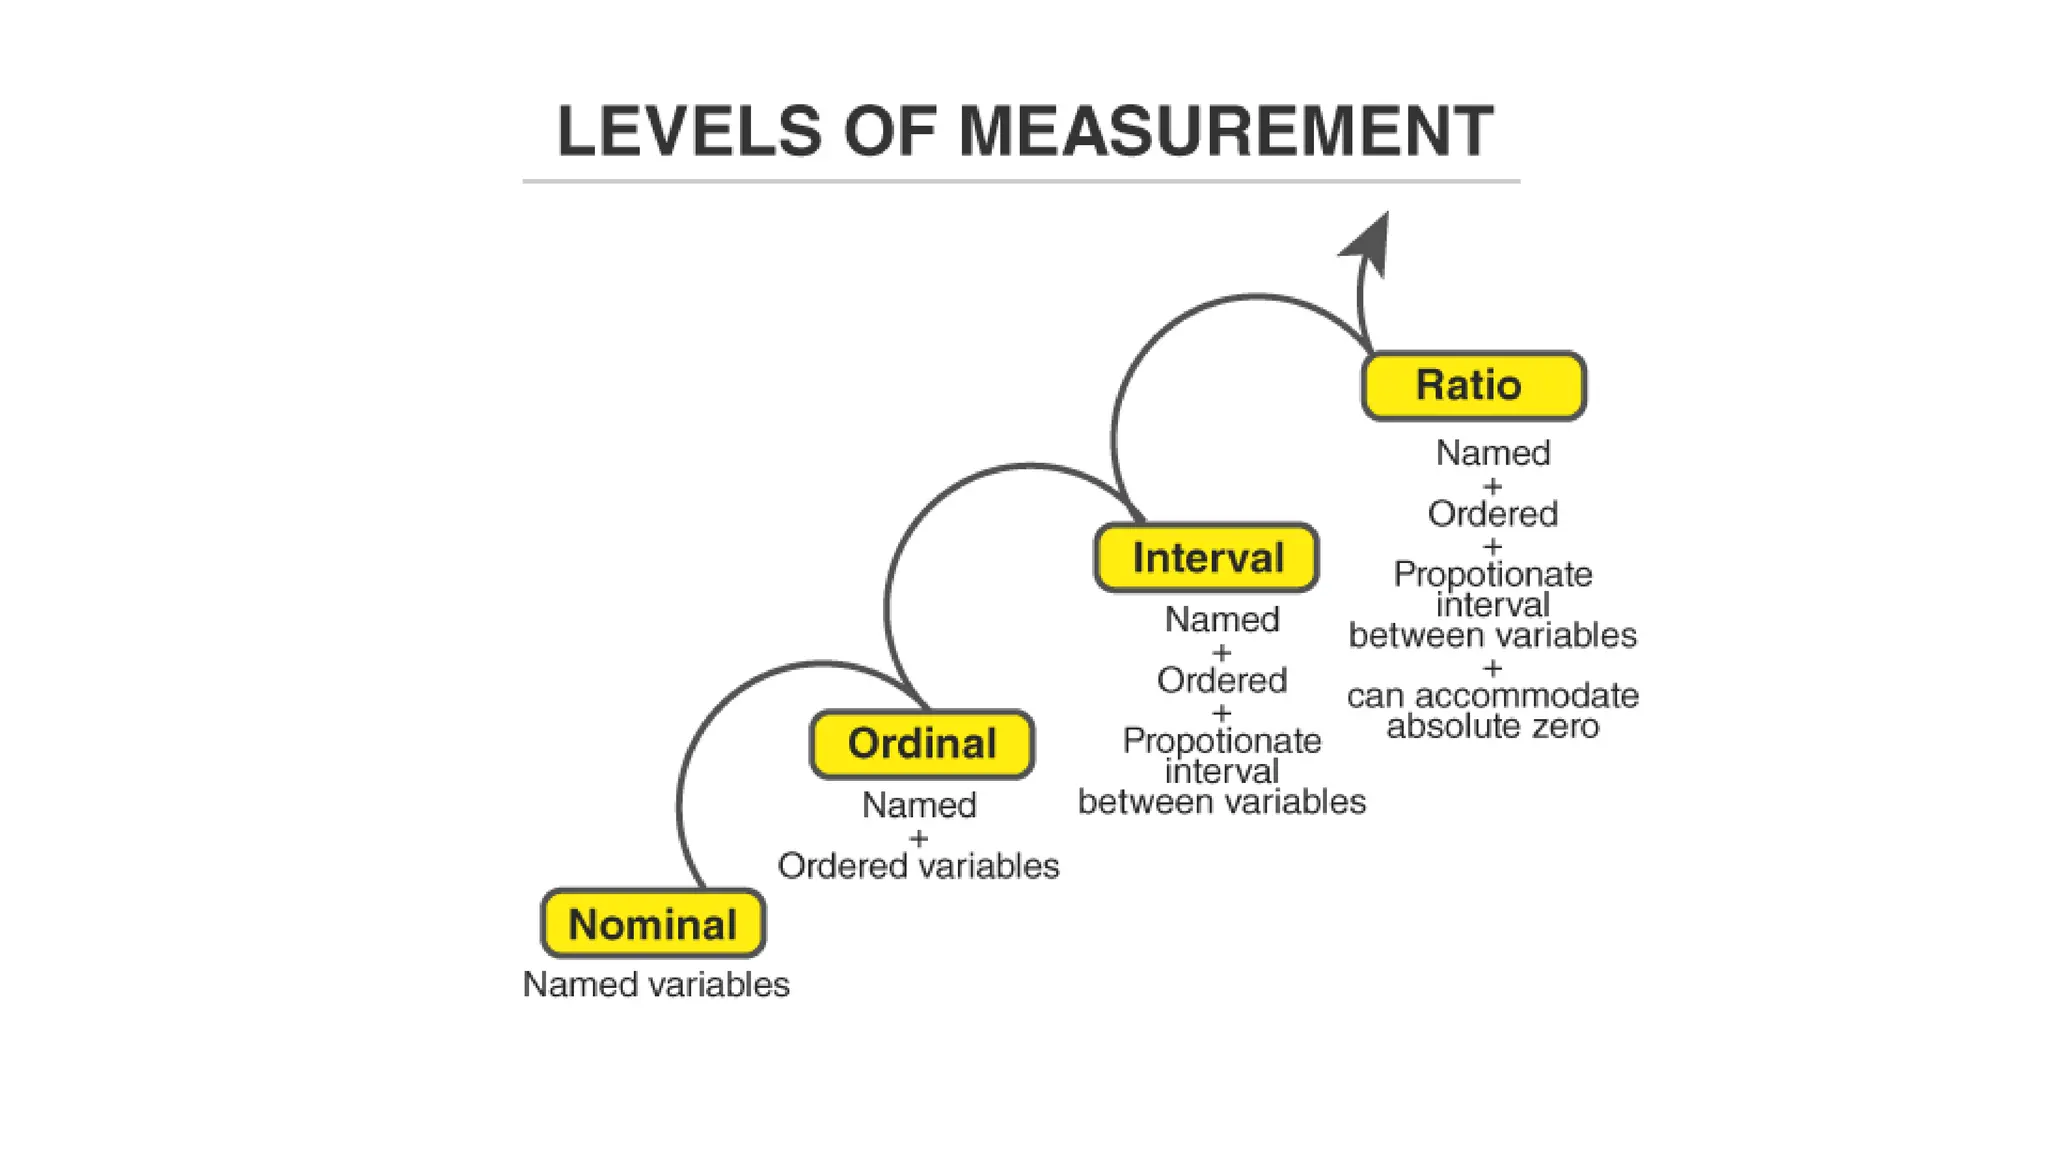
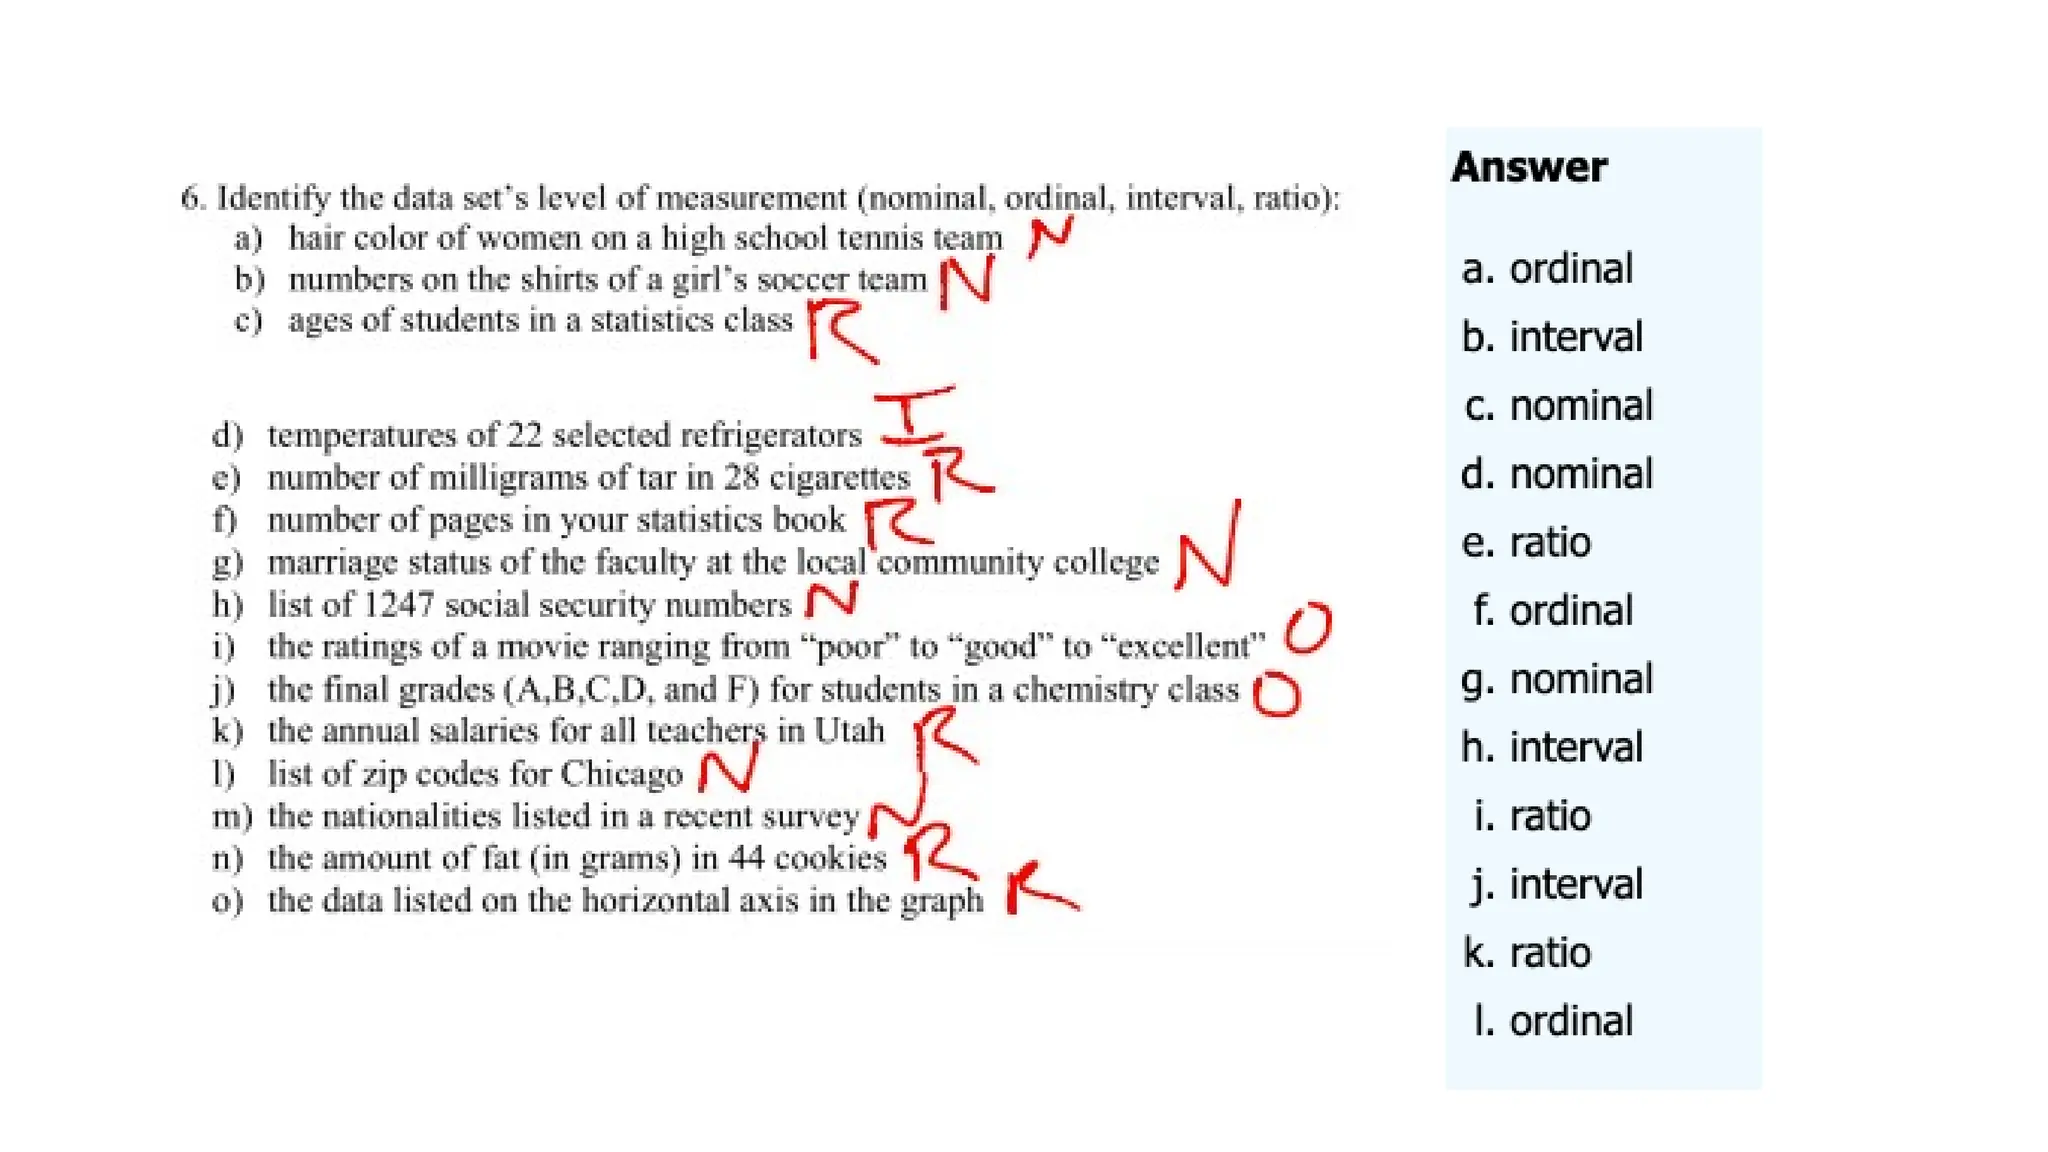
Scales of Measurement
Thescale indicates the data summarization and
statistical analyses that are most appropriate.
The scale determines the amount of information
contained in the data.
Scales of measurement include:
Nominal
Ordinal
Interval
Ratio
21.
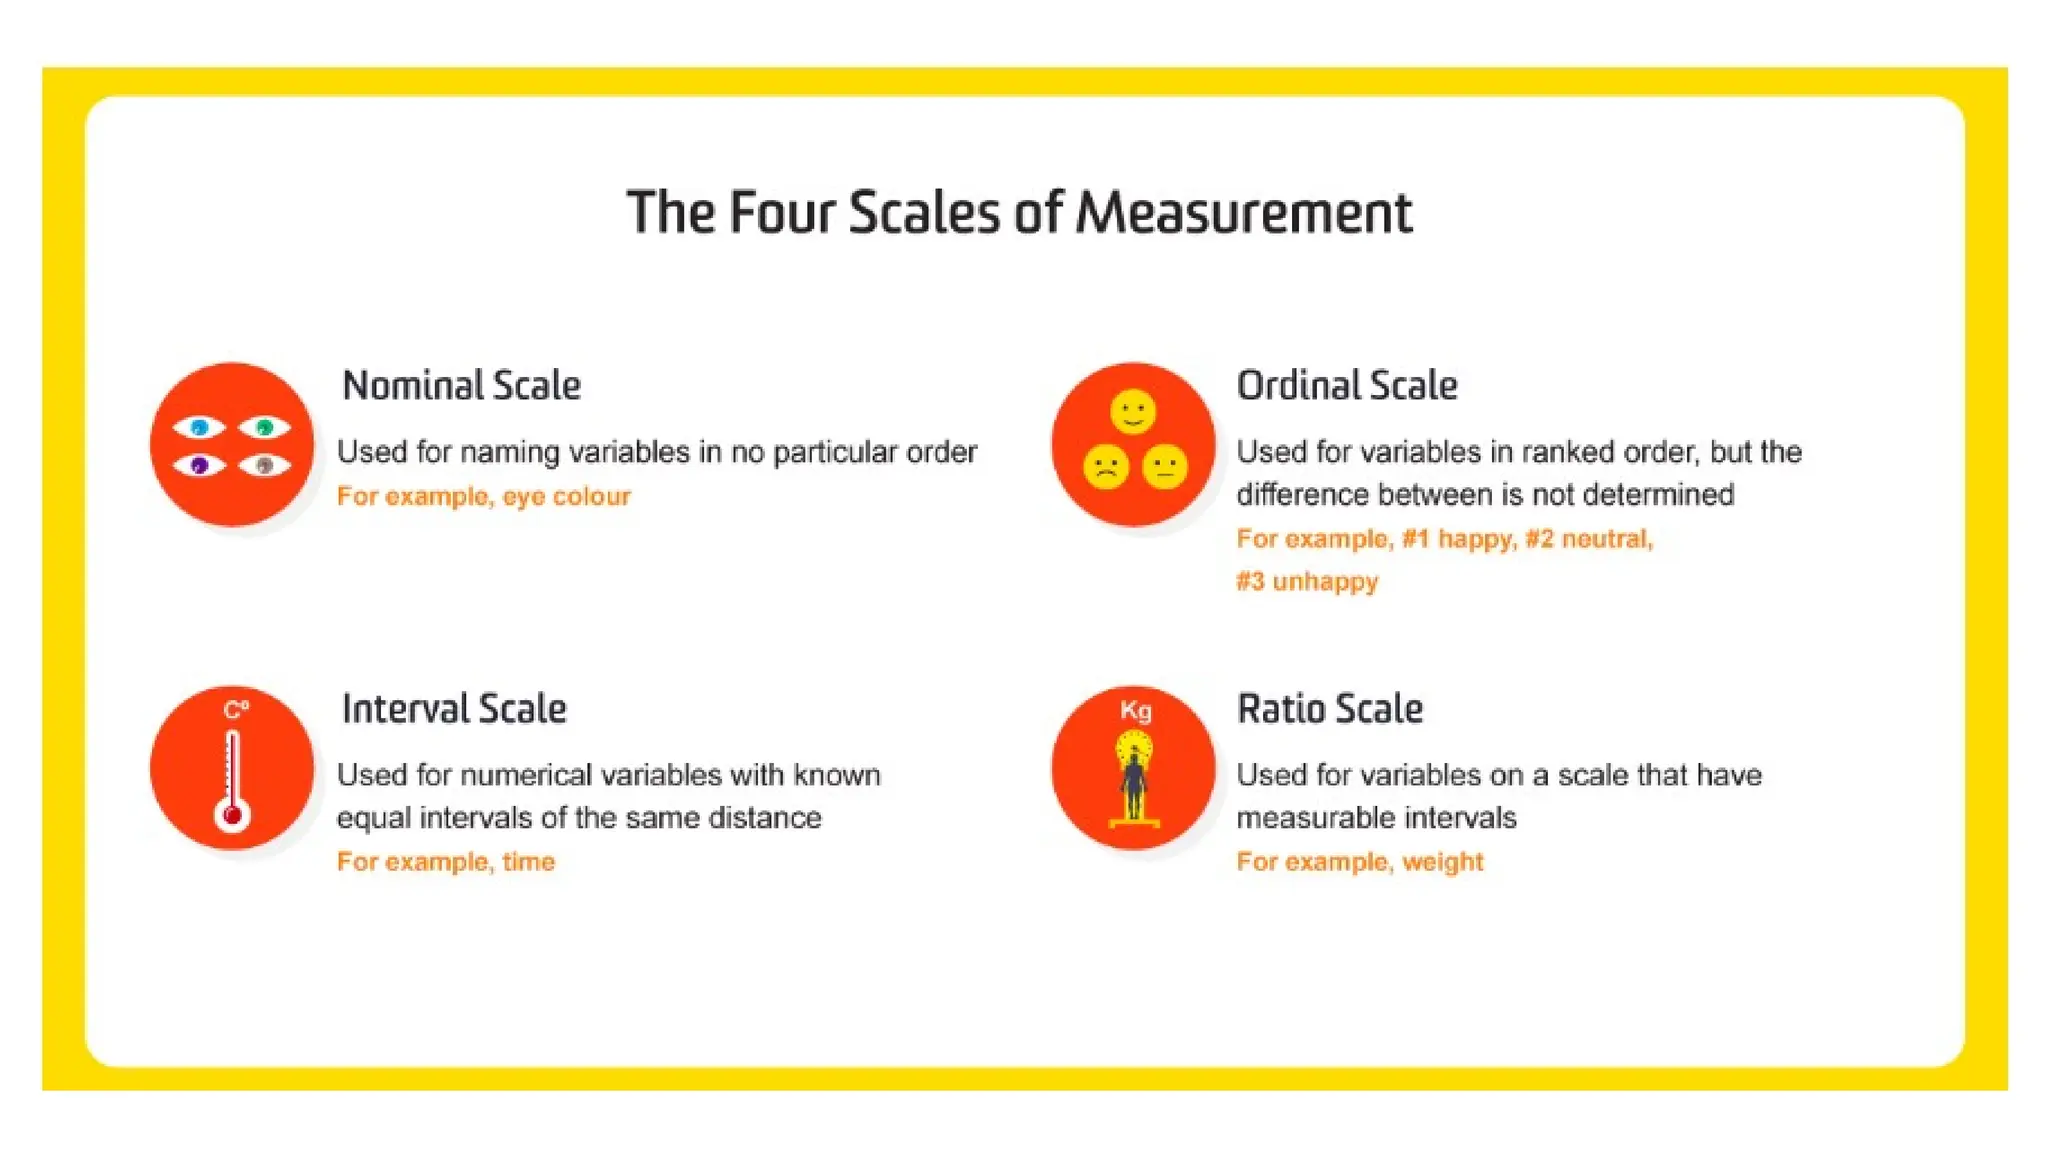
Scales of Measurement
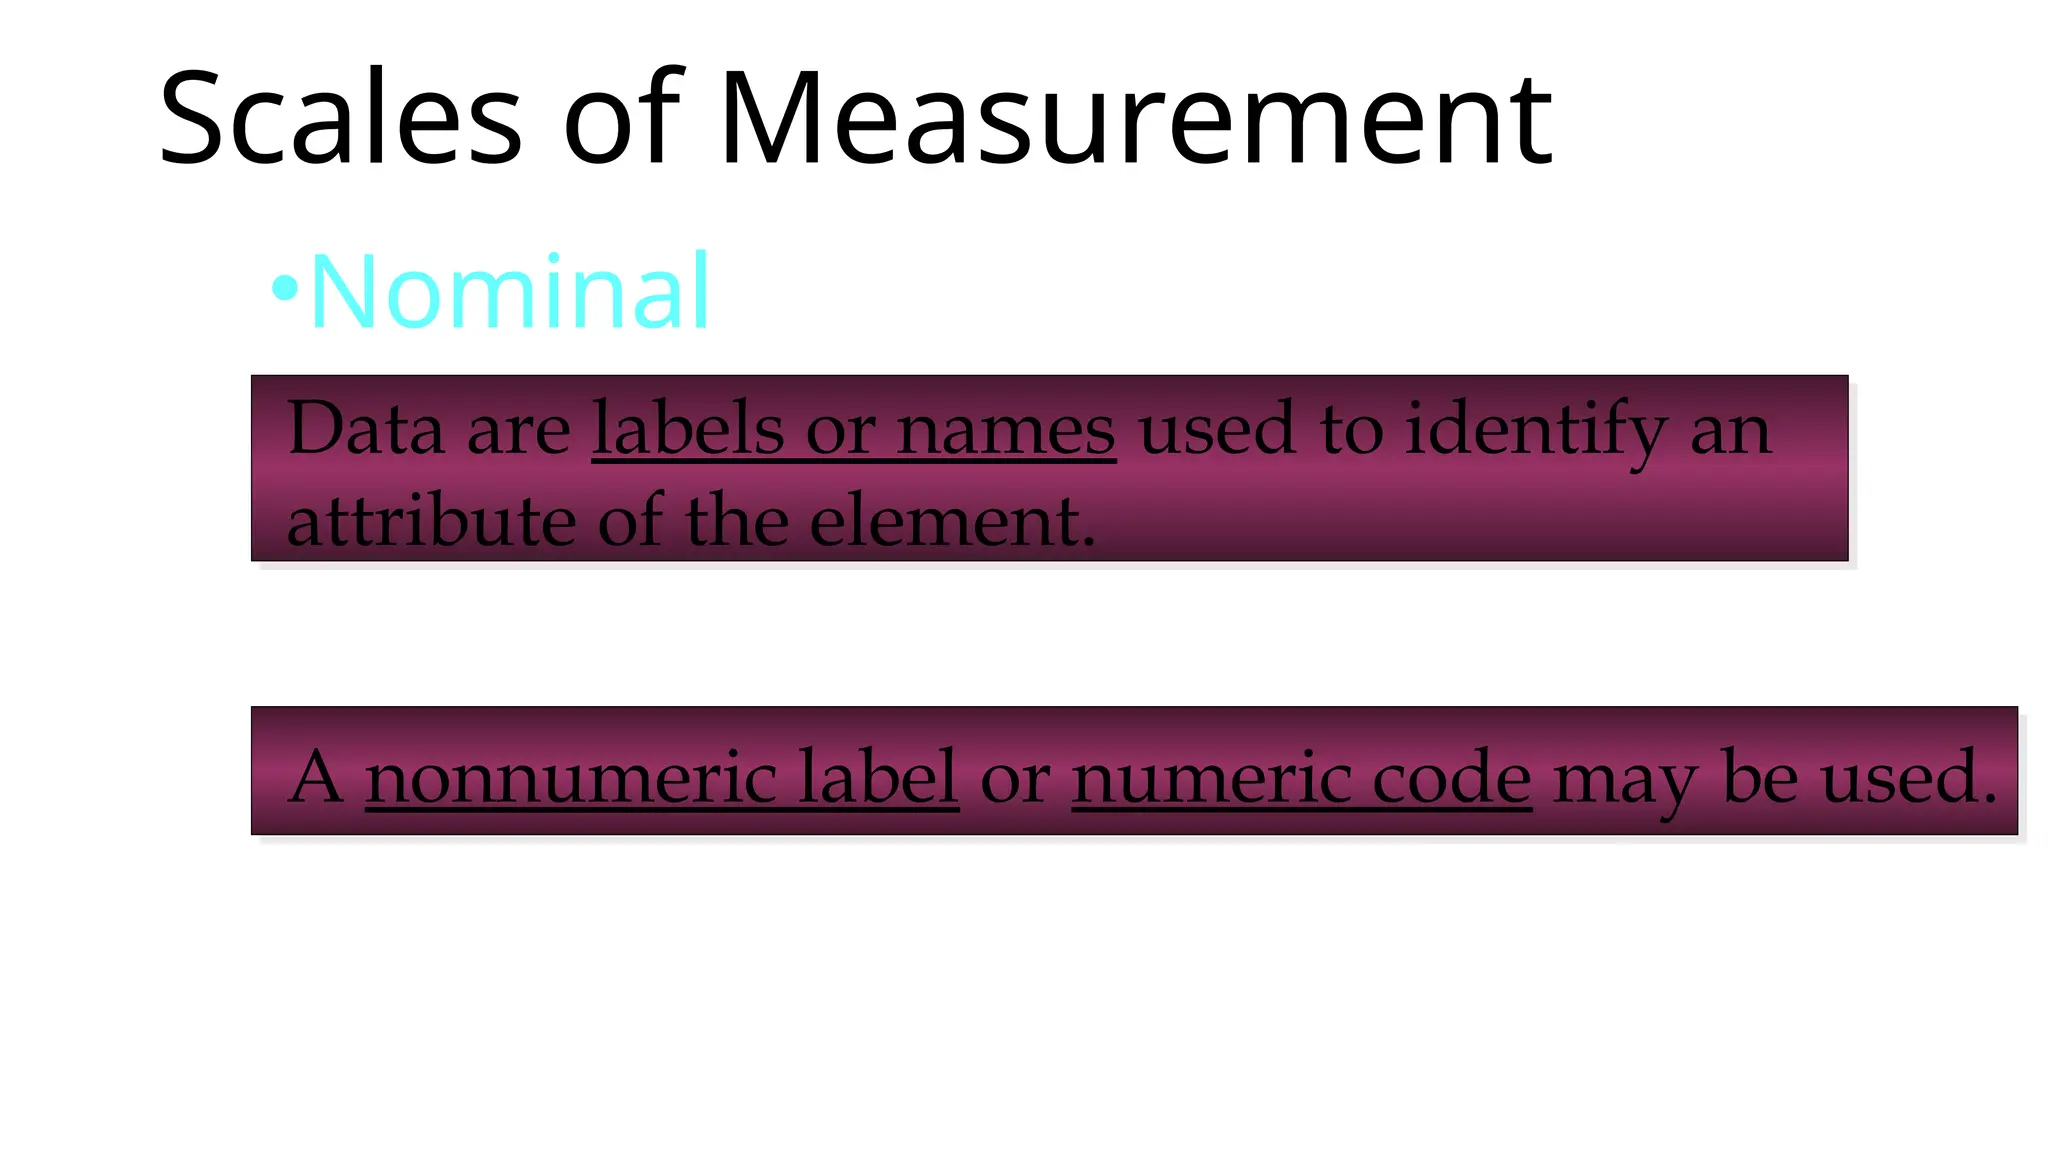
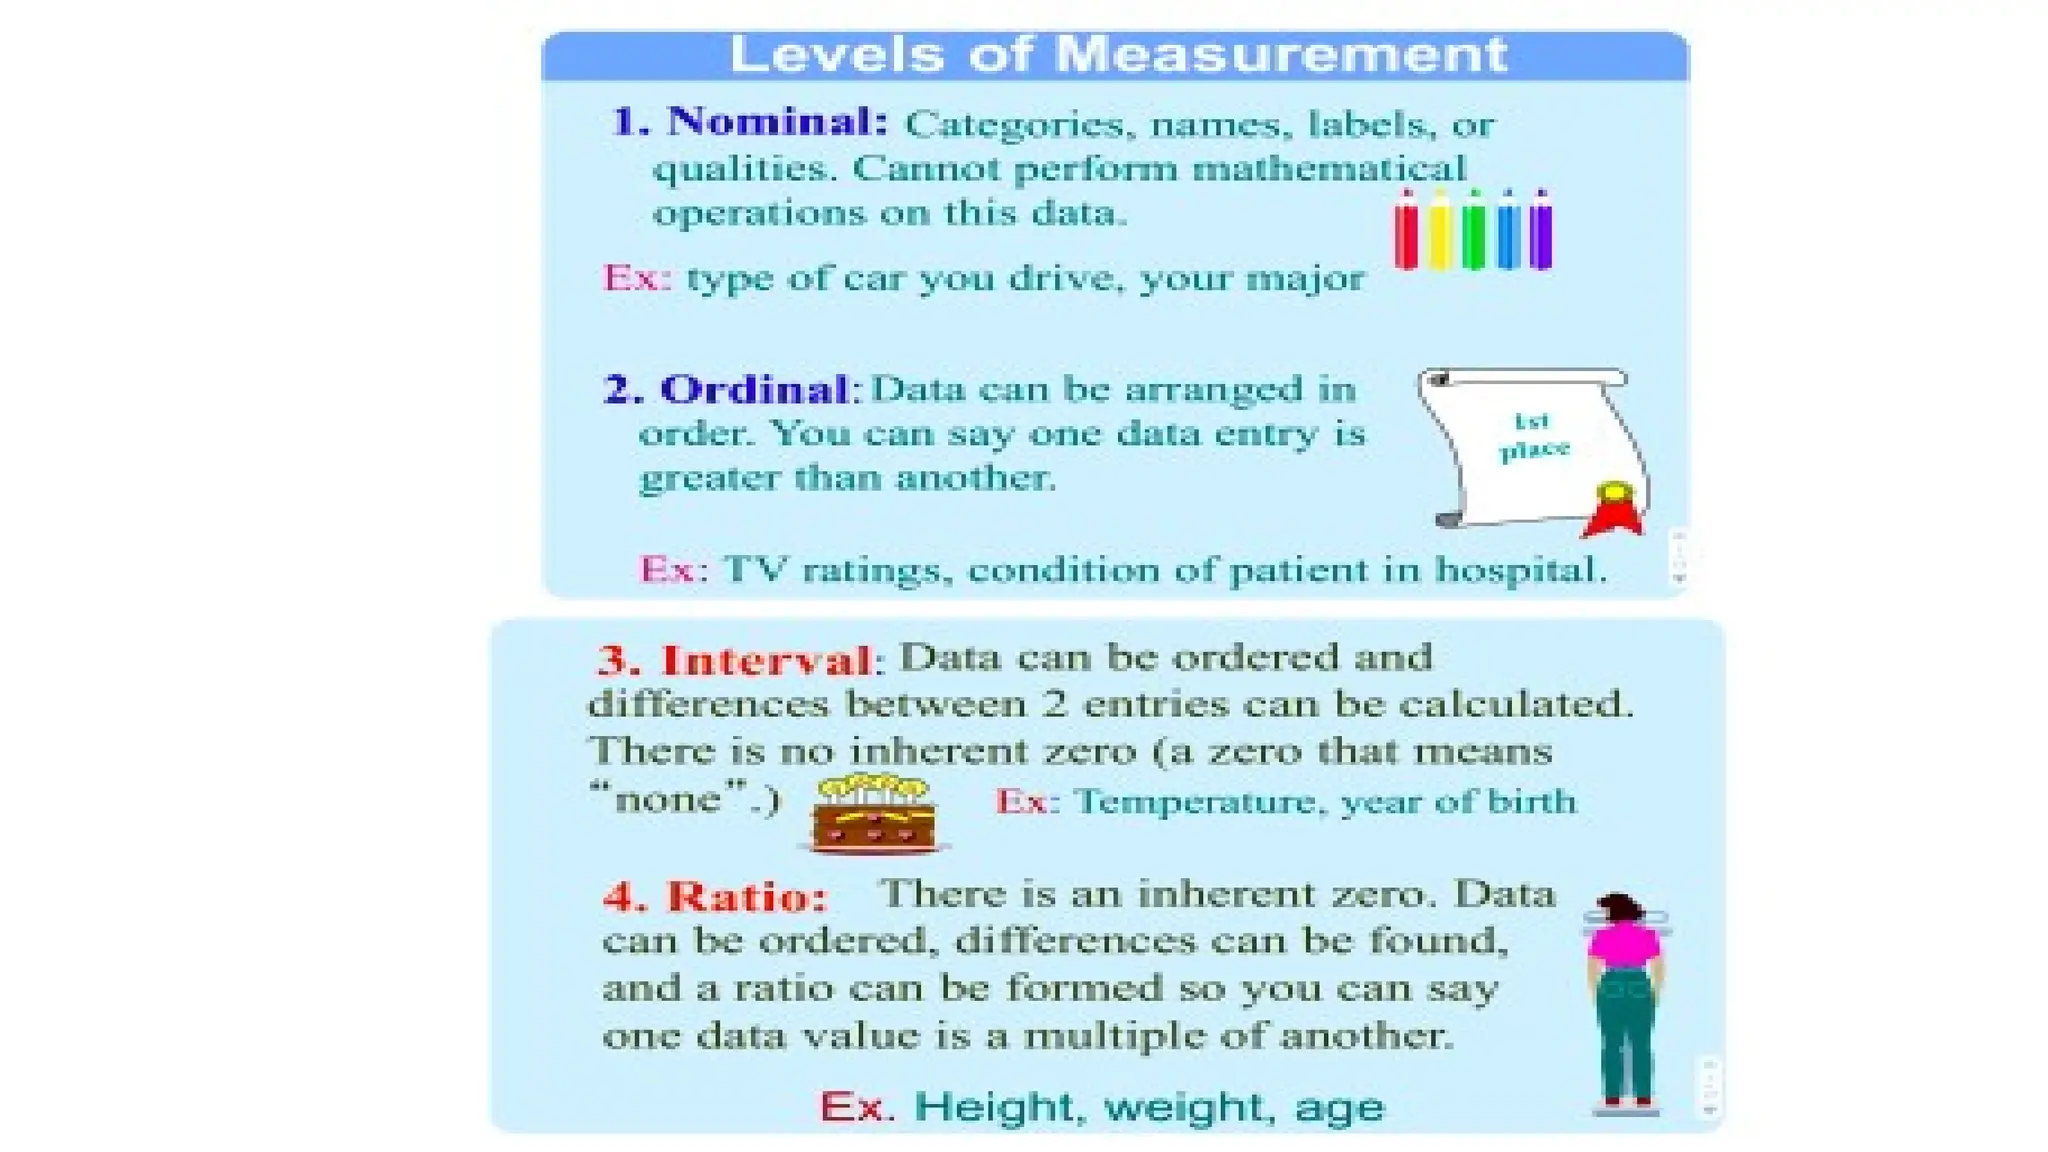
•Nominal
Anonnumeric label or numeric code may be used.
Data are labels or names used to identify an
attribute of the element.
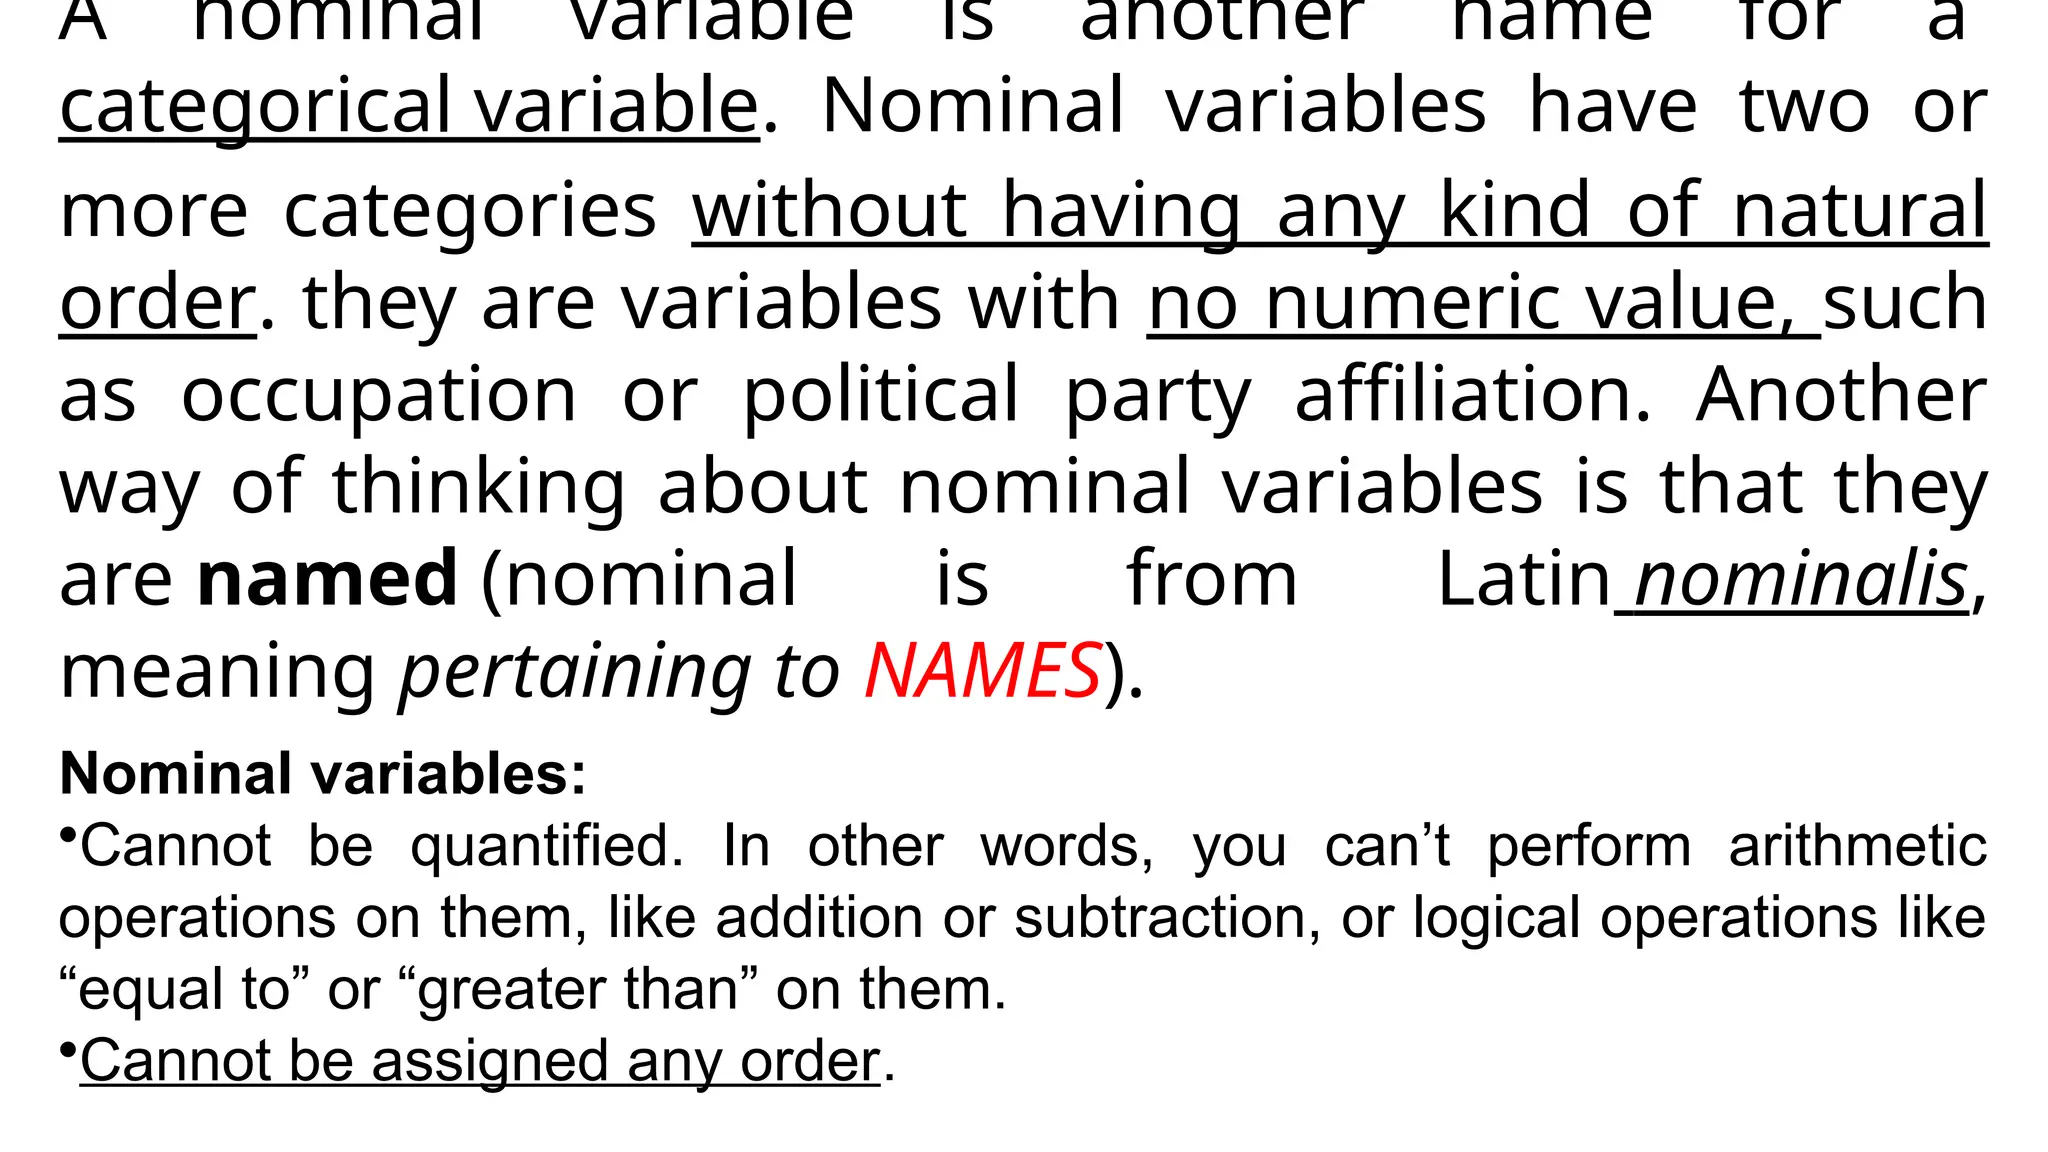
A nominal variableis another name for a
categorical variable. Nominal variables have two or
more categories without having any kind of natural
order. they are variables with no numeric value, such
as occupation or political party affiliation. Another
way of thinking about nominal variables is that they
are named (nominal is from Latin nominalis,
meaning pertaining to NAMES).
Nominal variables:
•Cannot be quantified. In other words, you can’t perform arithmetic
operations on them, like addition or subtraction, or logical operations like
“equal to” or “greater than” on them.
•Cannot be assigned any order.
24.
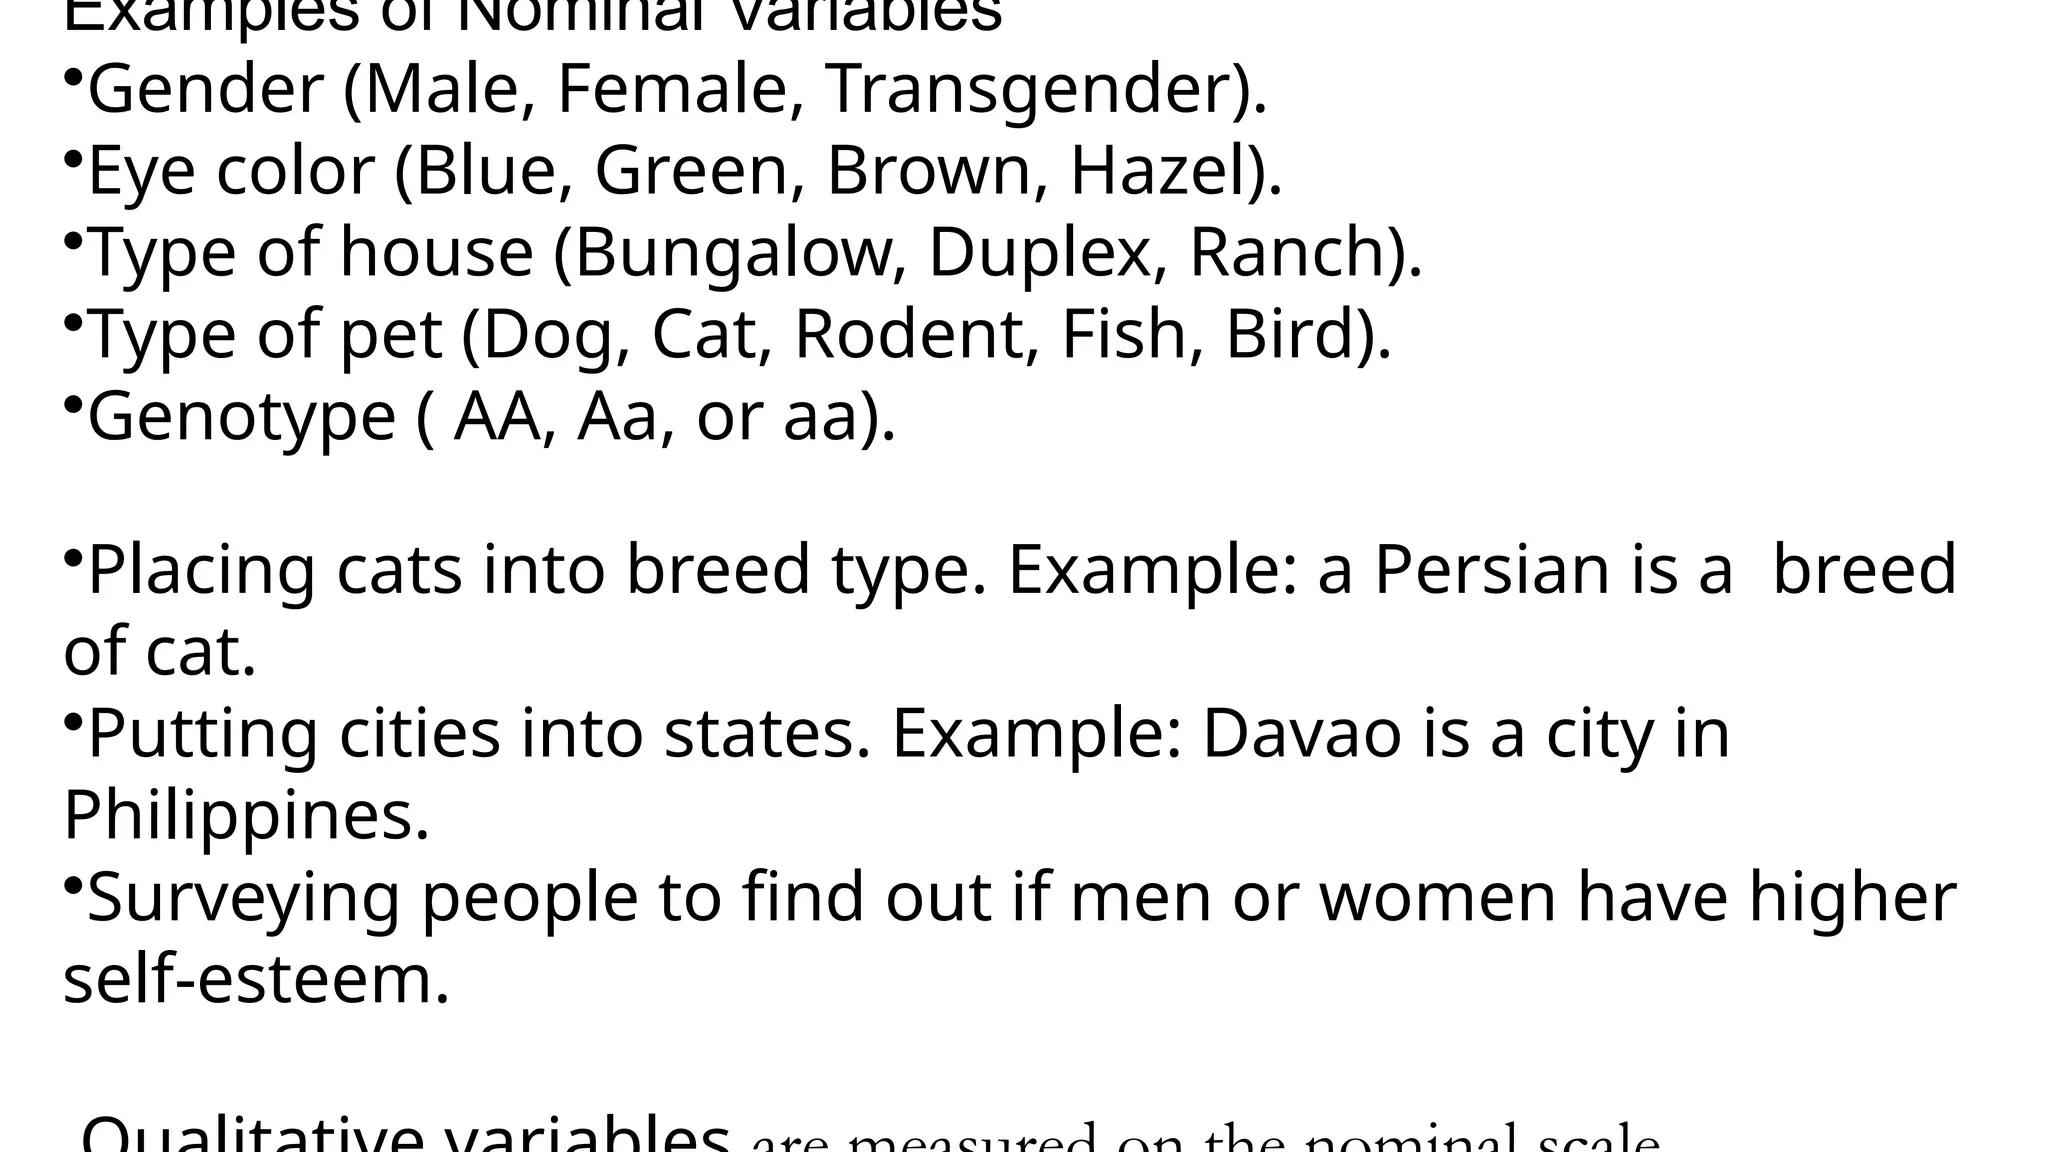
Examples of NominalVariables
•Gender (Male, Female, Transgender).
•Eye color (Blue, Green, Brown, Hazel).
•Type of house (Bungalow, Duplex, Ranch).
•Type of pet (Dog, Cat, Rodent, Fish, Bird).
•Genotype ( AA, Aa, or aa).
•Placing cats into breed type. Example: a Persian is a breed
of cat.
•Putting cities into states. Example: Davao is a city in
Philippines.
•Surveying people to find out if men or women have higher
self-esteem.
25.
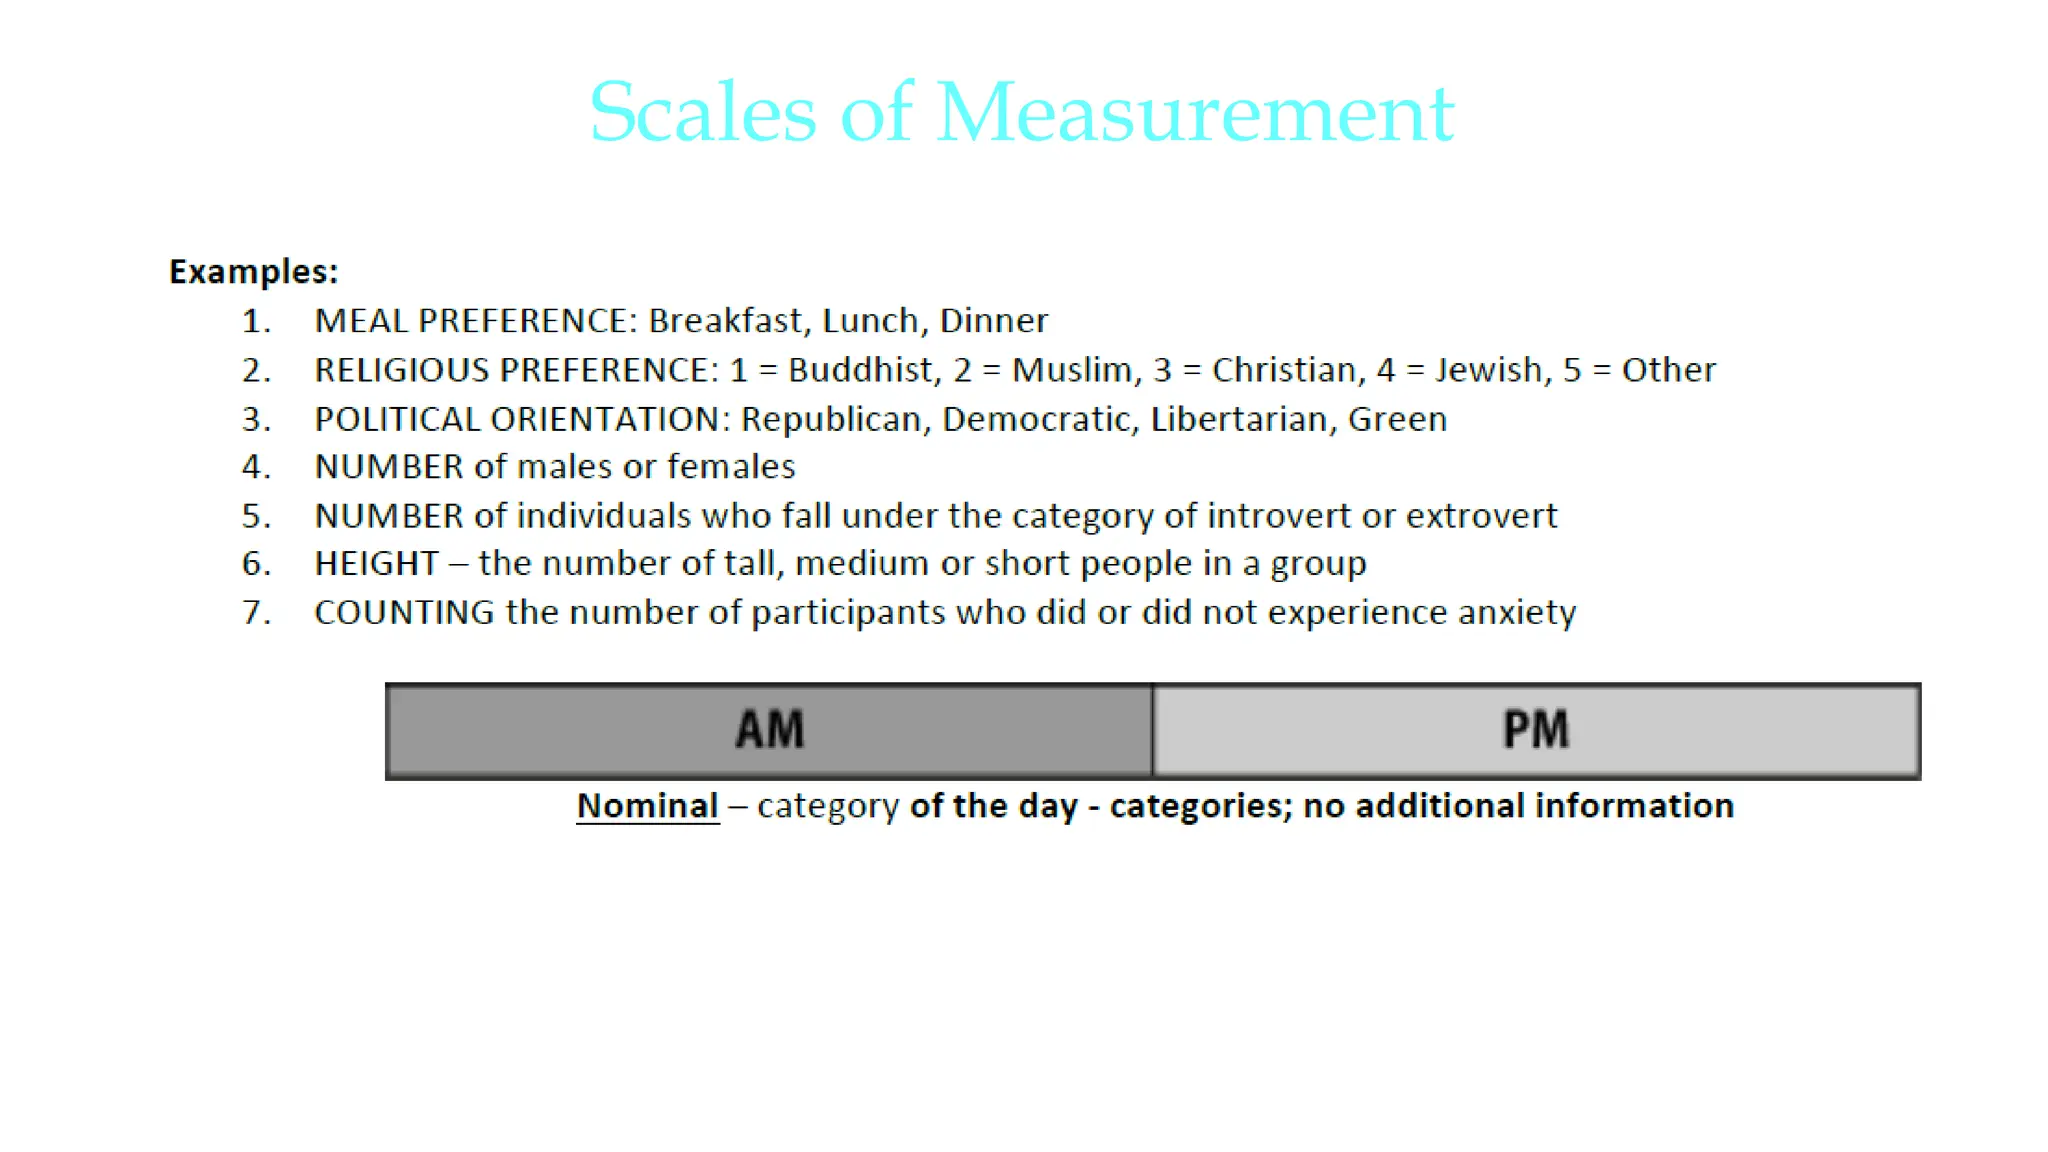
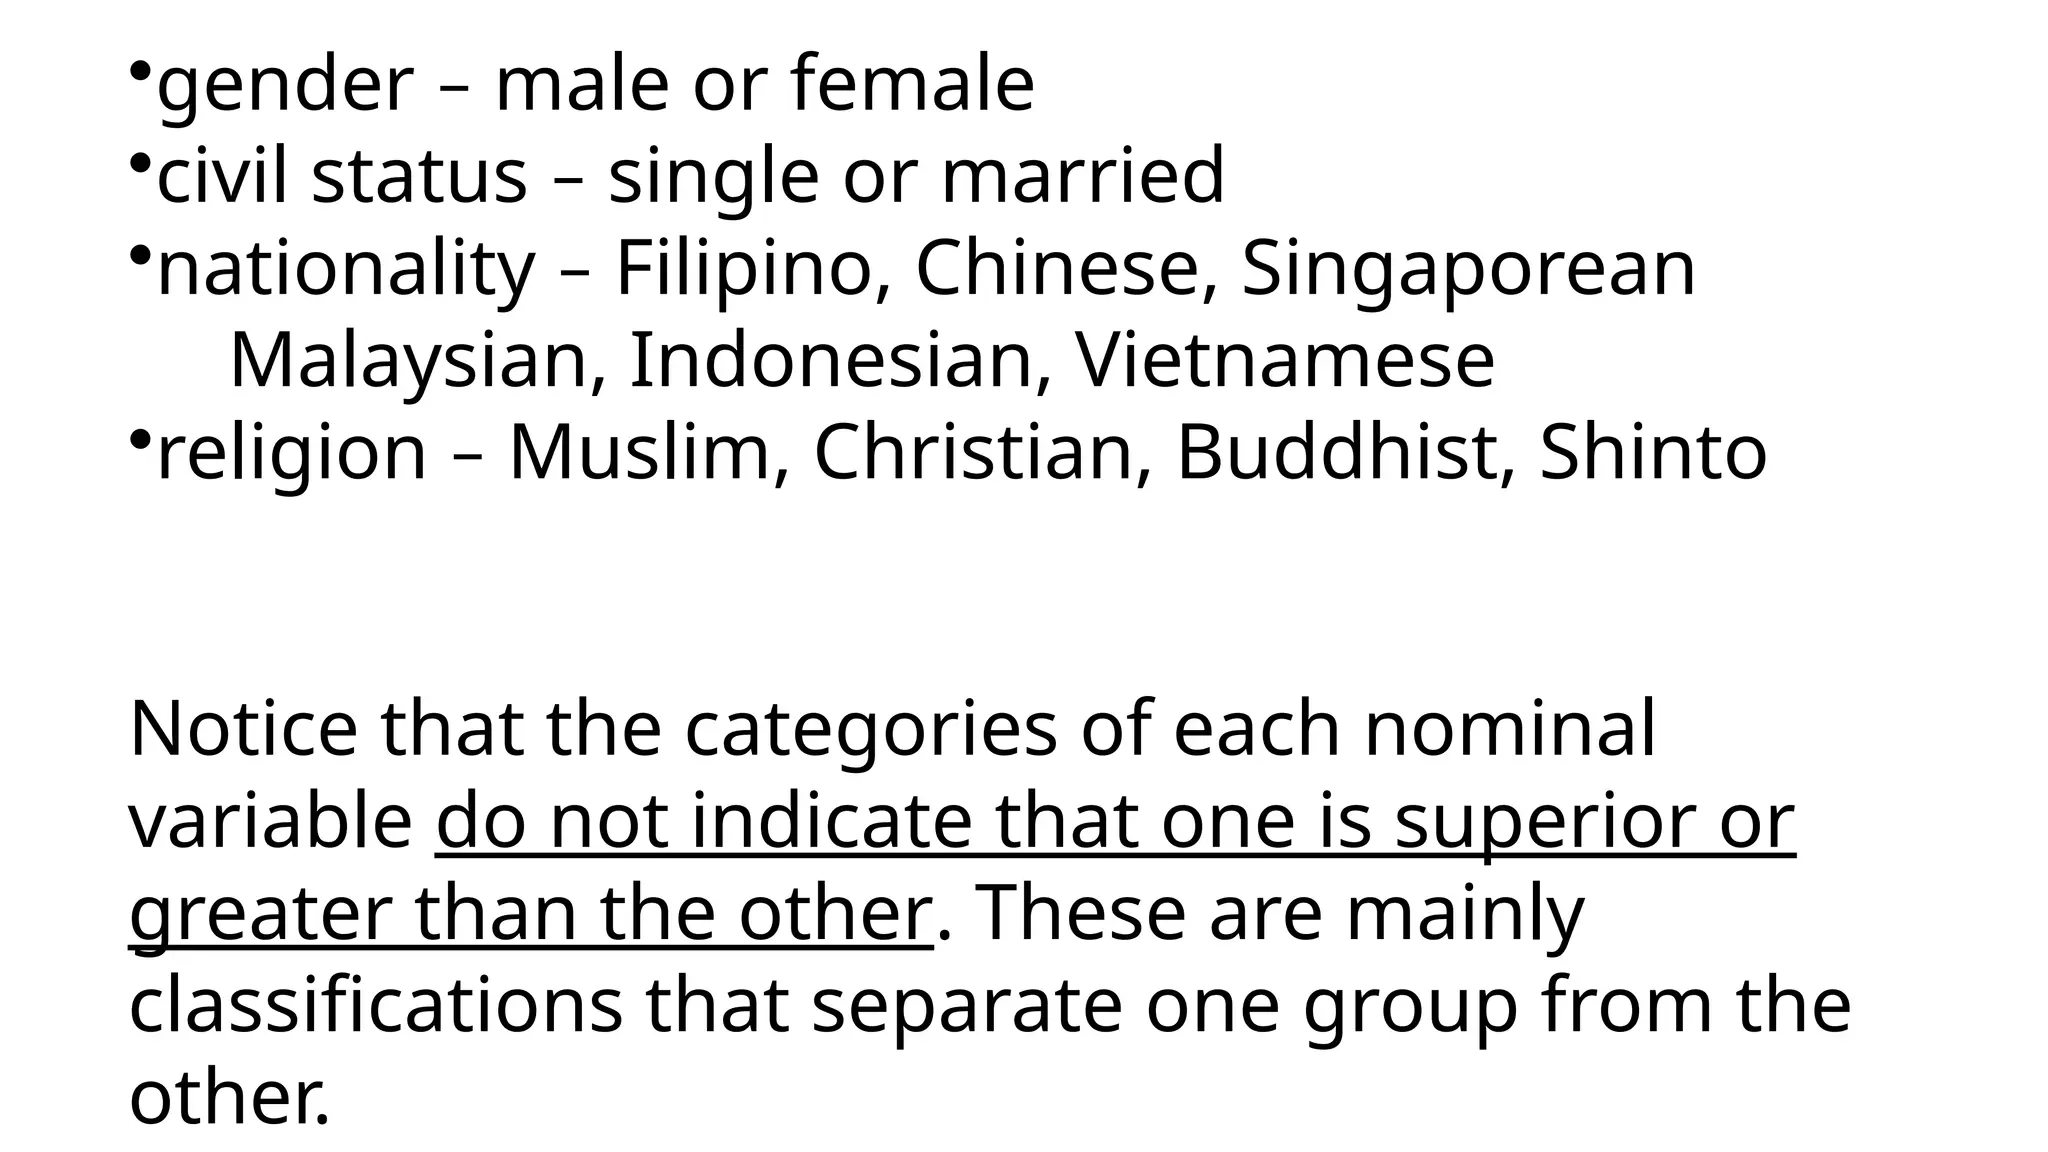
•gender – maleor female
•civil status – single or married
•nationality – Filipino, Chinese, Singaporean
Malaysian, Indonesian, Vietnamese
•religion – Muslim, Christian, Buddhist, Shinto
Notice that the categories of each nominal
variable do not indicate that one is superior or
greater than the other. These are mainly
classifications that separate one group from the
other.
26.
Scales of Measurement
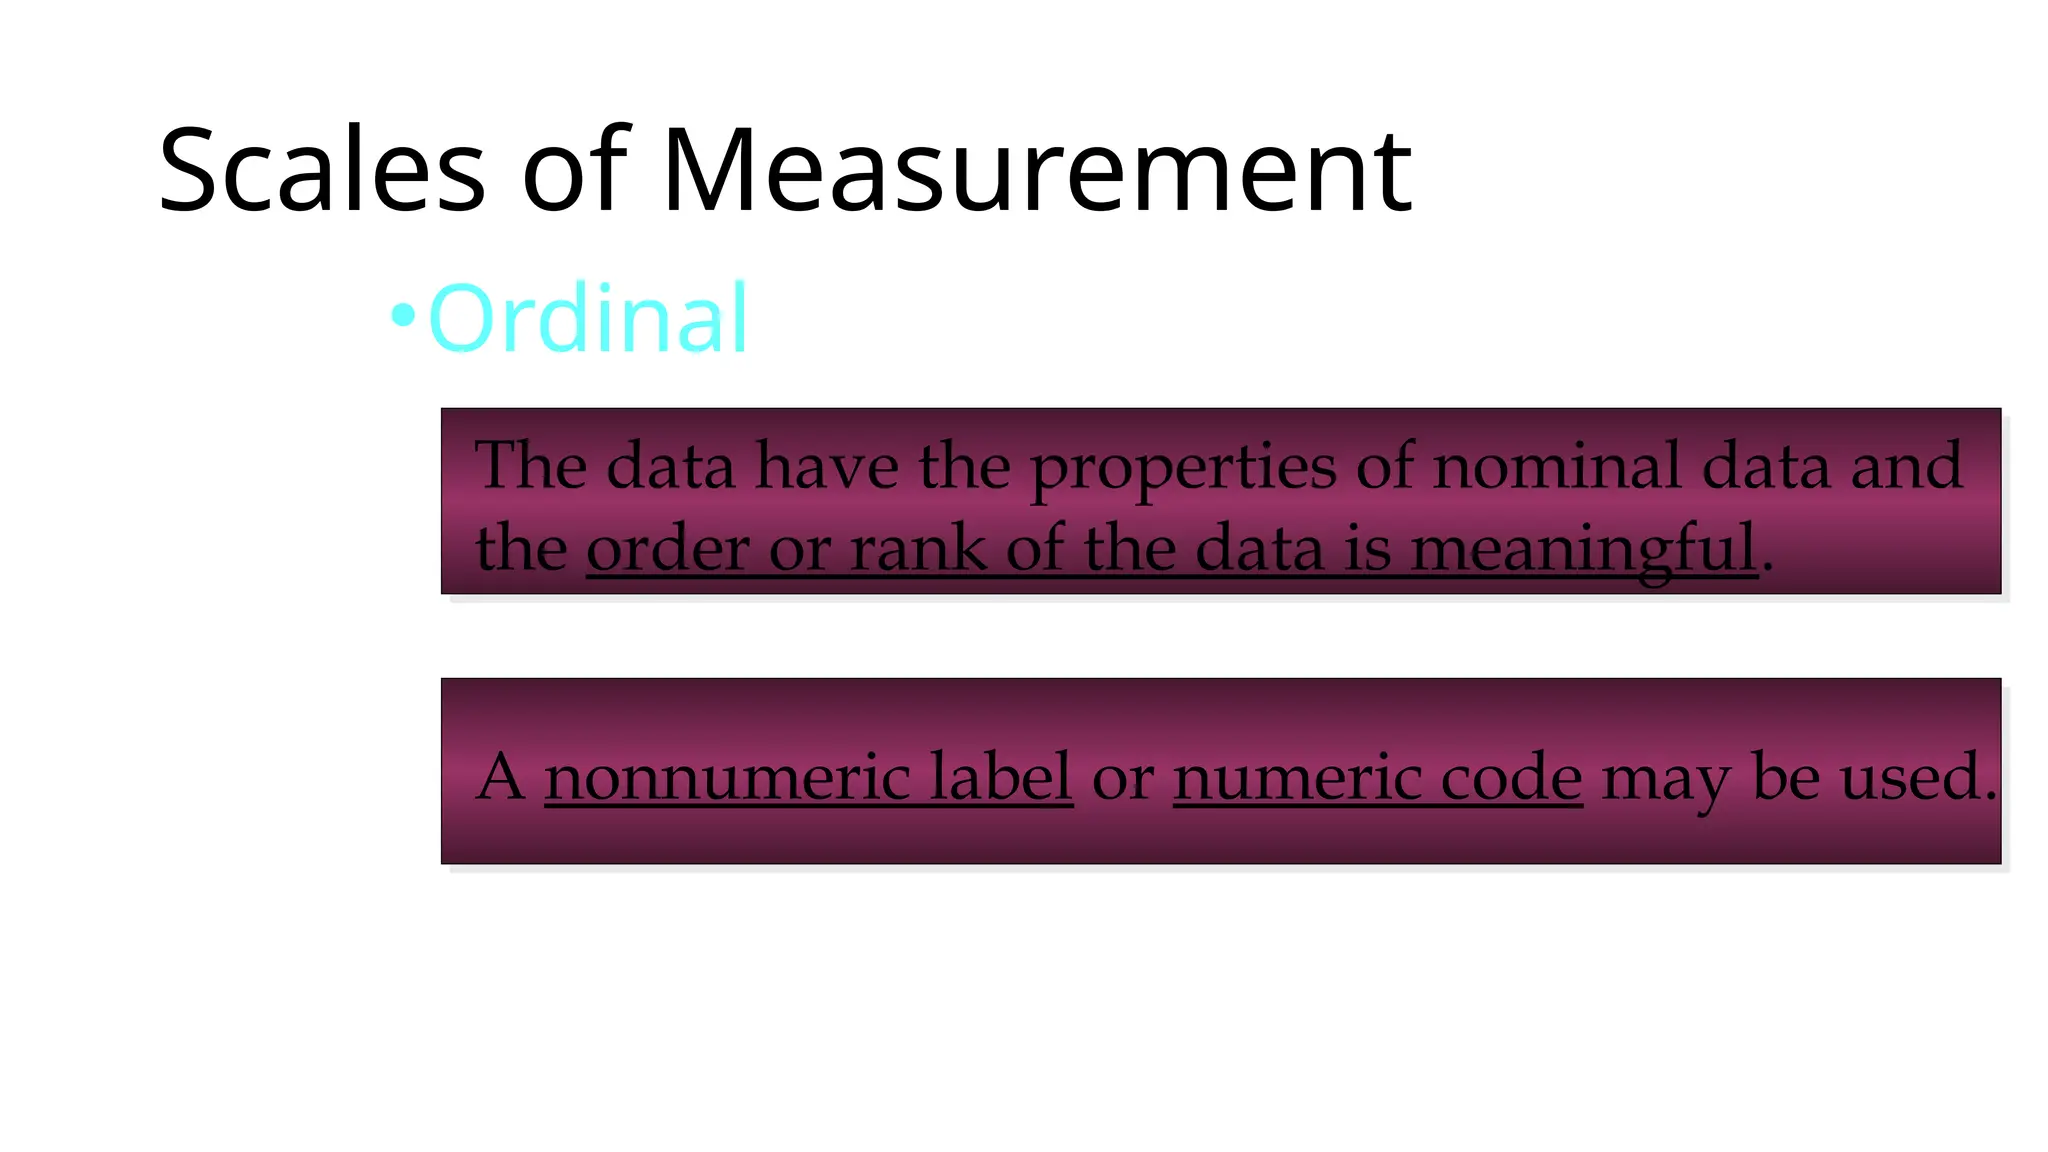
•Ordinal
Anonnumeric label or numeric code may be used.
The data have the properties of nominal data and
the order or rank of the data is meaningful.
27.
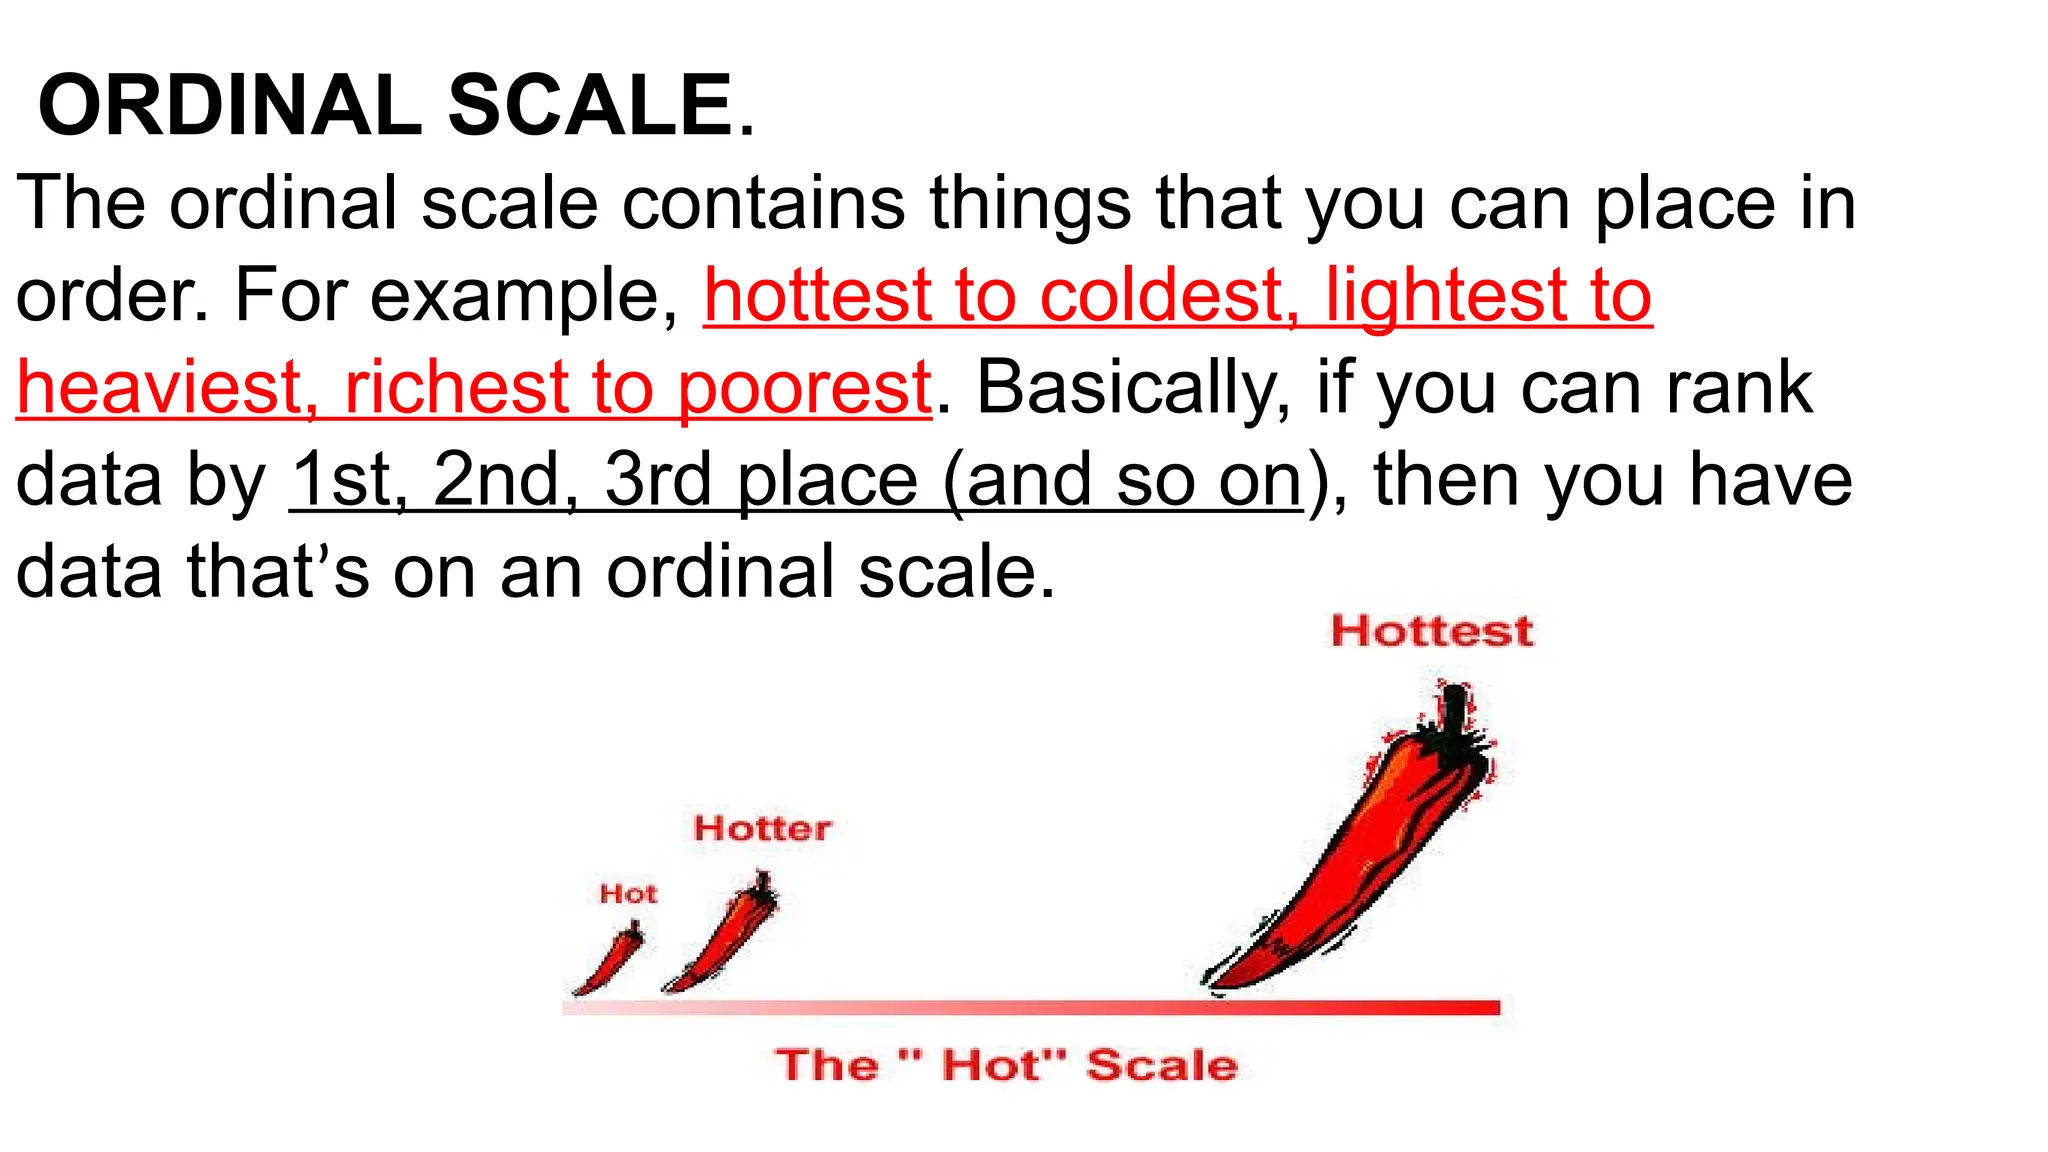
ORDINAL SCALE.
The ordinalscale contains things that you can place in
order. For example, hottest to coldest, lightest to
heaviest, richest to poorest. Basically, if you can rank
data by 1st, 2nd, 3rd place (and so on), then you have
data that’s on an ordinal scale.
28.
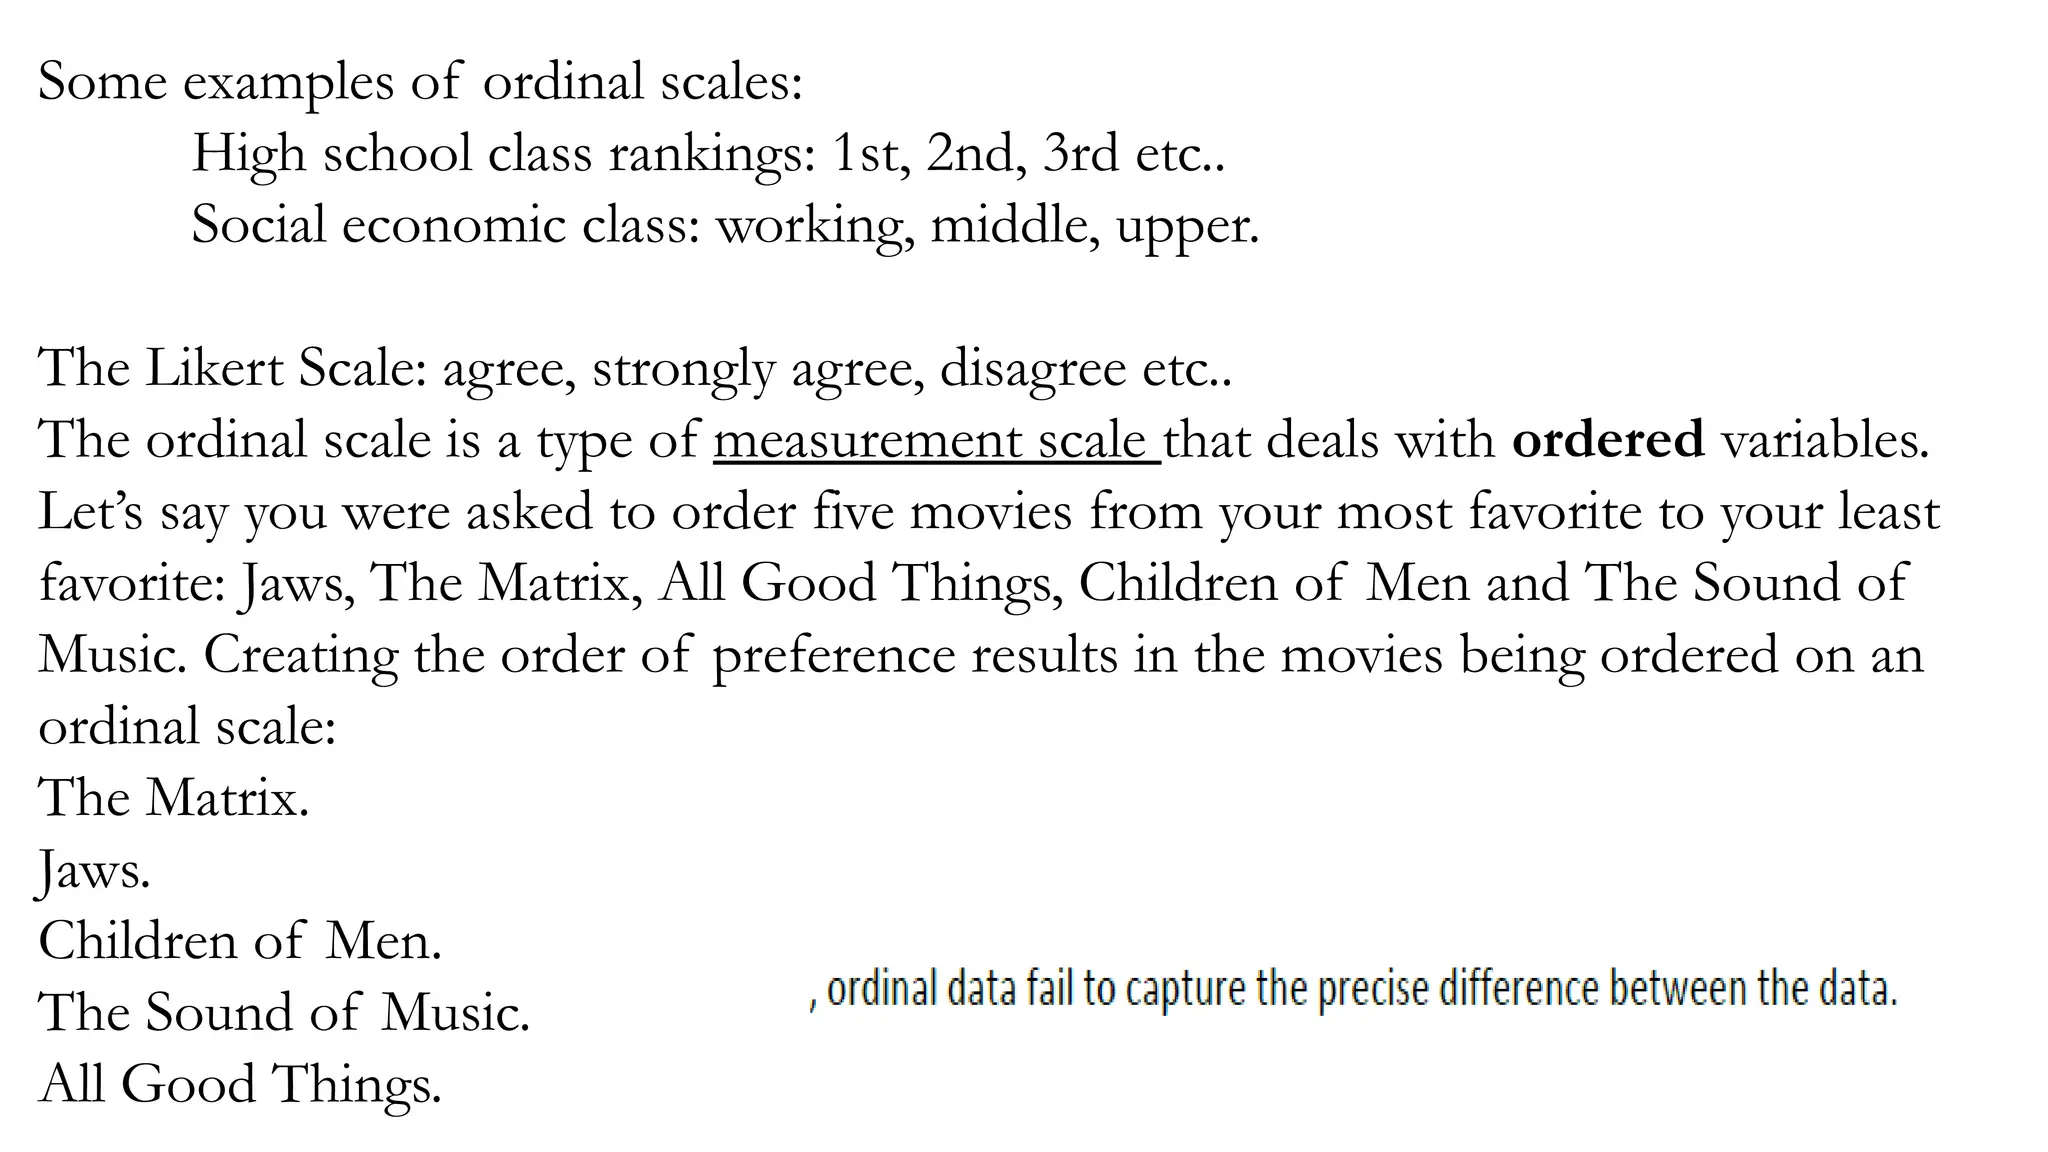
Some examples ofordinal scales:
High school class rankings: 1st, 2nd, 3rd etc..
Social economic class: working, middle, upper.
The Likert Scale: agree, strongly agree, disagree etc..
The ordinal scale is a type of measurement scale that deals with ordered variables.
Let’s say you were asked to order five movies from your most favorite to your least
favorite: Jaws, The Matrix, All Good Things, Children of Men and The Sound of
Music. Creating the order of preference results in the movies being ordered on an
ordinal scale:
The Matrix.
Jaws.
Children of Men.
The Sound of Music.
All Good Things.
29.
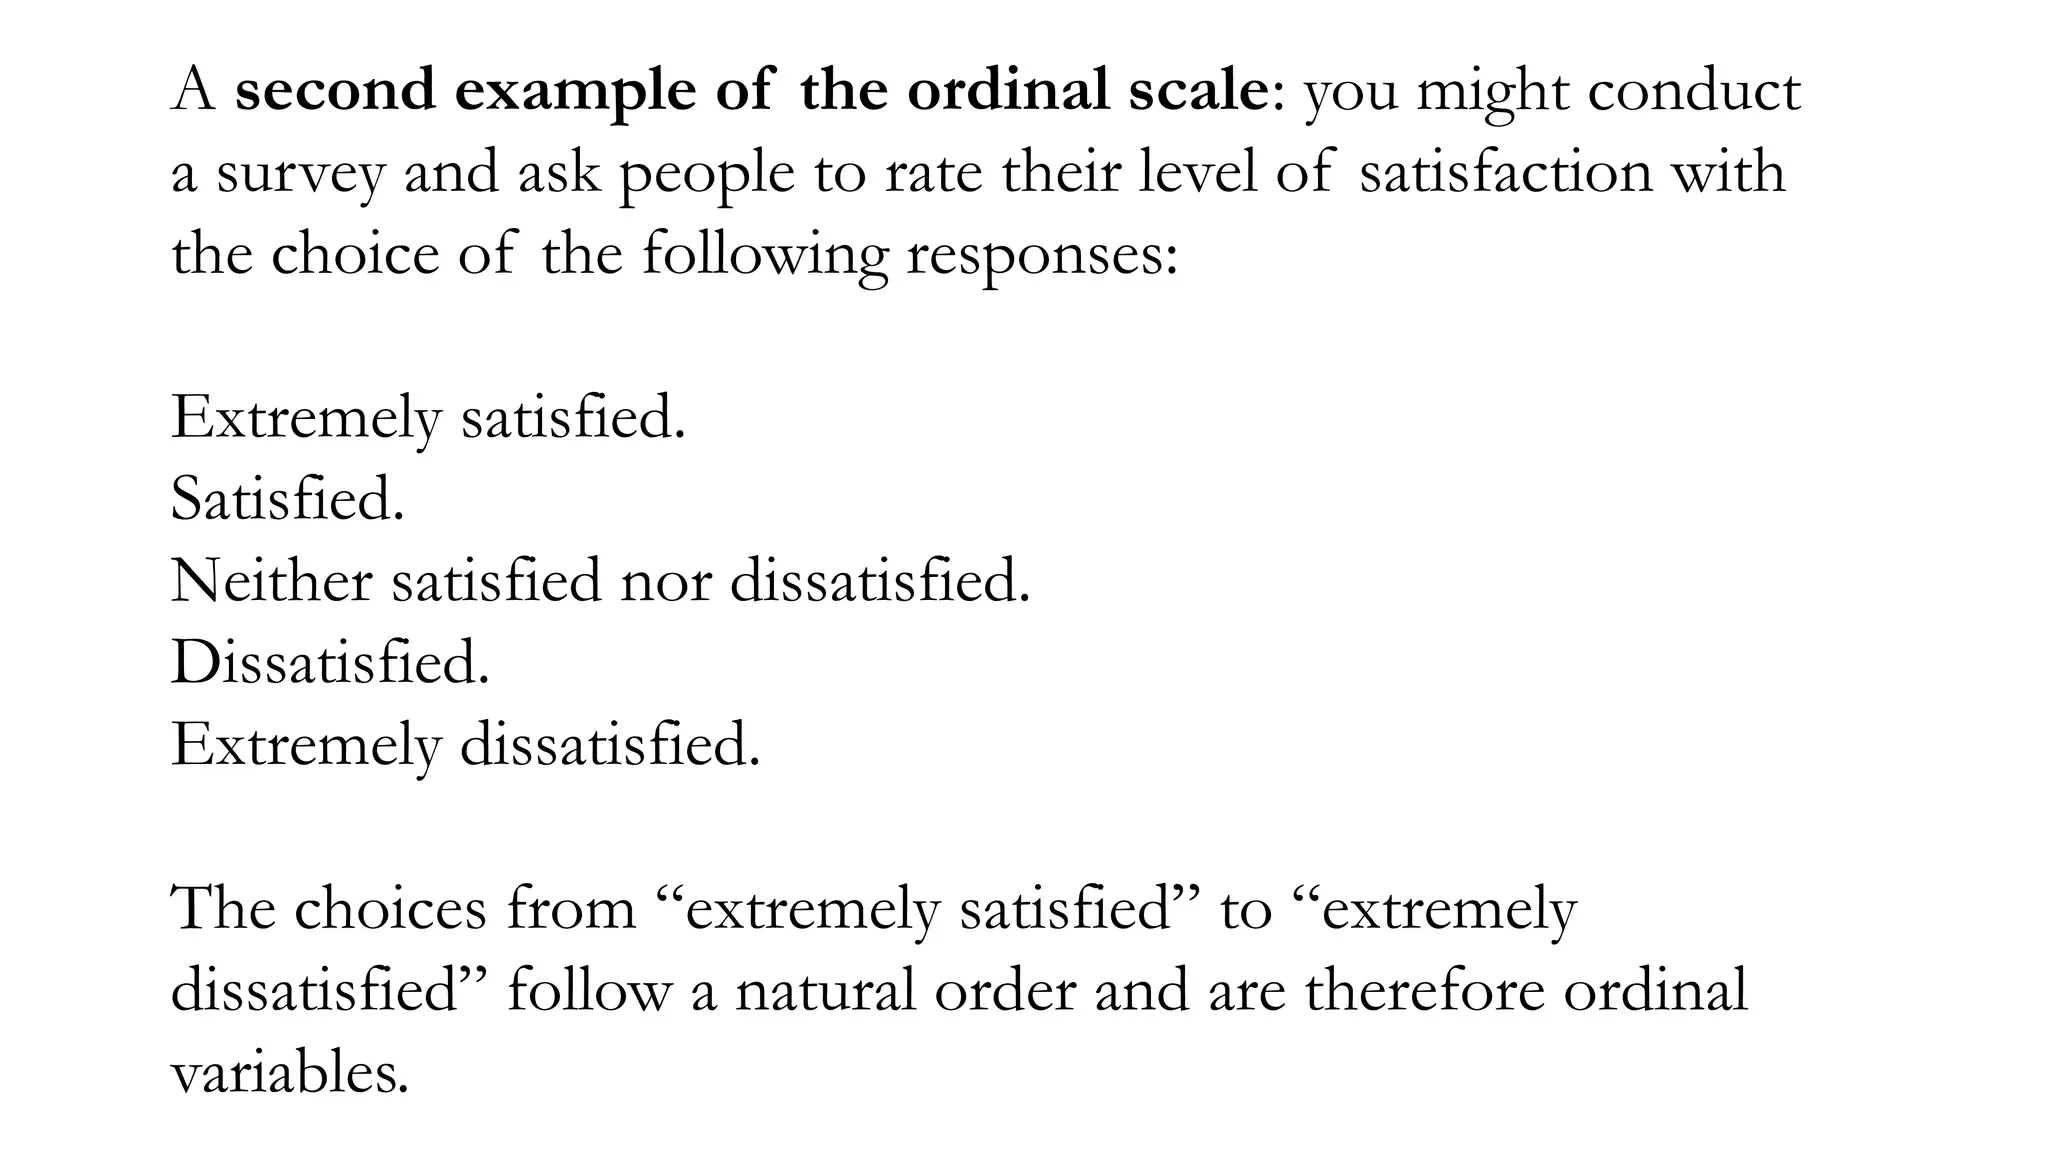
A second exampleof the ordinal scale: you might conduct
a survey and ask people to rate their level of satisfaction with
the choice of the following responses:
Extremely satisfied.
Satisfied.
Neither satisfied nor dissatisfied.
Dissatisfied.
Extremely dissatisfied.
The choices from “extremely satisfied” to “extremely
dissatisfied” follow a natural order and are therefore ordinal
variables.
30.
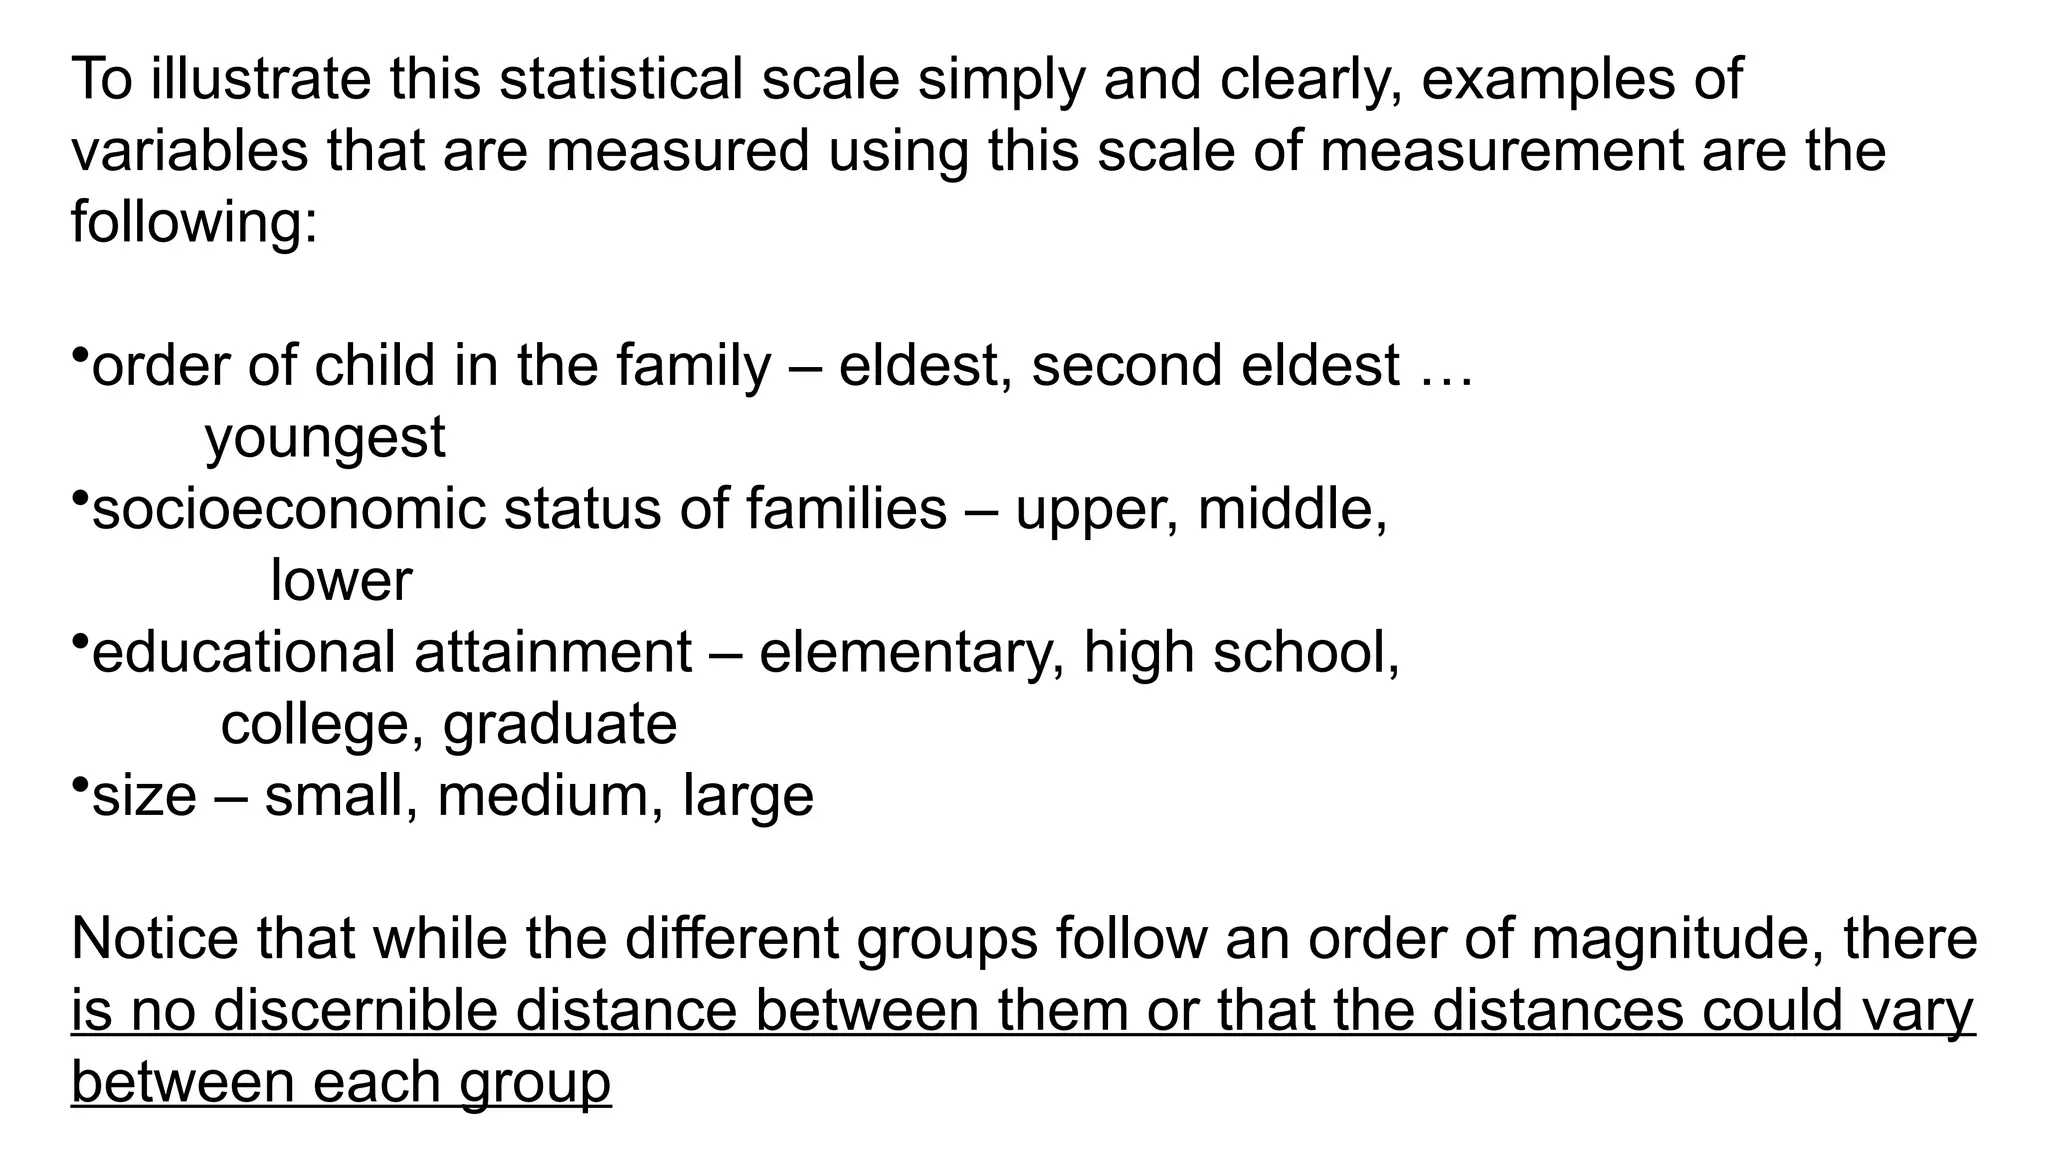
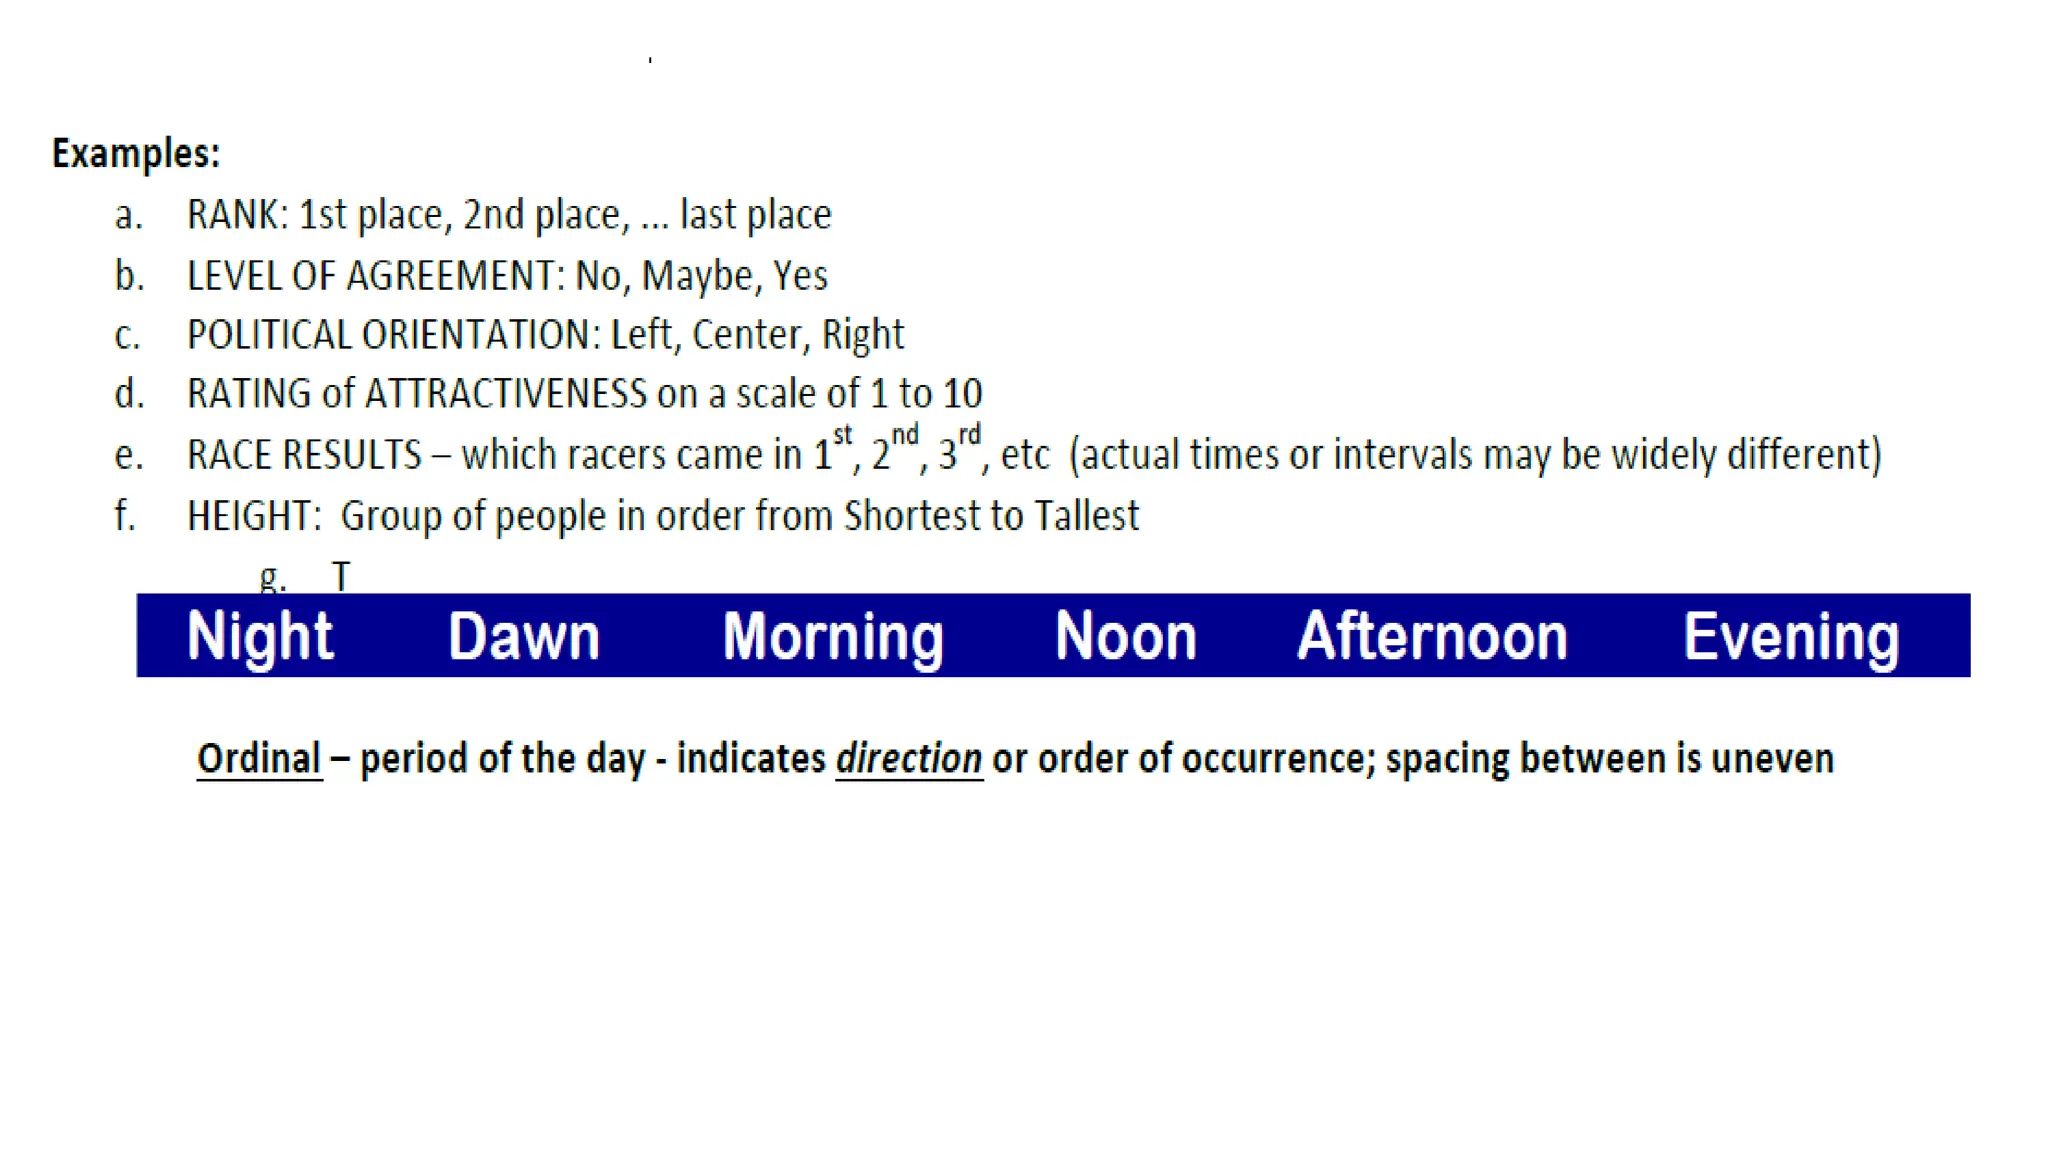
To illustrate thisstatistical scale simply and clearly, examples of
variables that are measured using this scale of measurement are the
following:
•order of child in the family – eldest, second eldest …
youngest
•socioeconomic status of families – upper, middle,
lower
•educational attainment – elementary, high school,
college, graduate
•size – small, medium, large
Notice that while the different groups follow an order of magnitude, there
is no discernible distance between them or that the distances could vary
between each group
32.
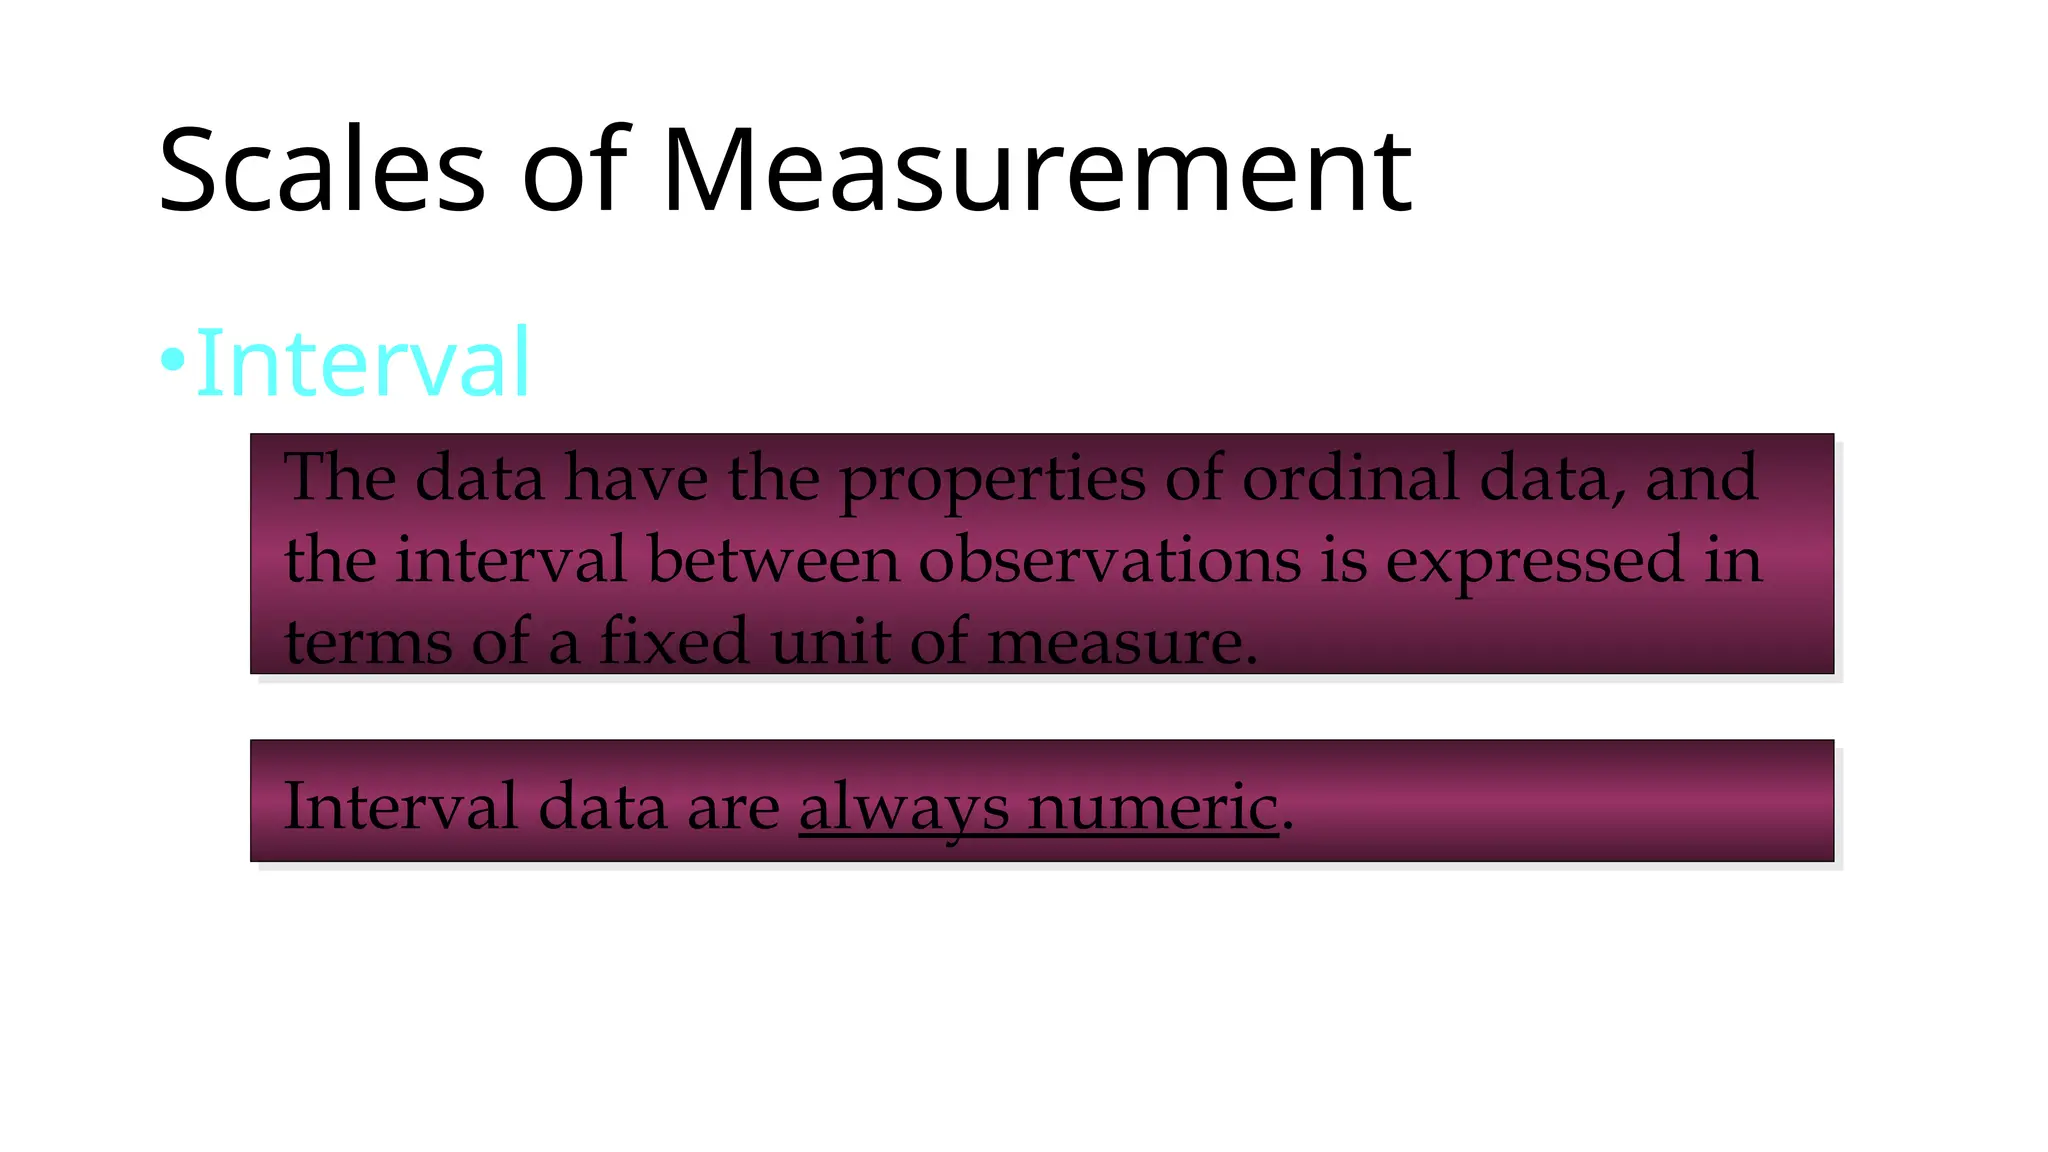
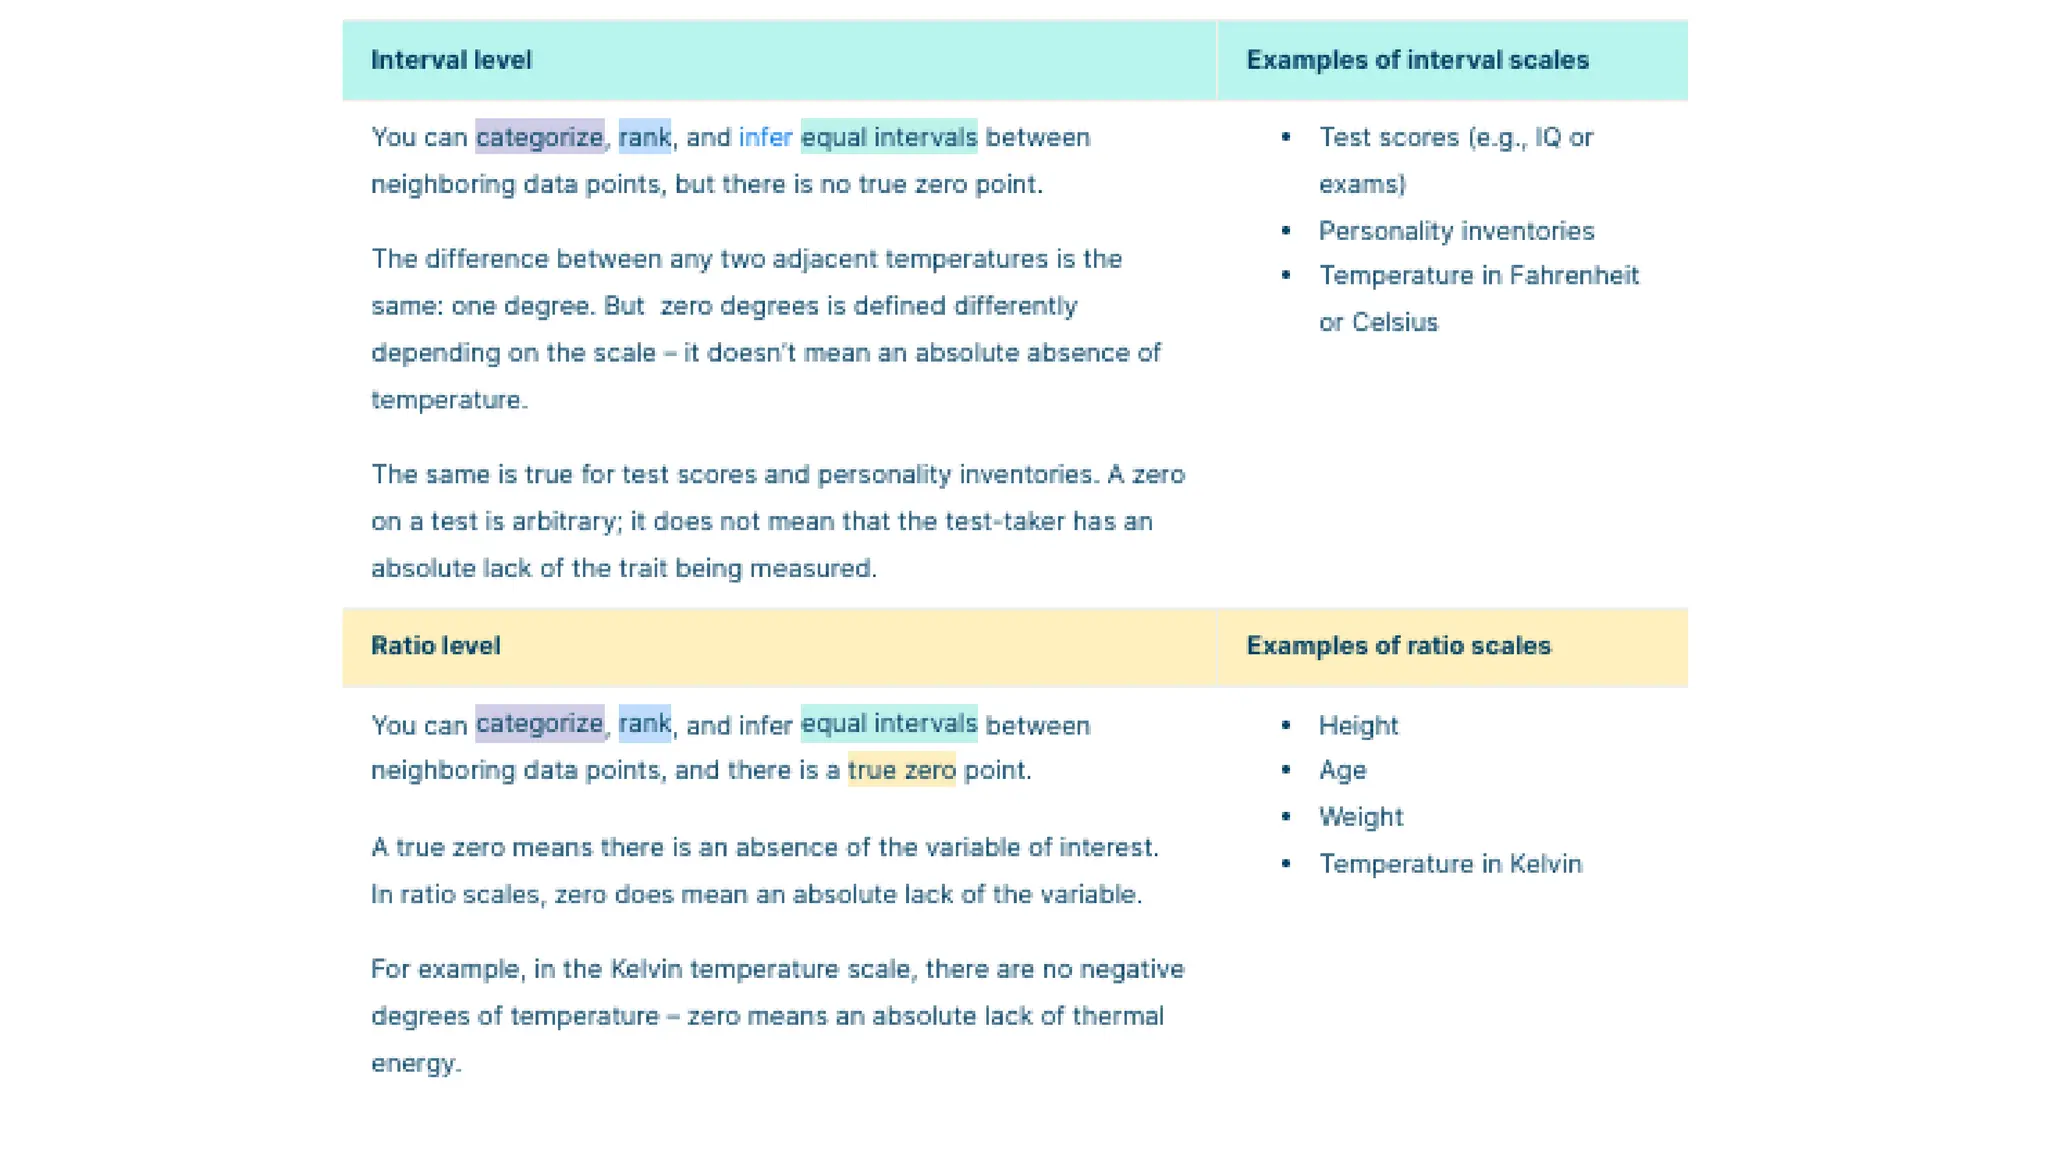
Scales of Measurement
•Interval
Intervaldata are always numeric.
The data have the properties of ordinal data, and
the interval between observations is expressed in
terms of a fixed unit of measure.
33.
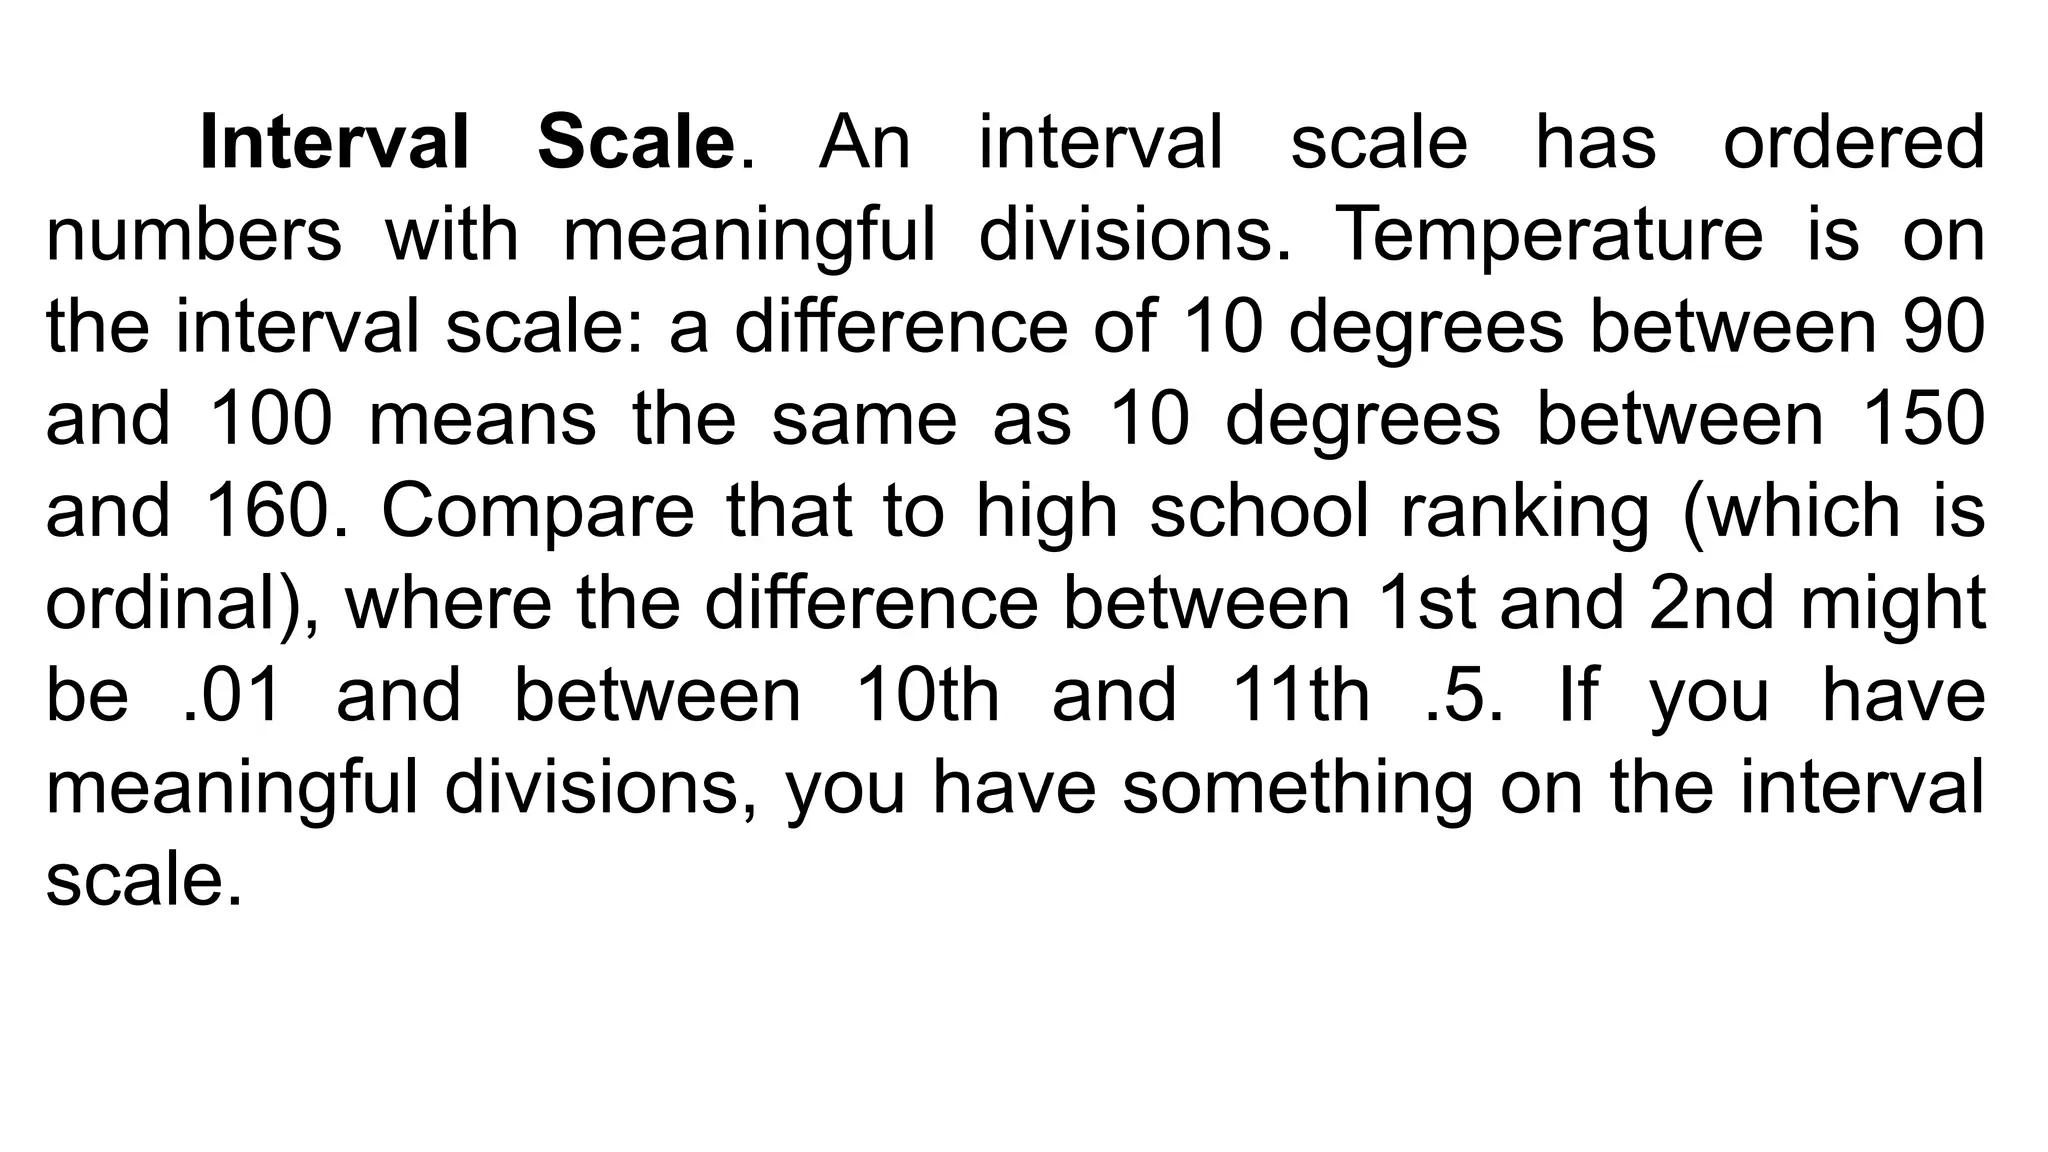
Interval Scale. Aninterval scale has ordered
numbers with meaningful divisions. Temperature is on
the interval scale: a difference of 10 degrees between 90
and 100 means the same as 10 degrees between 150
and 160. Compare that to high school ranking (which is
ordinal), where the difference between 1st and 2nd might
be .01 and between 10th and 11th .5. If you have
meaningful divisions, you have something on the interval
scale.
34.
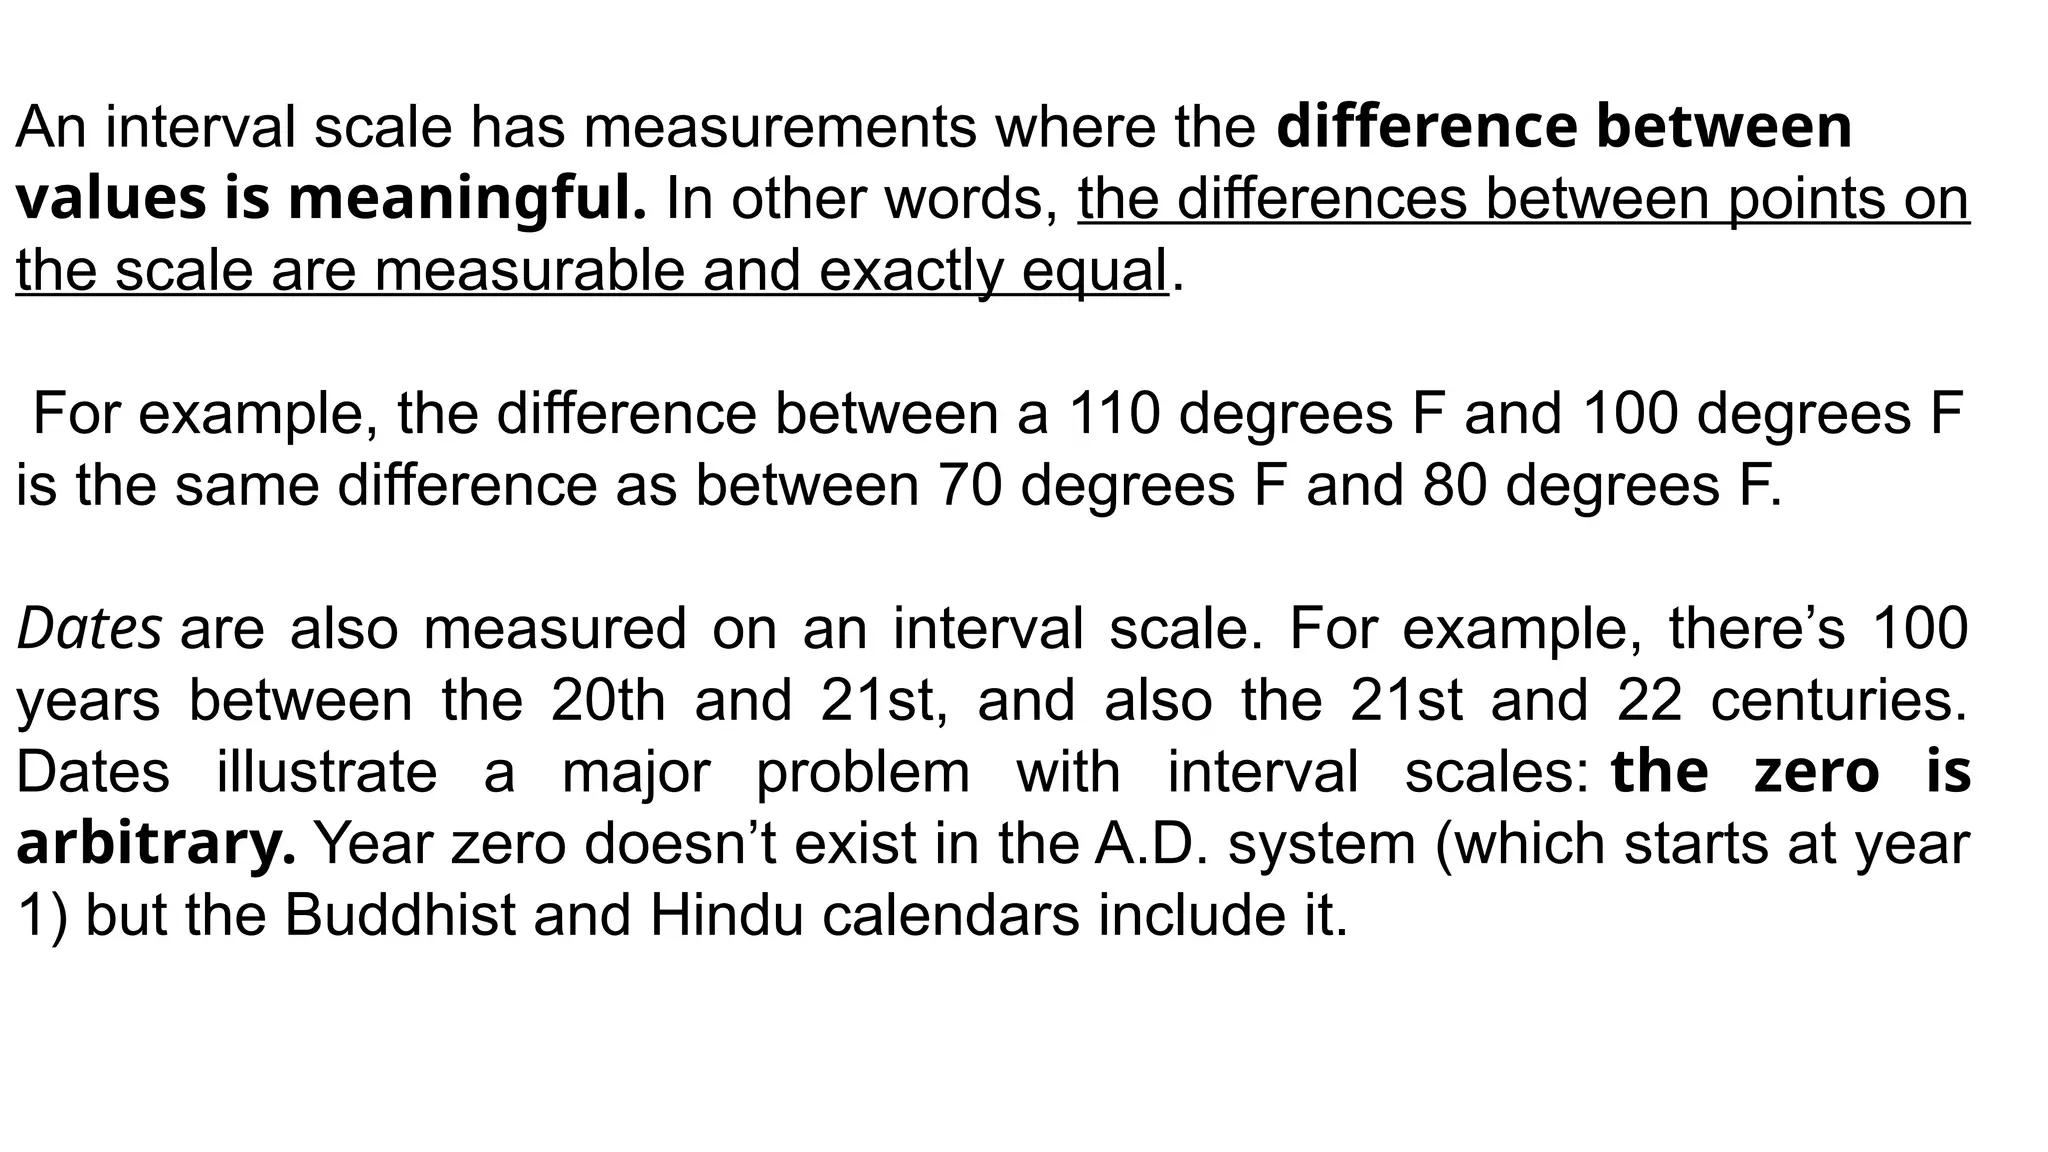
An interval scalehas measurements where the difference between
values is meaningful. In other words, the differences between points on
the scale are measurable and exactly equal.
For example, the difference between a 110 degrees F and 100 degrees F
is the same difference as between 70 degrees F and 80 degrees F.
Dates are also measured on an interval scale. For example, there’s 100
years between the 20th and 21st, and also the 21st and 22 centuries.
Dates illustrate a major problem with interval scales: the zero is
arbitrary. Year zero doesn’t exist in the A.D. system (which starts at year
1) but the Buddhist and Hindu calendars include it.
35.
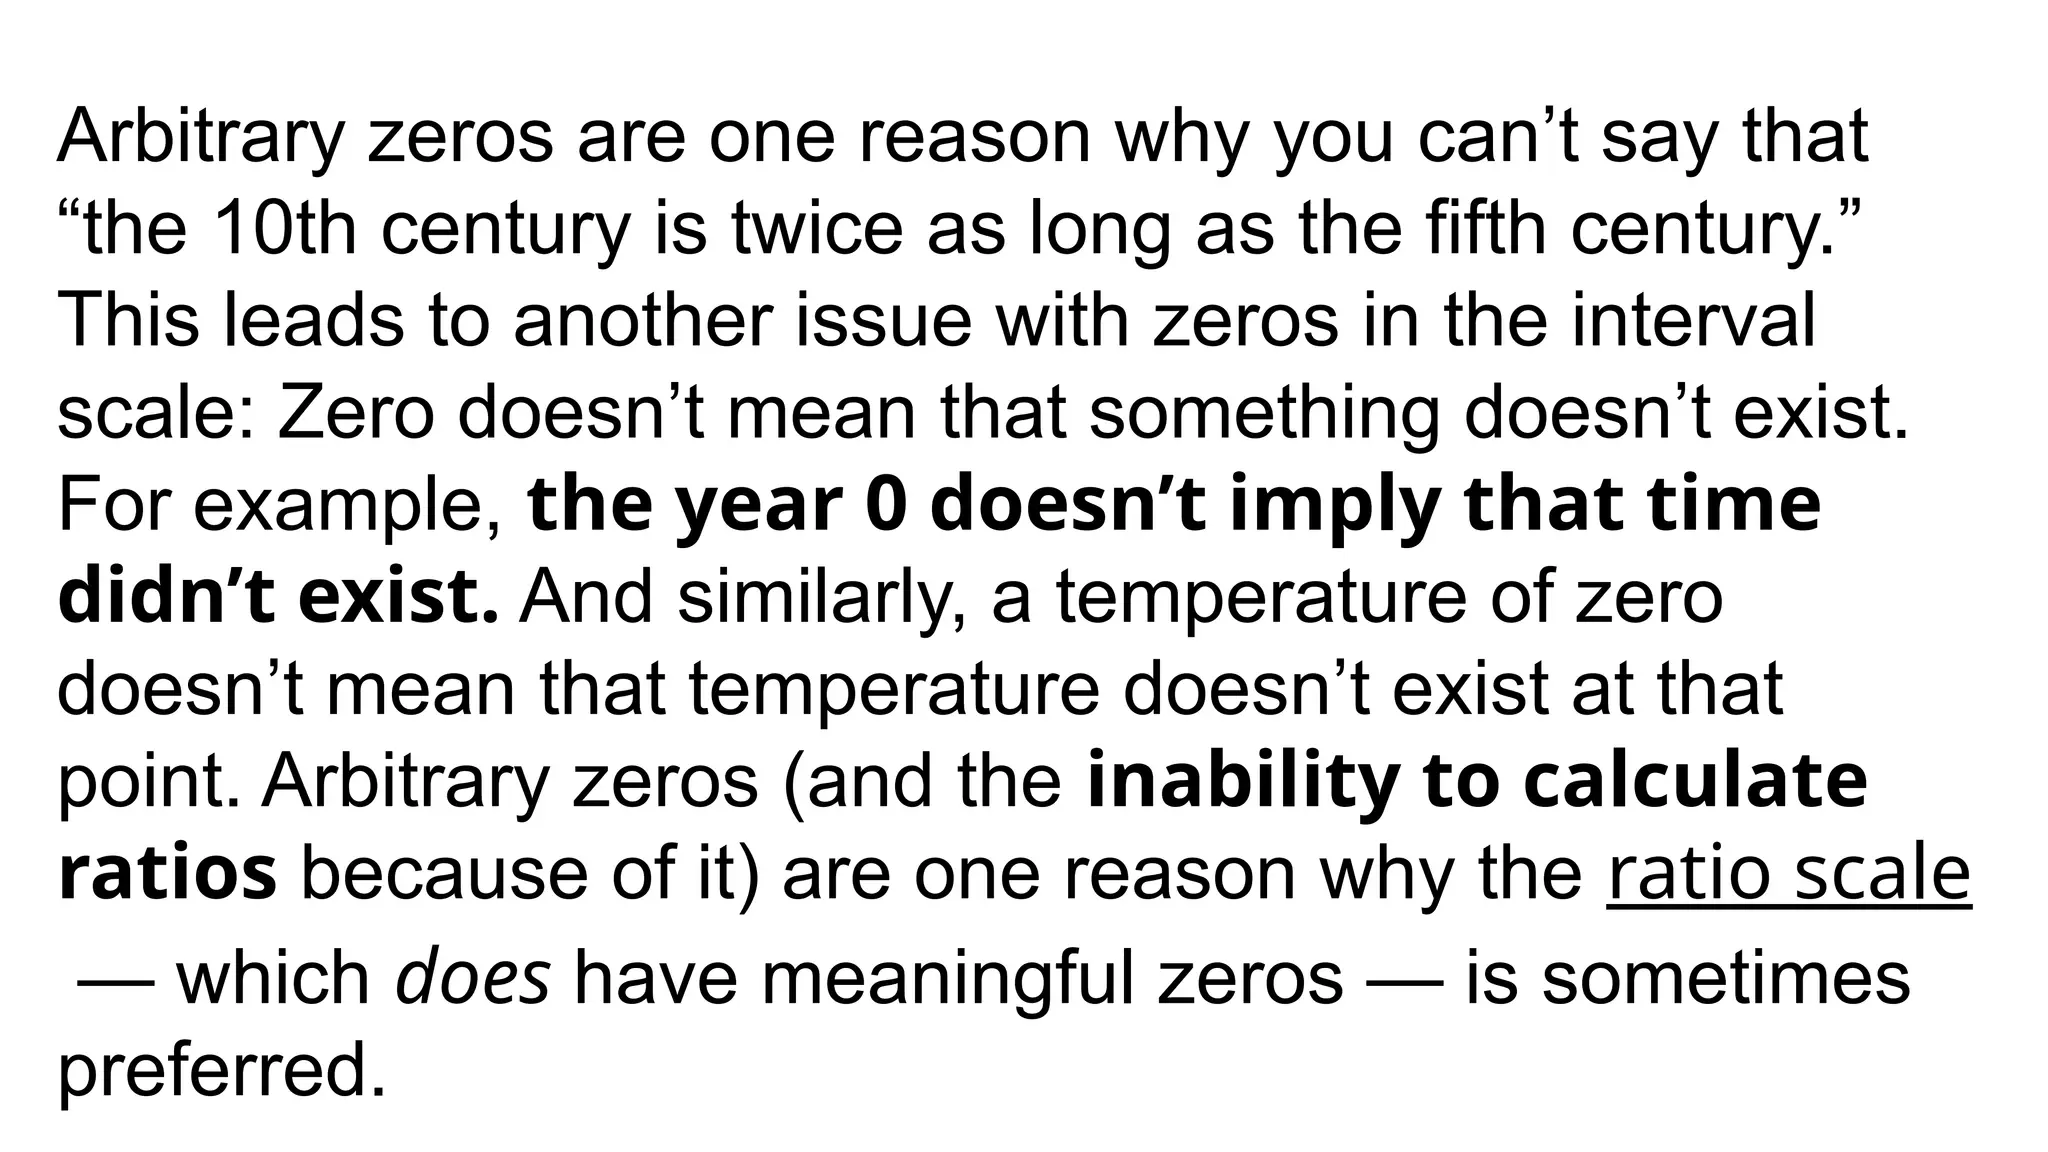
Arbitrary zeros areone reason why you can’t say that
“the 10th century is twice as long as the fifth century.”
This leads to another issue with zeros in the interval
scale: Zero doesn’t mean that something doesn’t exist.
For example, the year 0 doesn’t imply that time
didn’t exist. And similarly, a temperature of zero
doesn’t mean that temperature doesn’t exist at that
point. Arbitrary zeros (and the inability to calculate
ratios because of it) are one reason why the ratio scale
— which does have meaningful zeros — is sometimes
preferred.
36.
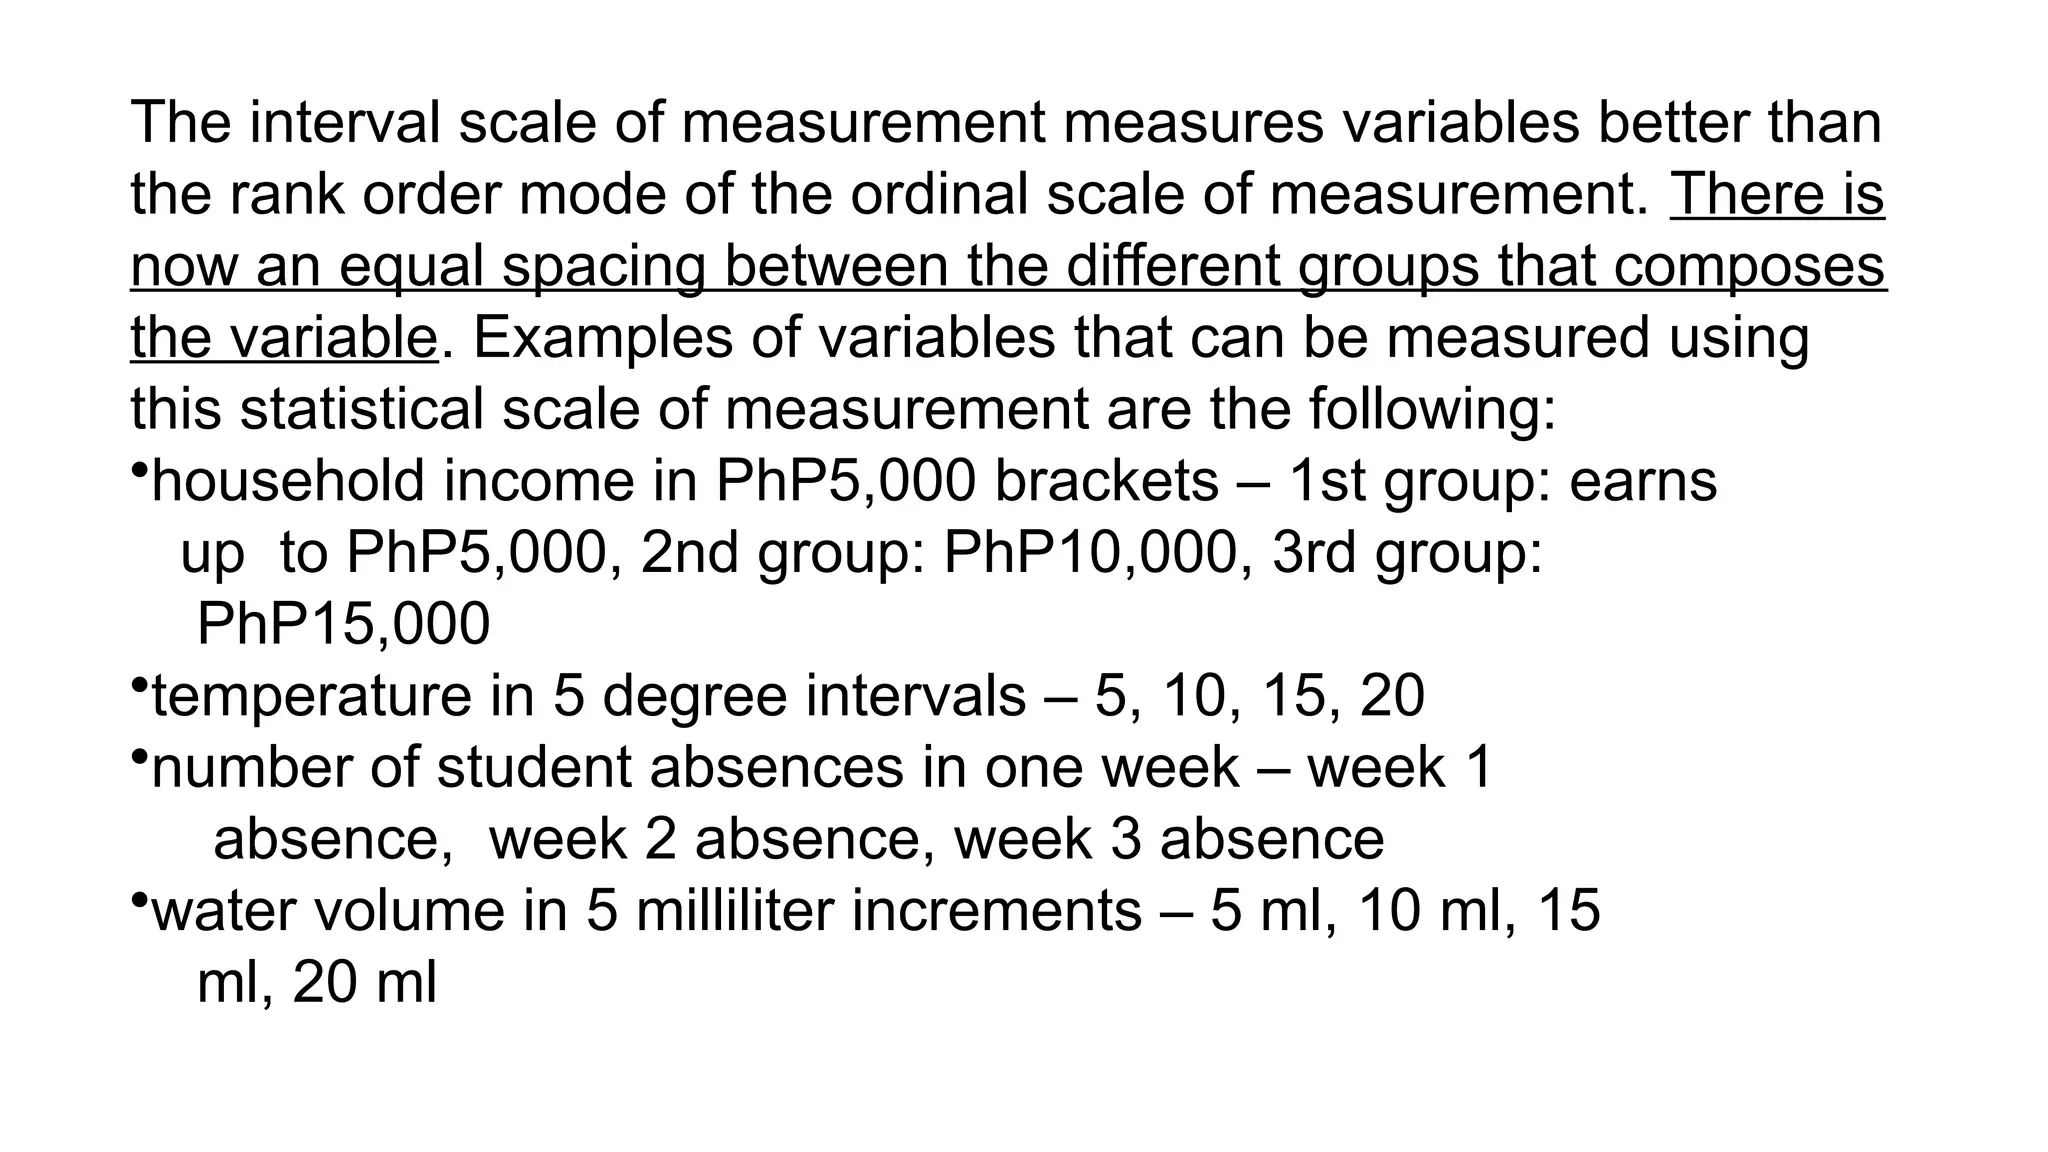
The interval scaleof measurement measures variables better than
the rank order mode of the ordinal scale of measurement. There is
now an equal spacing between the different groups that composes
the variable. Examples of variables that can be measured using
this statistical scale of measurement are the following:
•household income in PhP5,000 brackets – 1st group: earns
up to PhP5,000, 2nd group: PhP10,000, 3rd group:
PhP15,000
•temperature in 5 degree intervals – 5, 10, 15, 20
•number of student absences in one week – week 1
absence, week 2 absence, week 3 absence
•water volume in 5 milliliter increments – 5 ml, 10 ml, 15
ml, 20 ml
37.
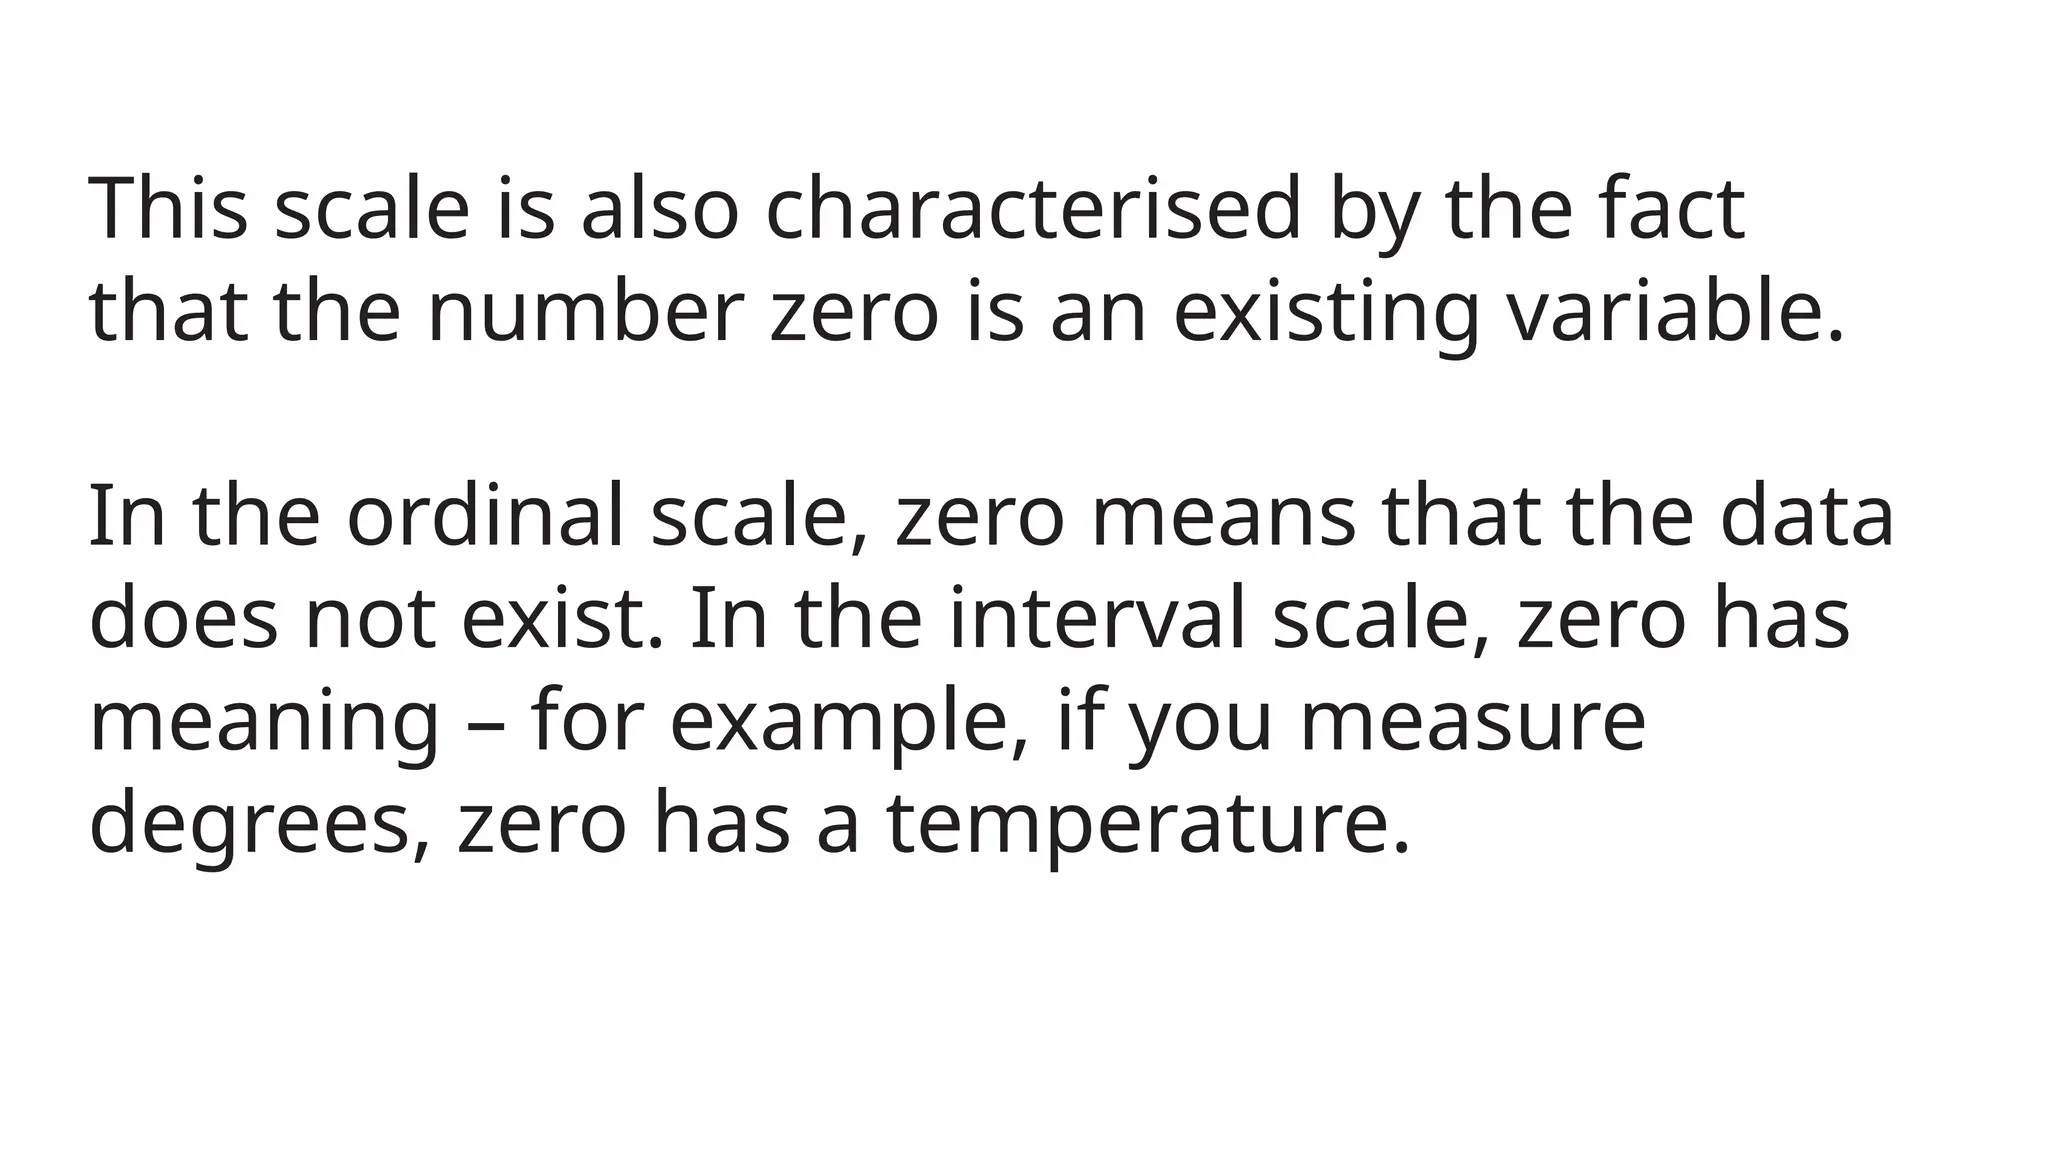
This scale isalso characterised by the fact
that the number zero is an existing variable.
In the ordinal scale, zero means that the data
does not exist. In the interval scale, zero has
meaning – for example, if you measure
degrees, zero has a temperature.
38.
Scales of Measurement
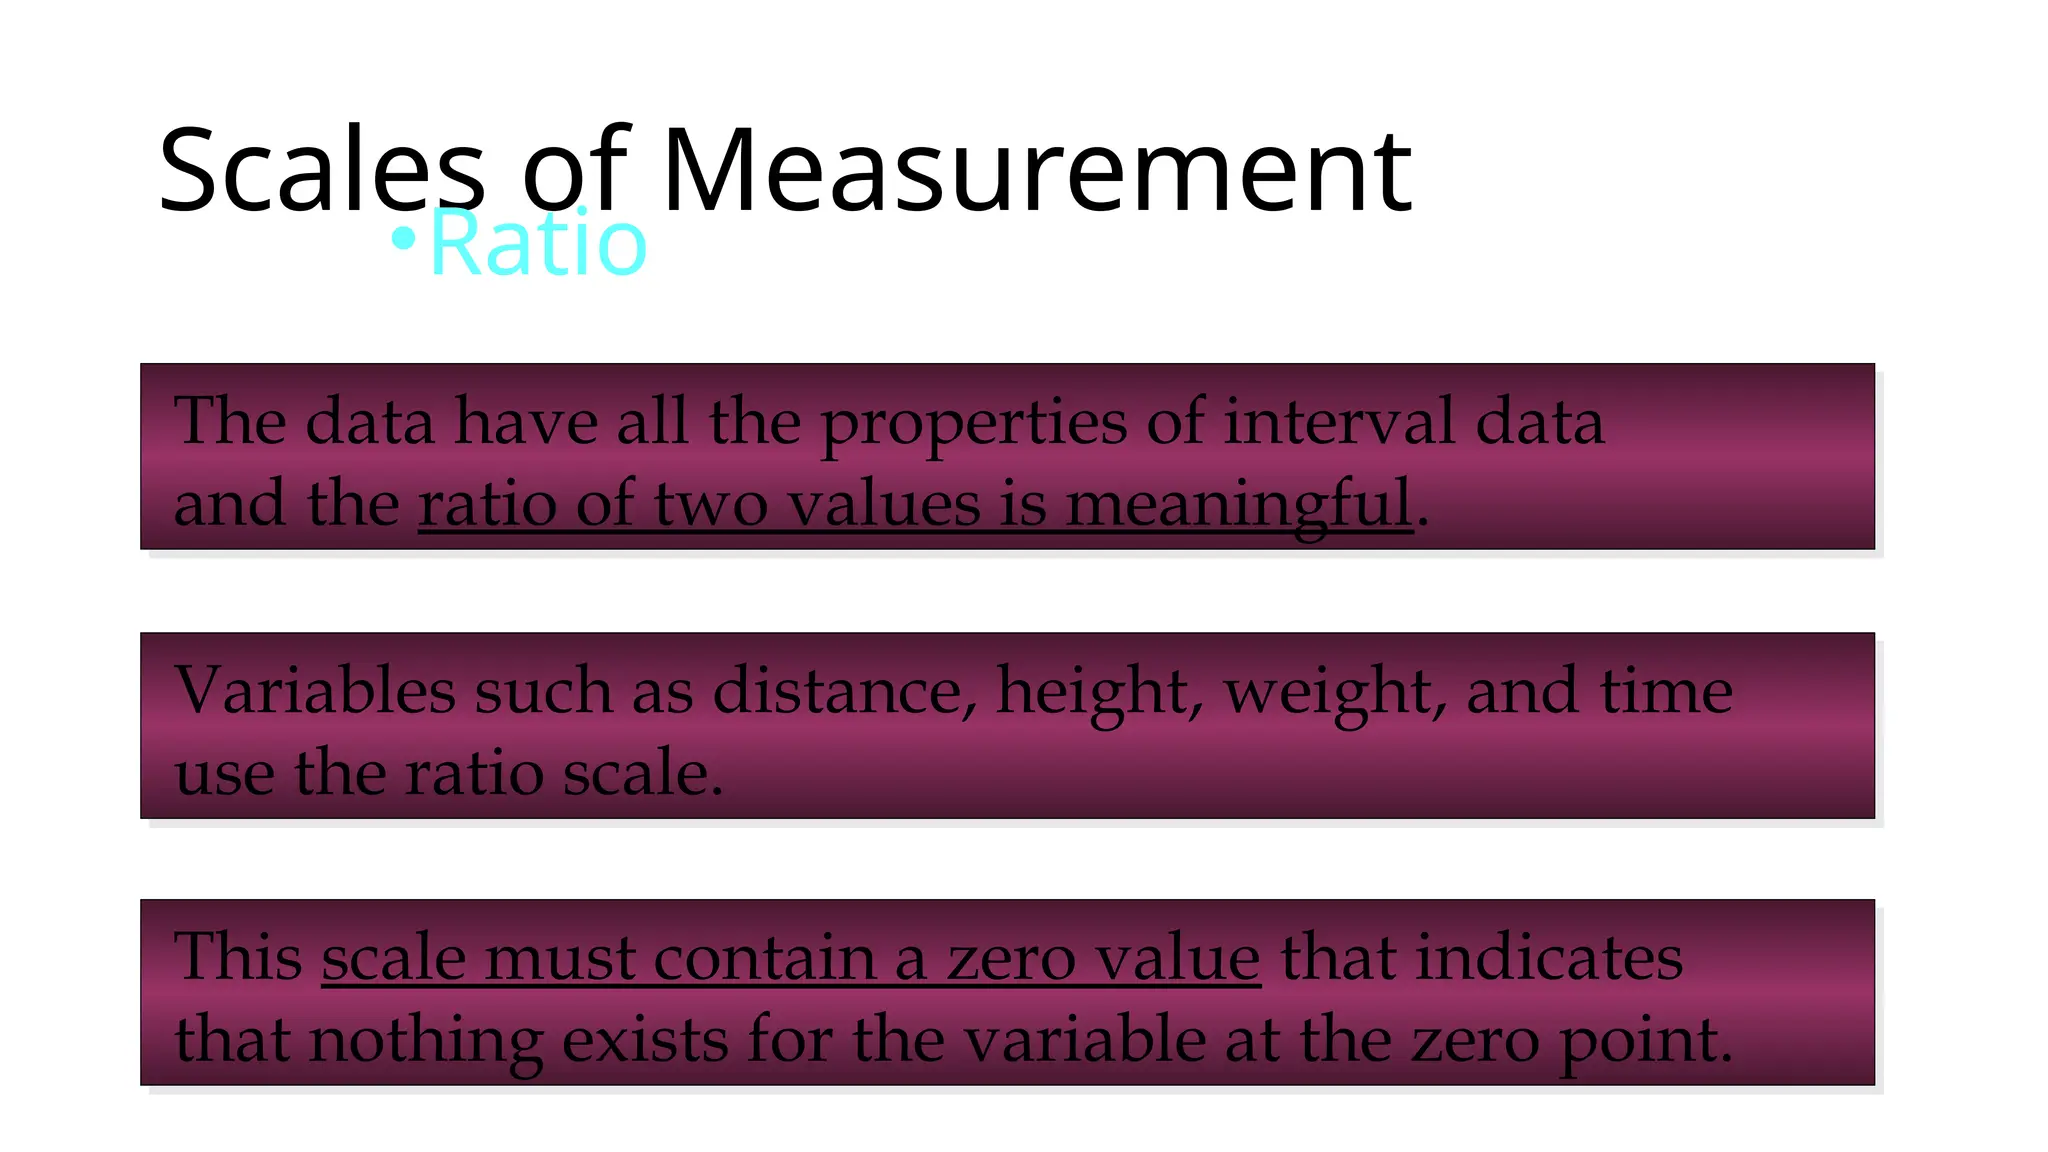
•Ratio
Thedata have all the properties of interval data
and the ratio of two values is meaningful.
Variables such as distance, height, weight, and time
use the ratio scale.
This scale must contain a zero value that indicates
that nothing exists for the variable at the zero point.
39.
A ratio scalehas all the properties of an interval scale. Ratio
data on the ratio scale has measurable intervals.
For example, the difference between a height of six feet
and five feet is the same as the interval between two feet
and three feet. Where the ratio scale differs from the interval
scale is that it also has a meaningful zero.
The zero in a ratio scale means that something doesn’t
exist. For example, the zero in the Kelvin temperature scale
means that heat does not exist at zero.
40.
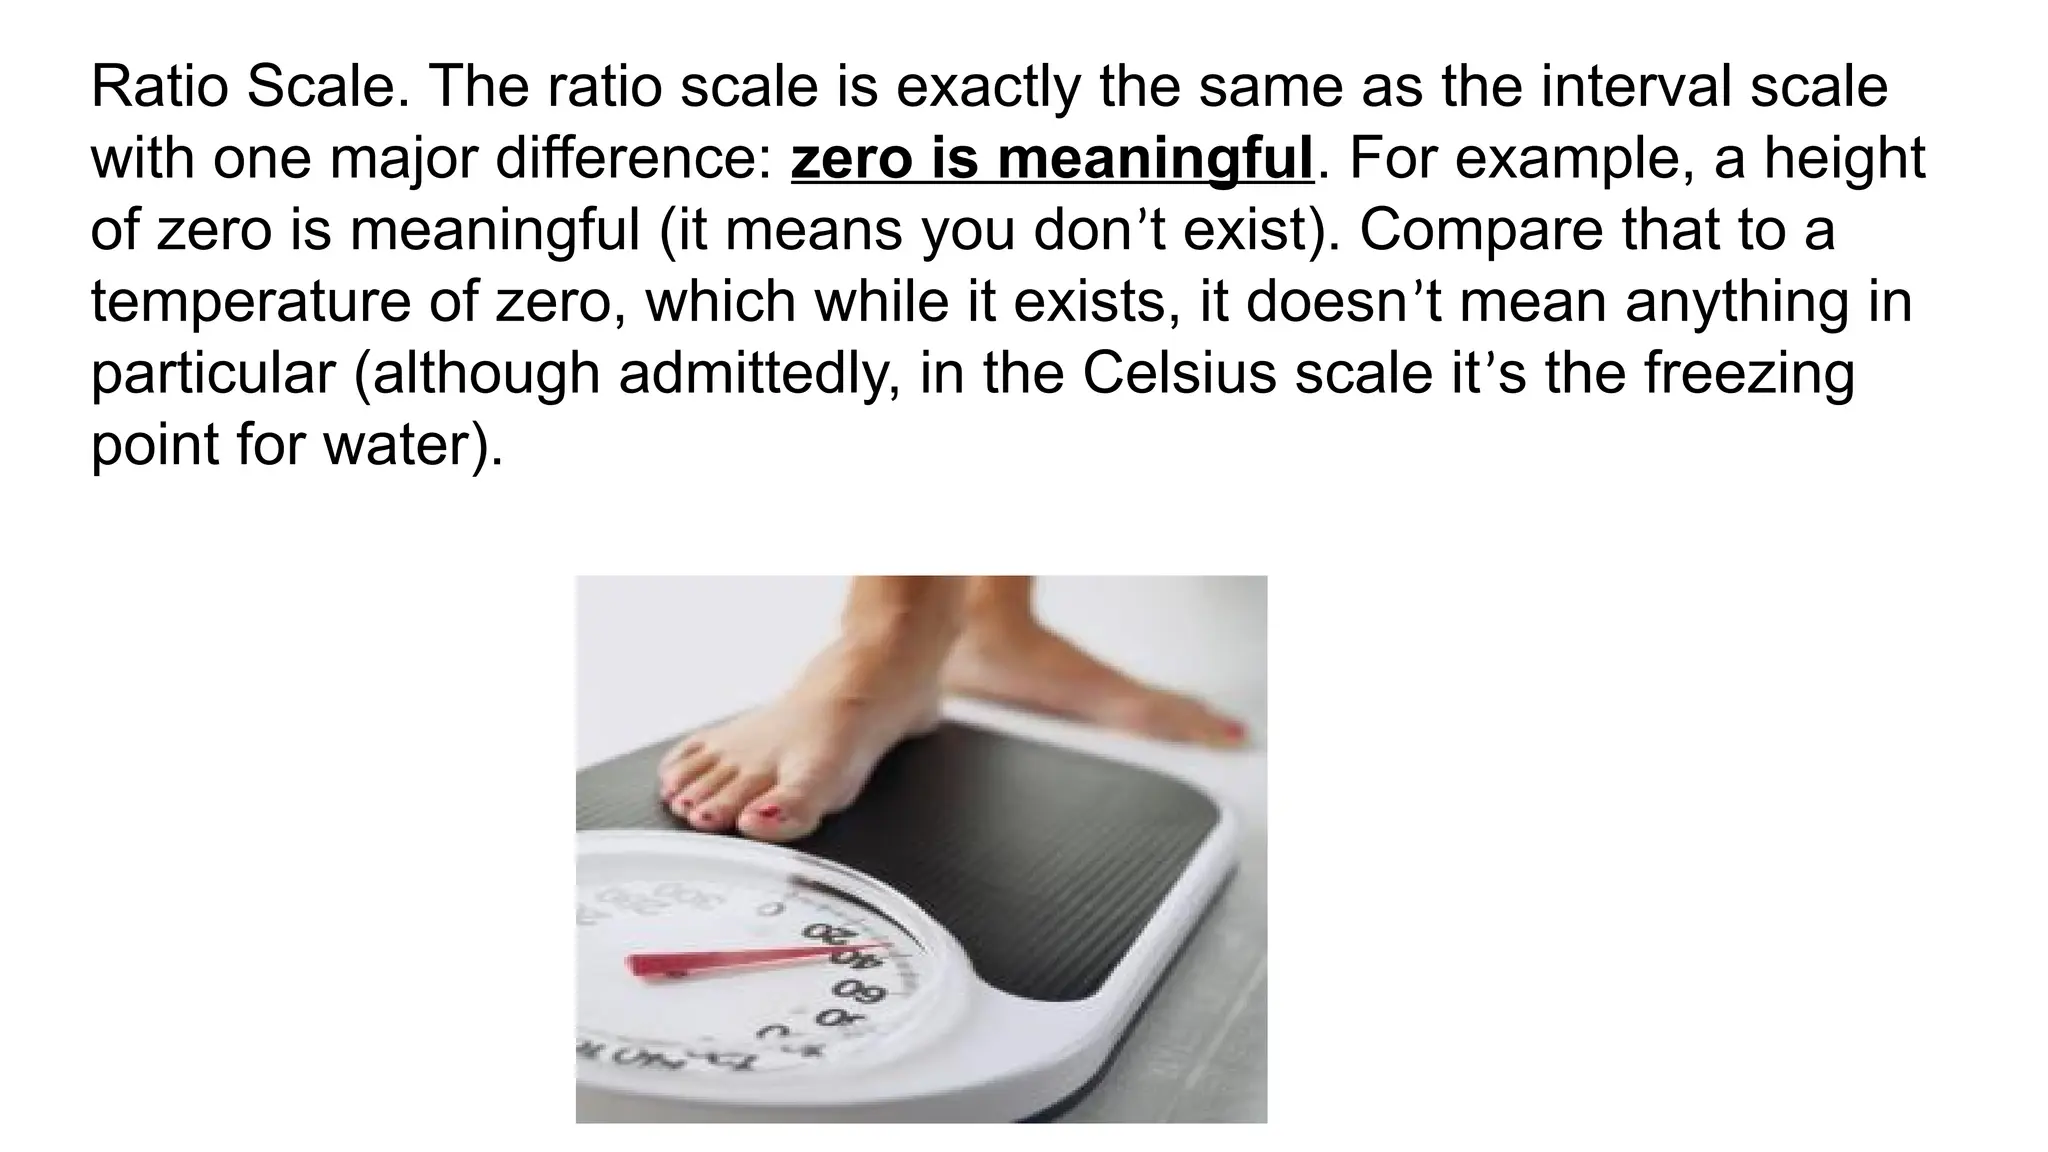
Ratio Scale. Theratio scale is exactly the same as the interval scale
with one major difference: zero is meaningful. For example, a height
of zero is meaningful (it means you don’t exist). Compare that to a
temperature of zero, which while it exists, it doesn’t mean anything in
particular (although admittedly, in the Celsius scale it’s the freezing
point for water).
41.
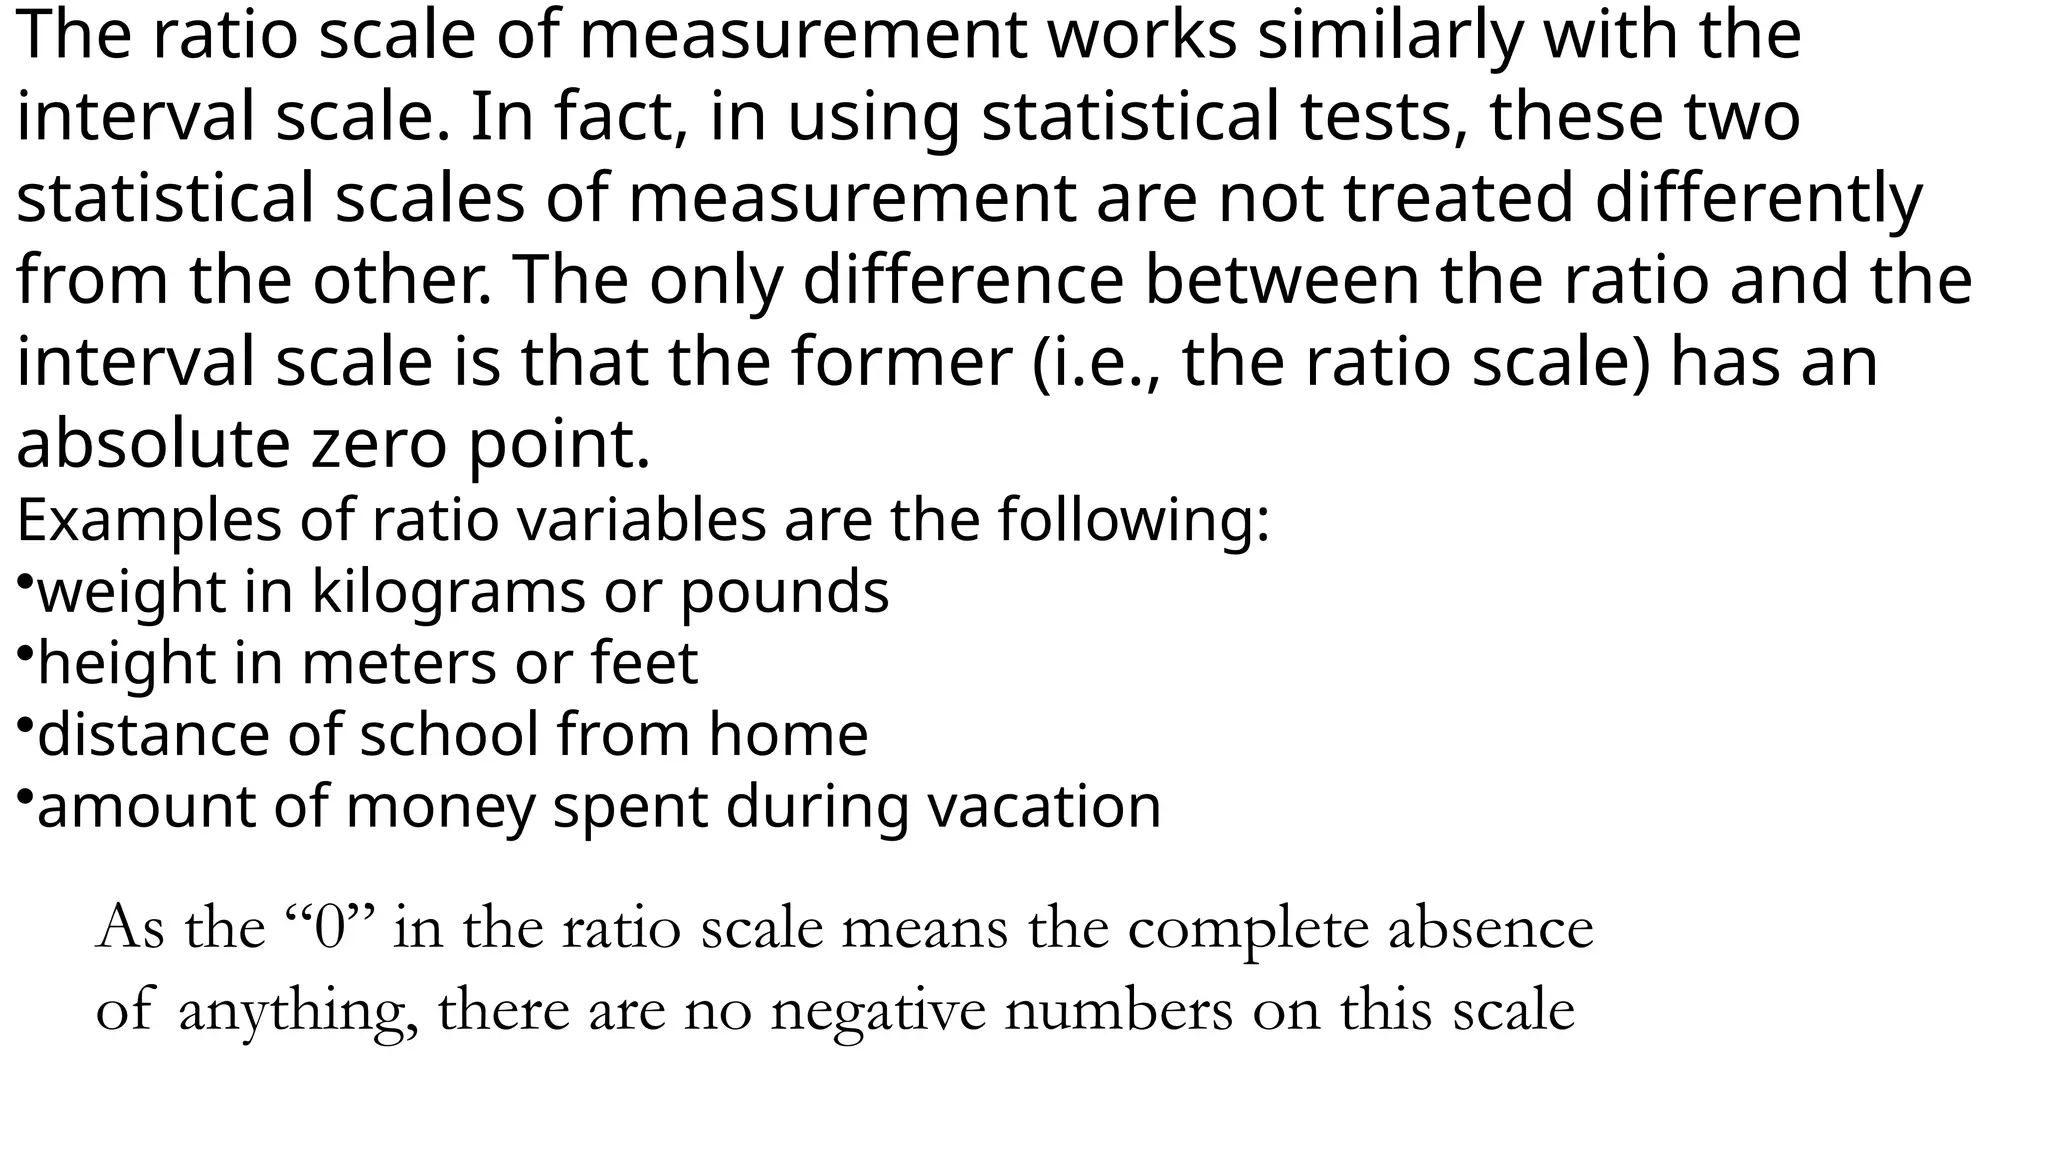
The ratio scaleof measurement works similarly with the
interval scale. In fact, in using statistical tests, these two
statistical scales of measurement are not treated differently
from the other. The only difference between the ratio and the
interval scale is that the former (i.e., the ratio scale) has an
absolute zero point.
Examples of ratio variables are the following:
•weight in kilograms or pounds
•height in meters or feet
•distance of school from home
•amount of money spent during vacation
As the “0” in the ratio scale means the complete absence
of anything, there are no negative numbers on this scale
42.
•Age. The clockstarts ticking when you are born,
but an age of “0” technically means you don’t
exist.
•Weight. At 0 pounds, you would weight nothing
and therefore wouldn’t exist.
•Height. If you were 0″, you would have no height.
•Sales figures. Sales of zero means that you sold
nothing and so sales didn’t exist.
•Quantity purchased. If you bought 0 items, then
there were no quantities purchased.
•Time measured from the “Big Bang.”
43.
Interval scales holdno true zero and can represent
values below zero. For example, you can measure
temperatures below 0 degrees Celsius, such as -10
degrees.
Ratio variables, on the other hand, never fall below
zero. Height and weight measure from 0 and above,
but never fall below it.
44.
Ratio scales ofmeasurement include properties from
all four scales of measurement.
The data is nominal and defined by an identity, can be
classified in order, contains intervals and can be
broken down into exact value.
Weight, height and distance are all examples of ratio
variables. Data in the ratio scale can be added,
subtracted, divided and multiplied.
45.
Ratio scales alsodiffer from interval scales in
that the scale has a ‘true zero’.
The number zero means that the data has no
value point. An example of this is height or
weight, as someone cannot be zero centimetres
tall or weigh zero kilos – or be negative
centimetres or negative kilos.
Examples of the use of this scale are calculating
shares or sales. Of all types of data on the scales
of measurement, data scientists can do the most
with ratio data points.
46.
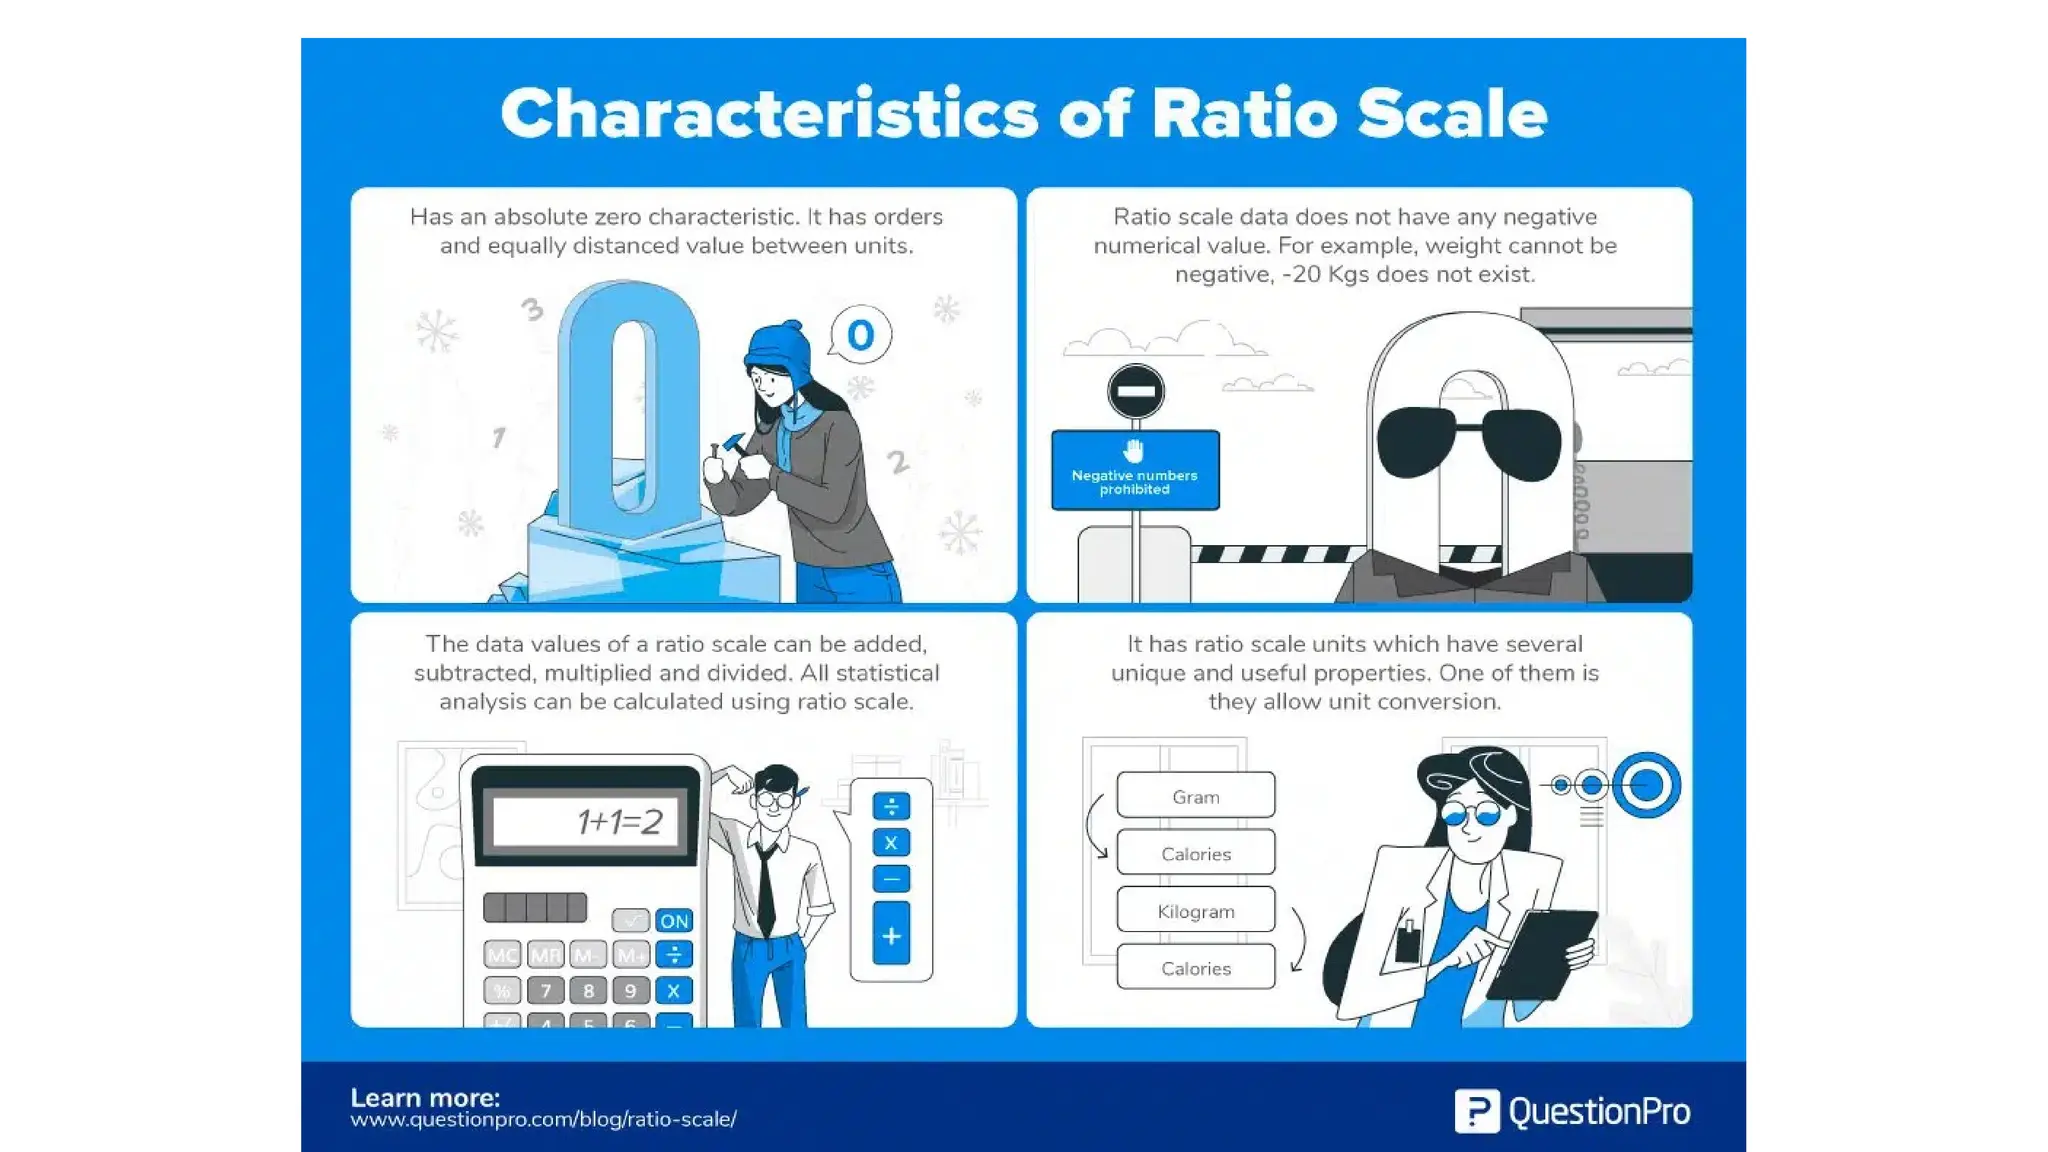
Characteristics of RatioScale
1.has an absolute zero characteristic. It has orders and
equally distanced value between units. The zero point
characteristic makes it relevant or meaningful to say,
“one object has twice the length of the other” or “is
twice as long.”
2.Ratio scale doesn’t have a negative number, unlike
interval scale because of the absolute zero or zero
point characteristic. To measure any object on a this
scale, researchers must first see if the object meets all
the criteria for interval scale plus has an absolute zero
characteristic.
49.
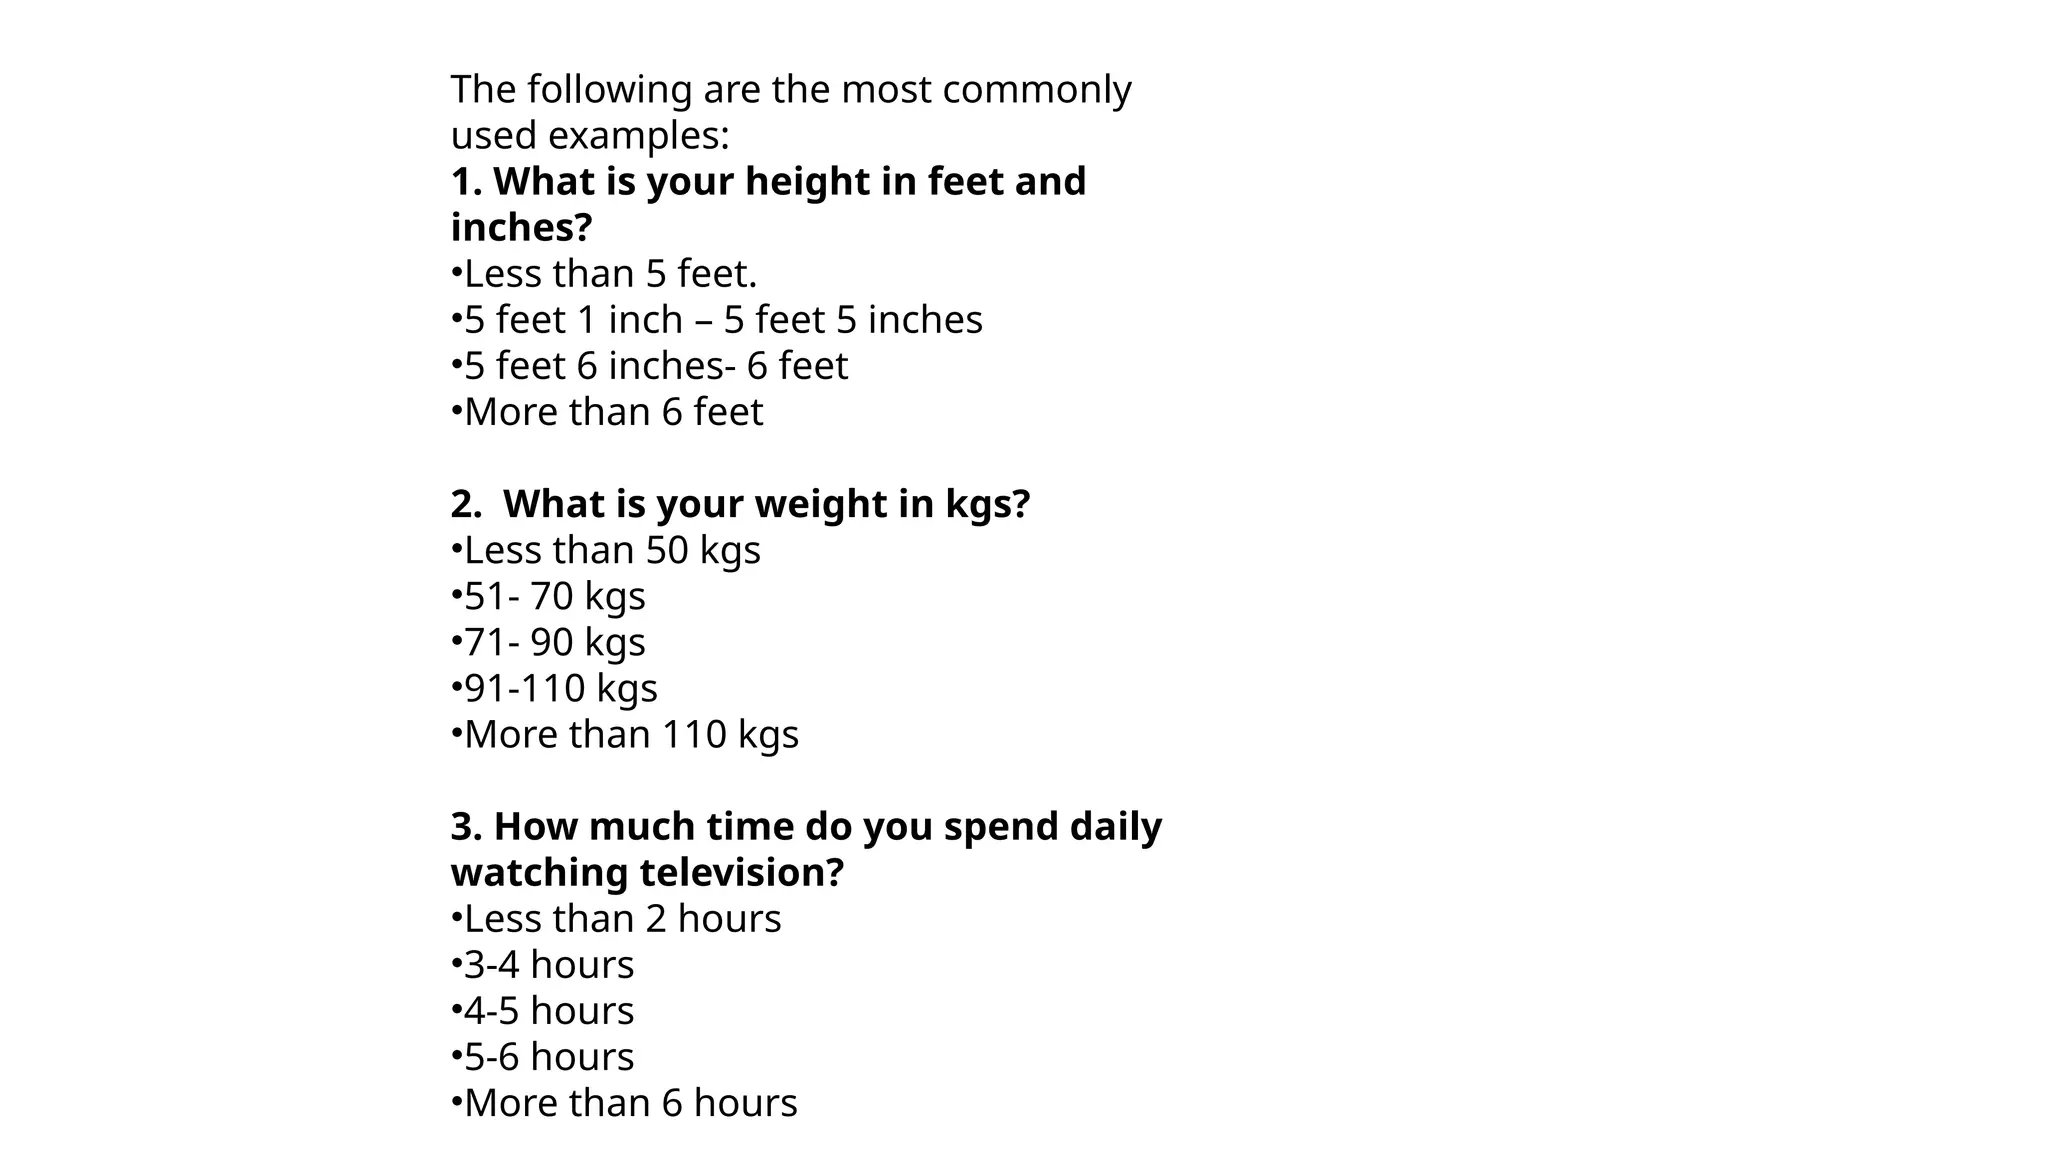
The following arethe most commonly
used examples:
1. What is your height in feet and
inches?
•Less than 5 feet.
•5 feet 1 inch – 5 feet 5 inches
•5 feet 6 inches- 6 feet
•More than 6 feet
2. What is your weight in kgs?
•Less than 50 kgs
•51- 70 kgs
•71- 90 kgs
•91-110 kgs
•More than 110 kgs
3. How much time do you spend daily
watching television?
•Less than 2 hours
•3-4 hours
•4-5 hours
•5-6 hours
•More than 6 hours
50.
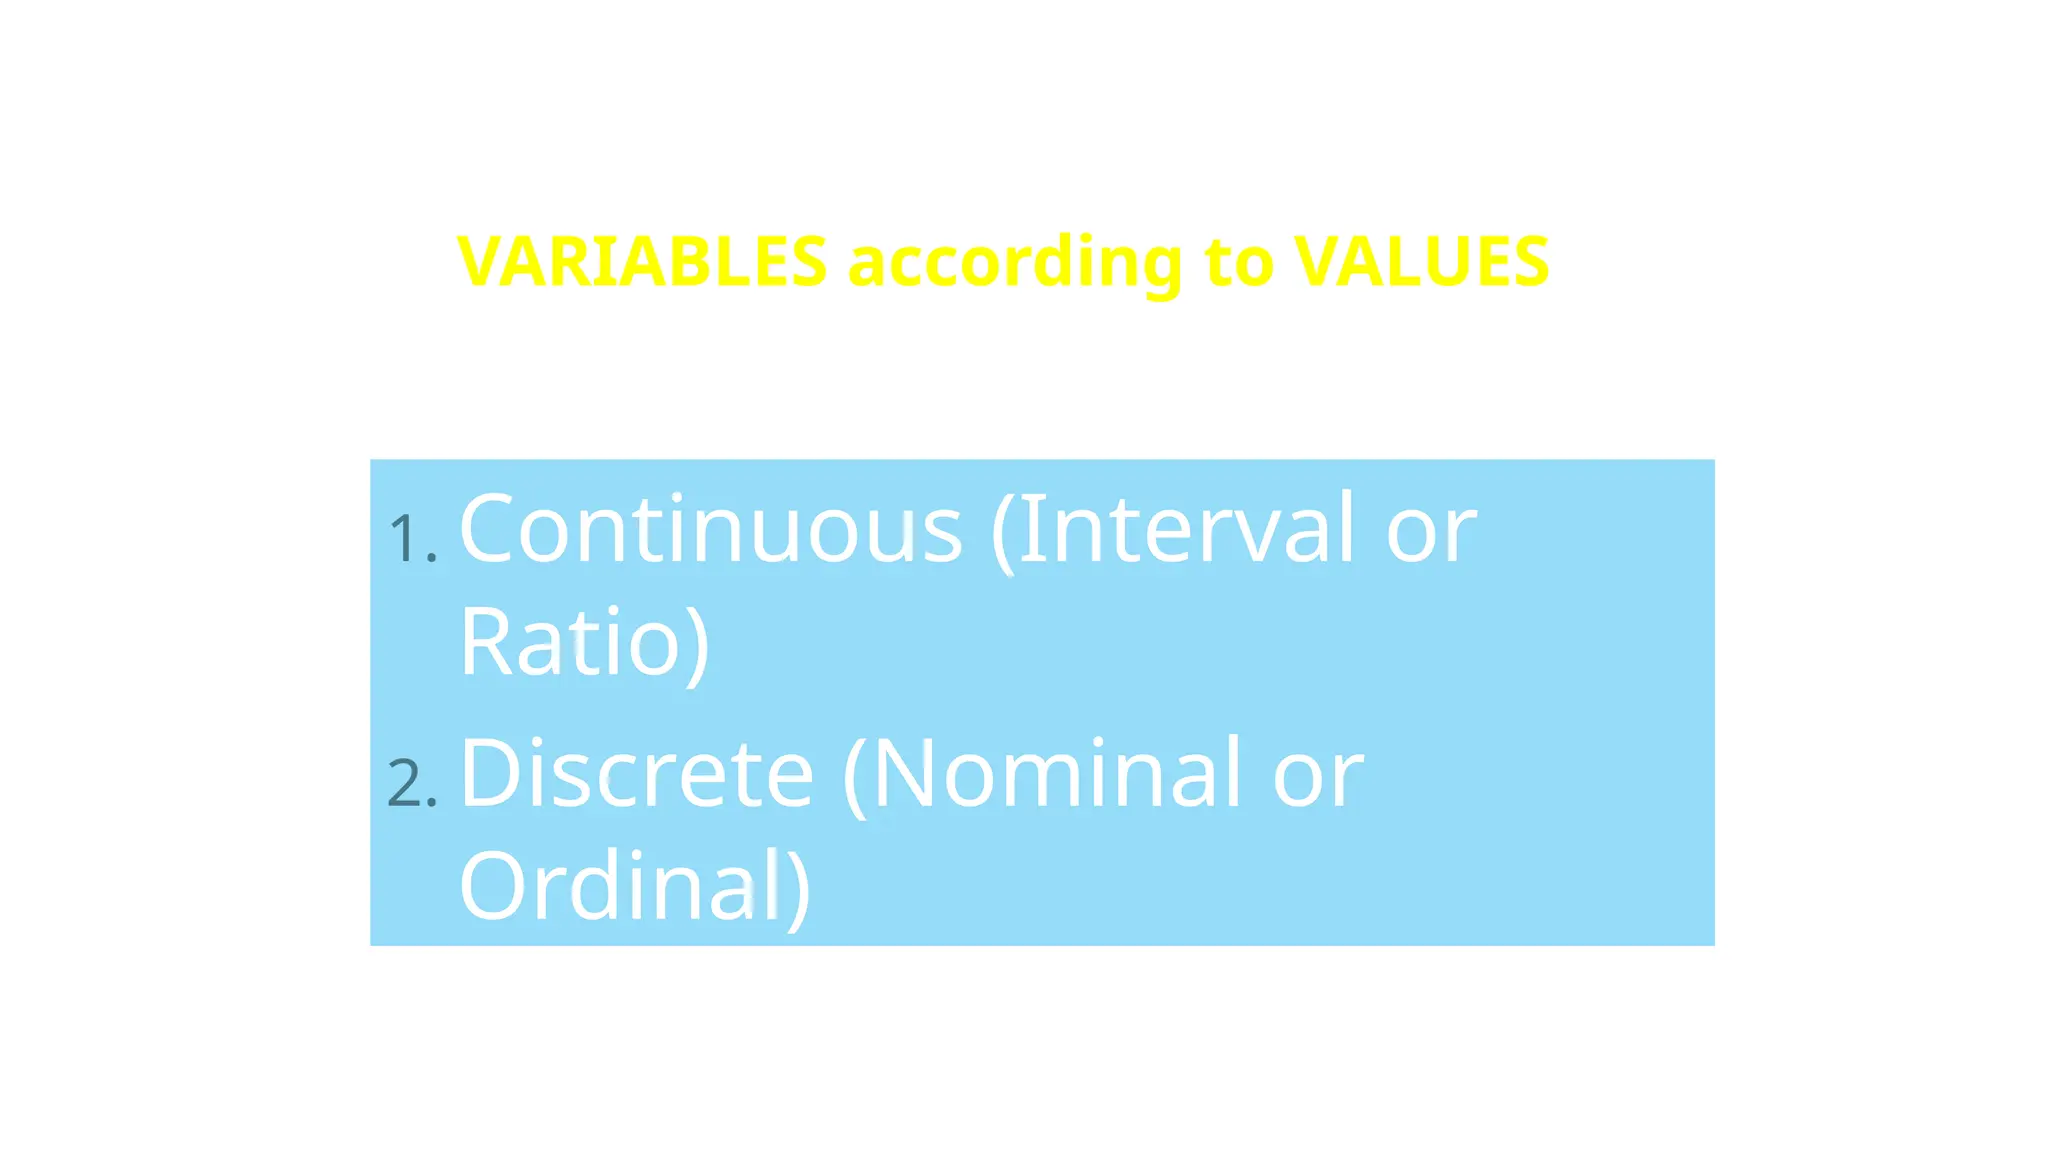
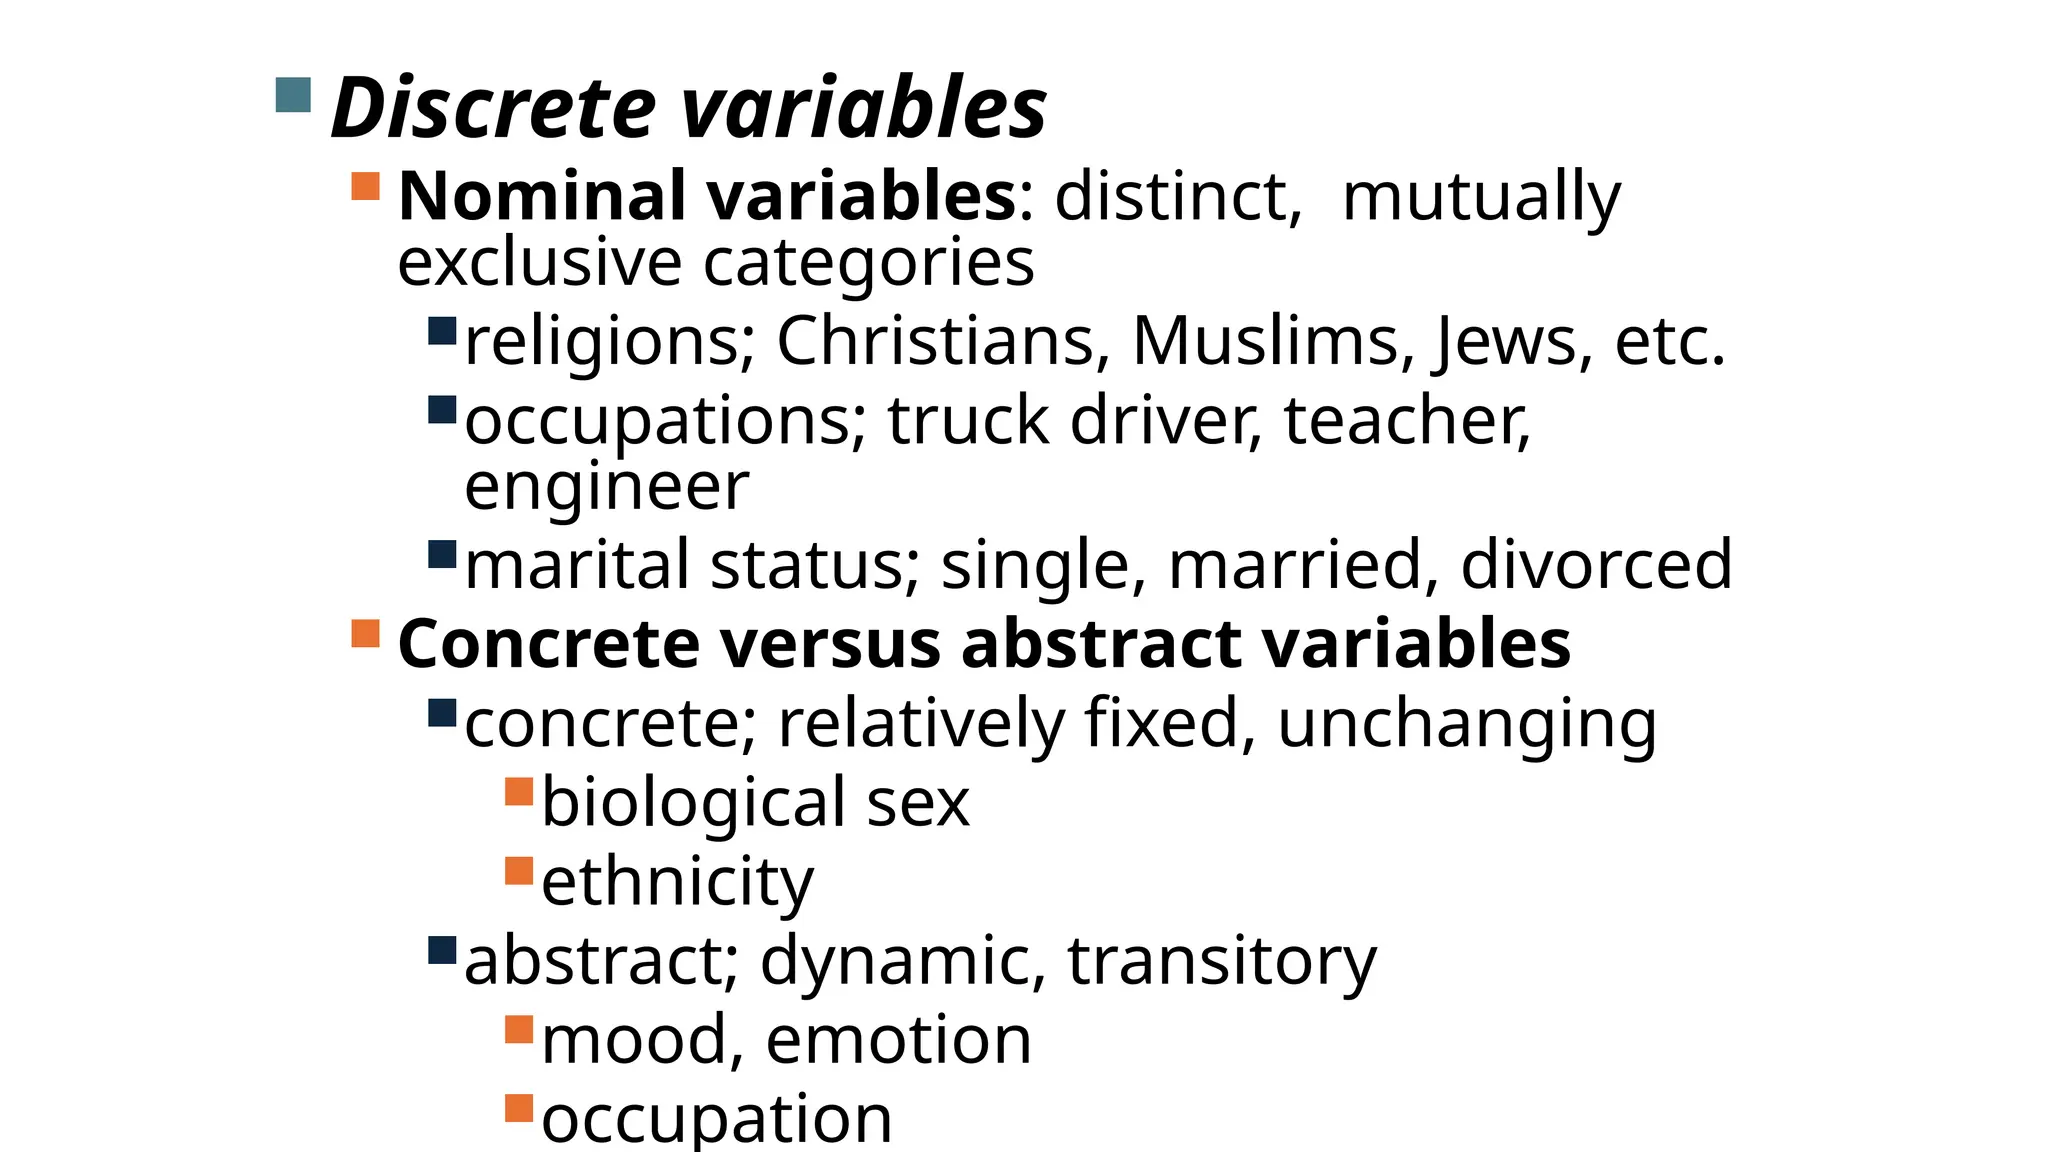
VARIABLES according toVALUES
1. Continuous (Interval or
Ratio)
2. Discrete (Nominal or
Ordinal)
51.
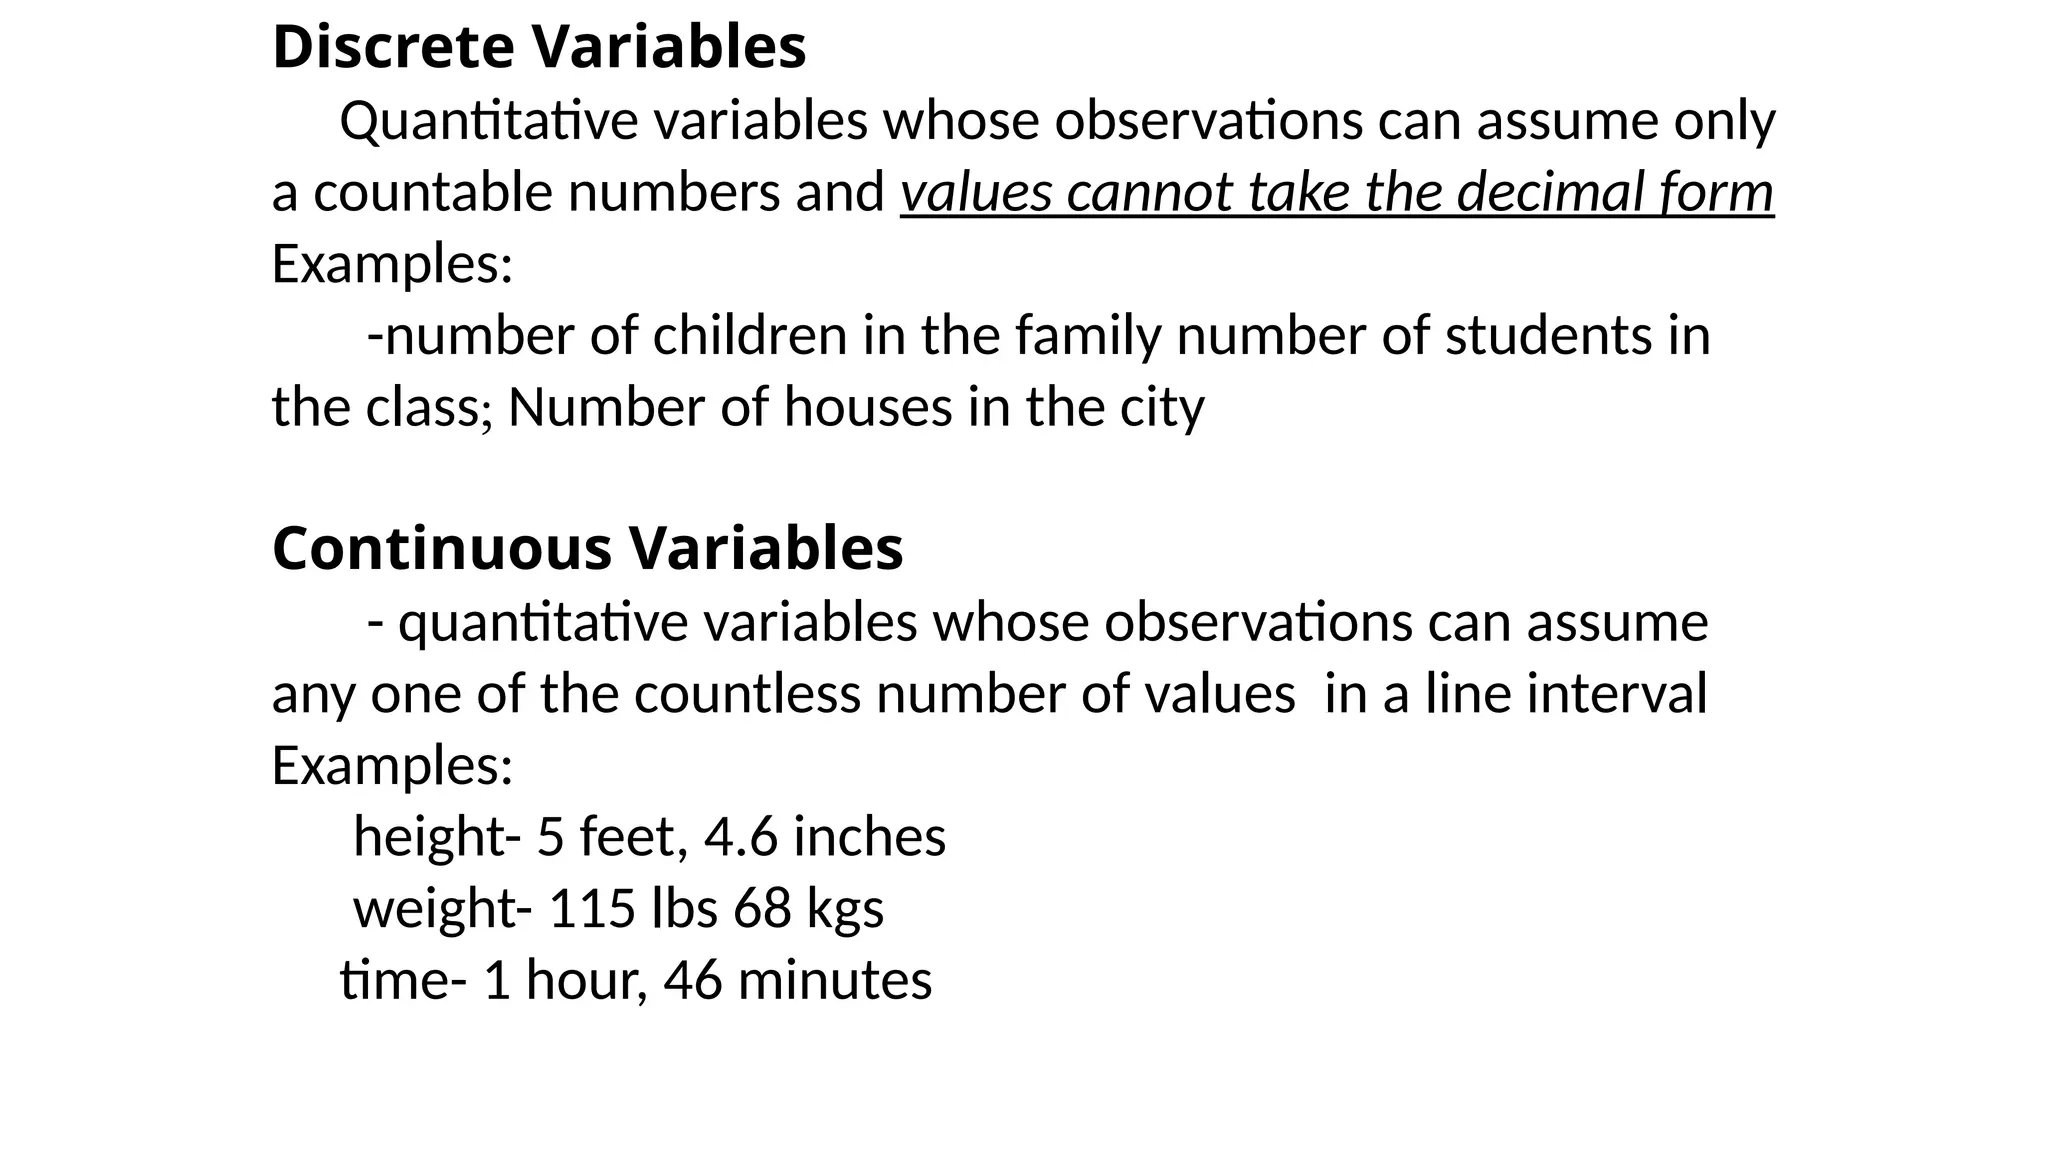
Discrete Variables
Quantitative variableswhose observations can assume only
a countable numbers and values cannot take the decimal form
Examples:
-number of children in the family number of students in
the class; Number of houses in the city
Continuous Variables
- quantitative variables whose observations can assume
any one of the countless number of values in a line interval
Examples:
height- 5 feet, 4.6 inches
weight- 115 lbs 68 kgs
time- 1 hour, 46 minutes
52.
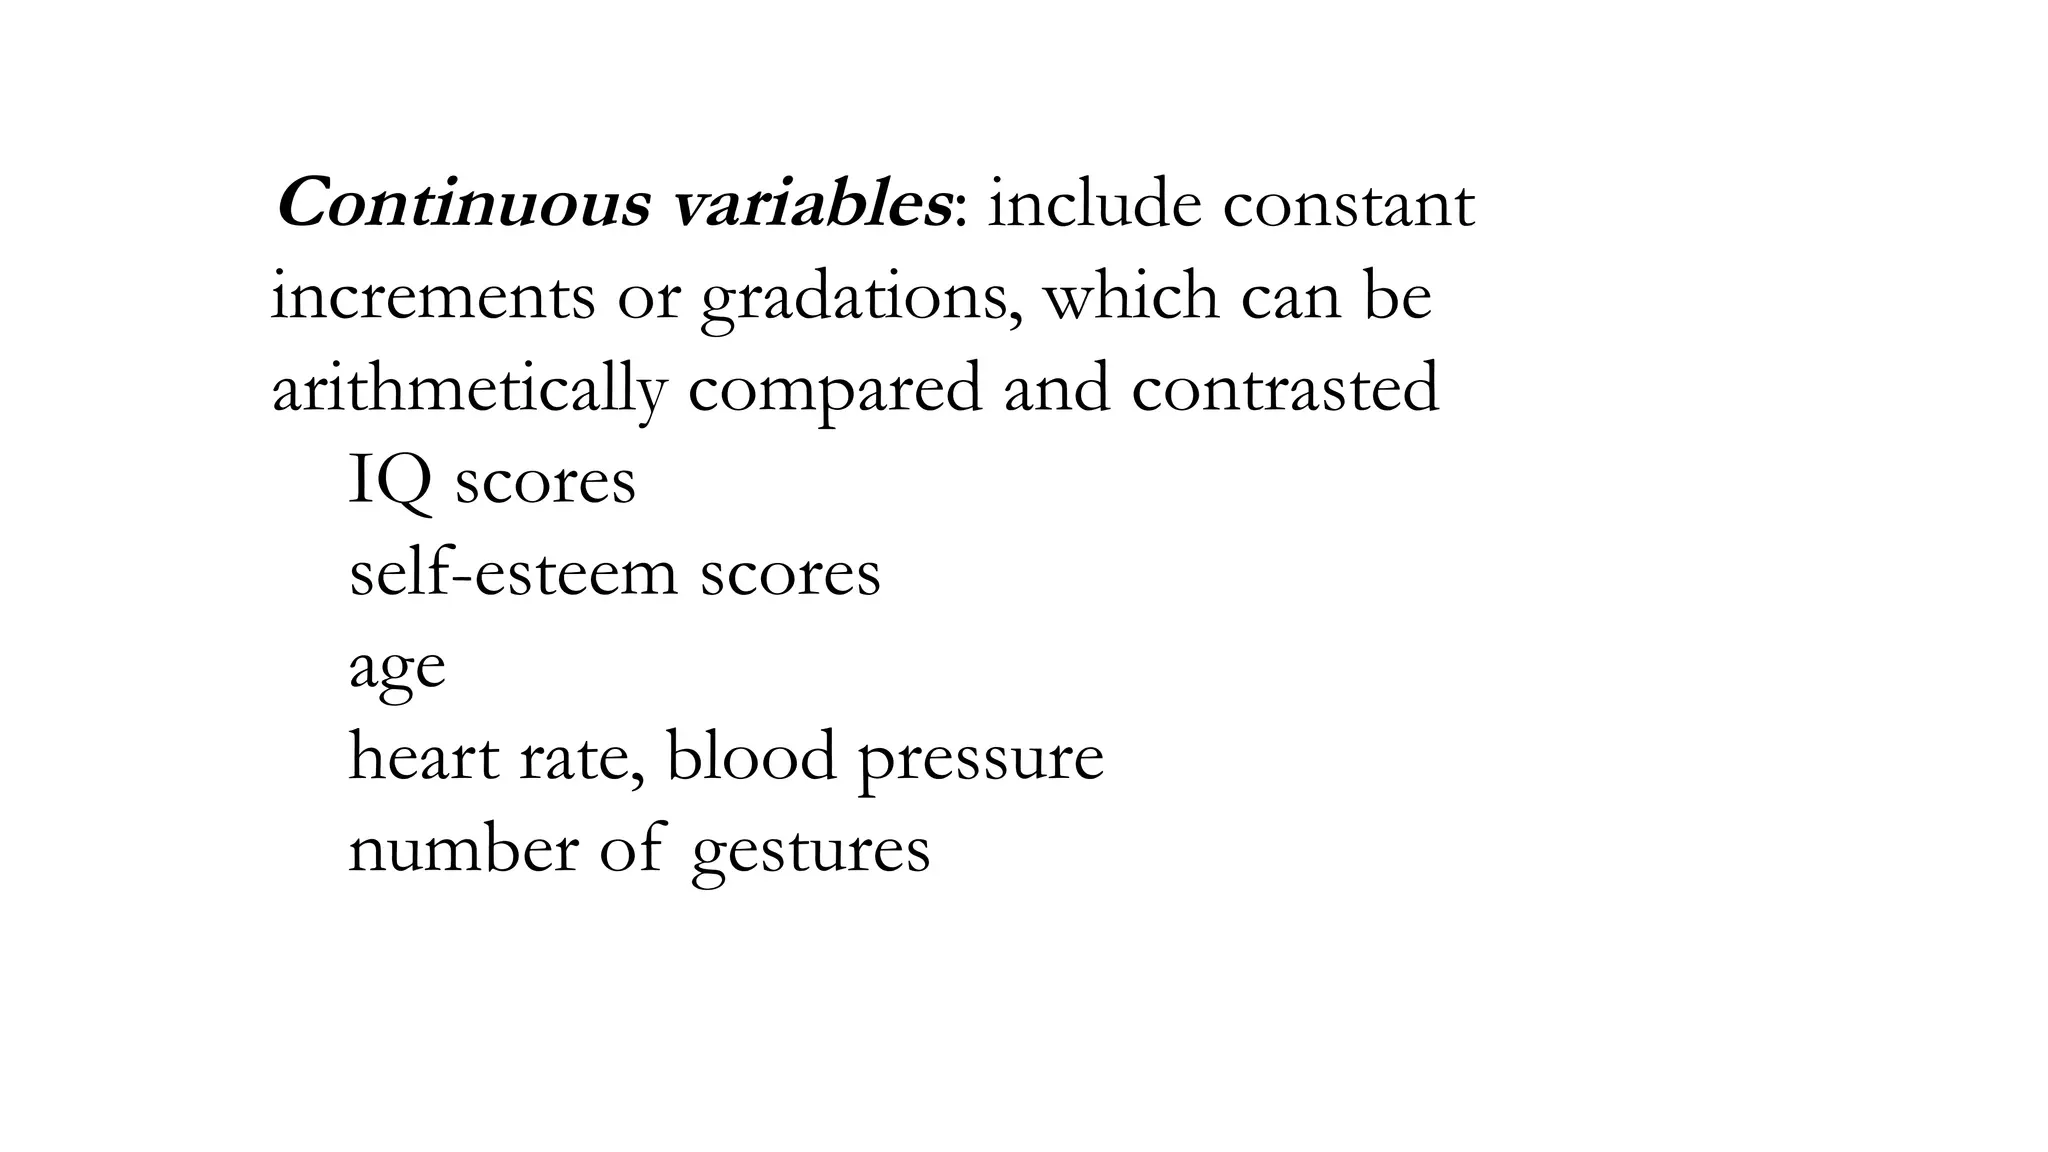
Continuous variables: includeconstant
increments or gradations, which can be
arithmetically compared and contrasted
IQ scores
self-esteem scores
age
heart rate, blood pressure
number of gestures
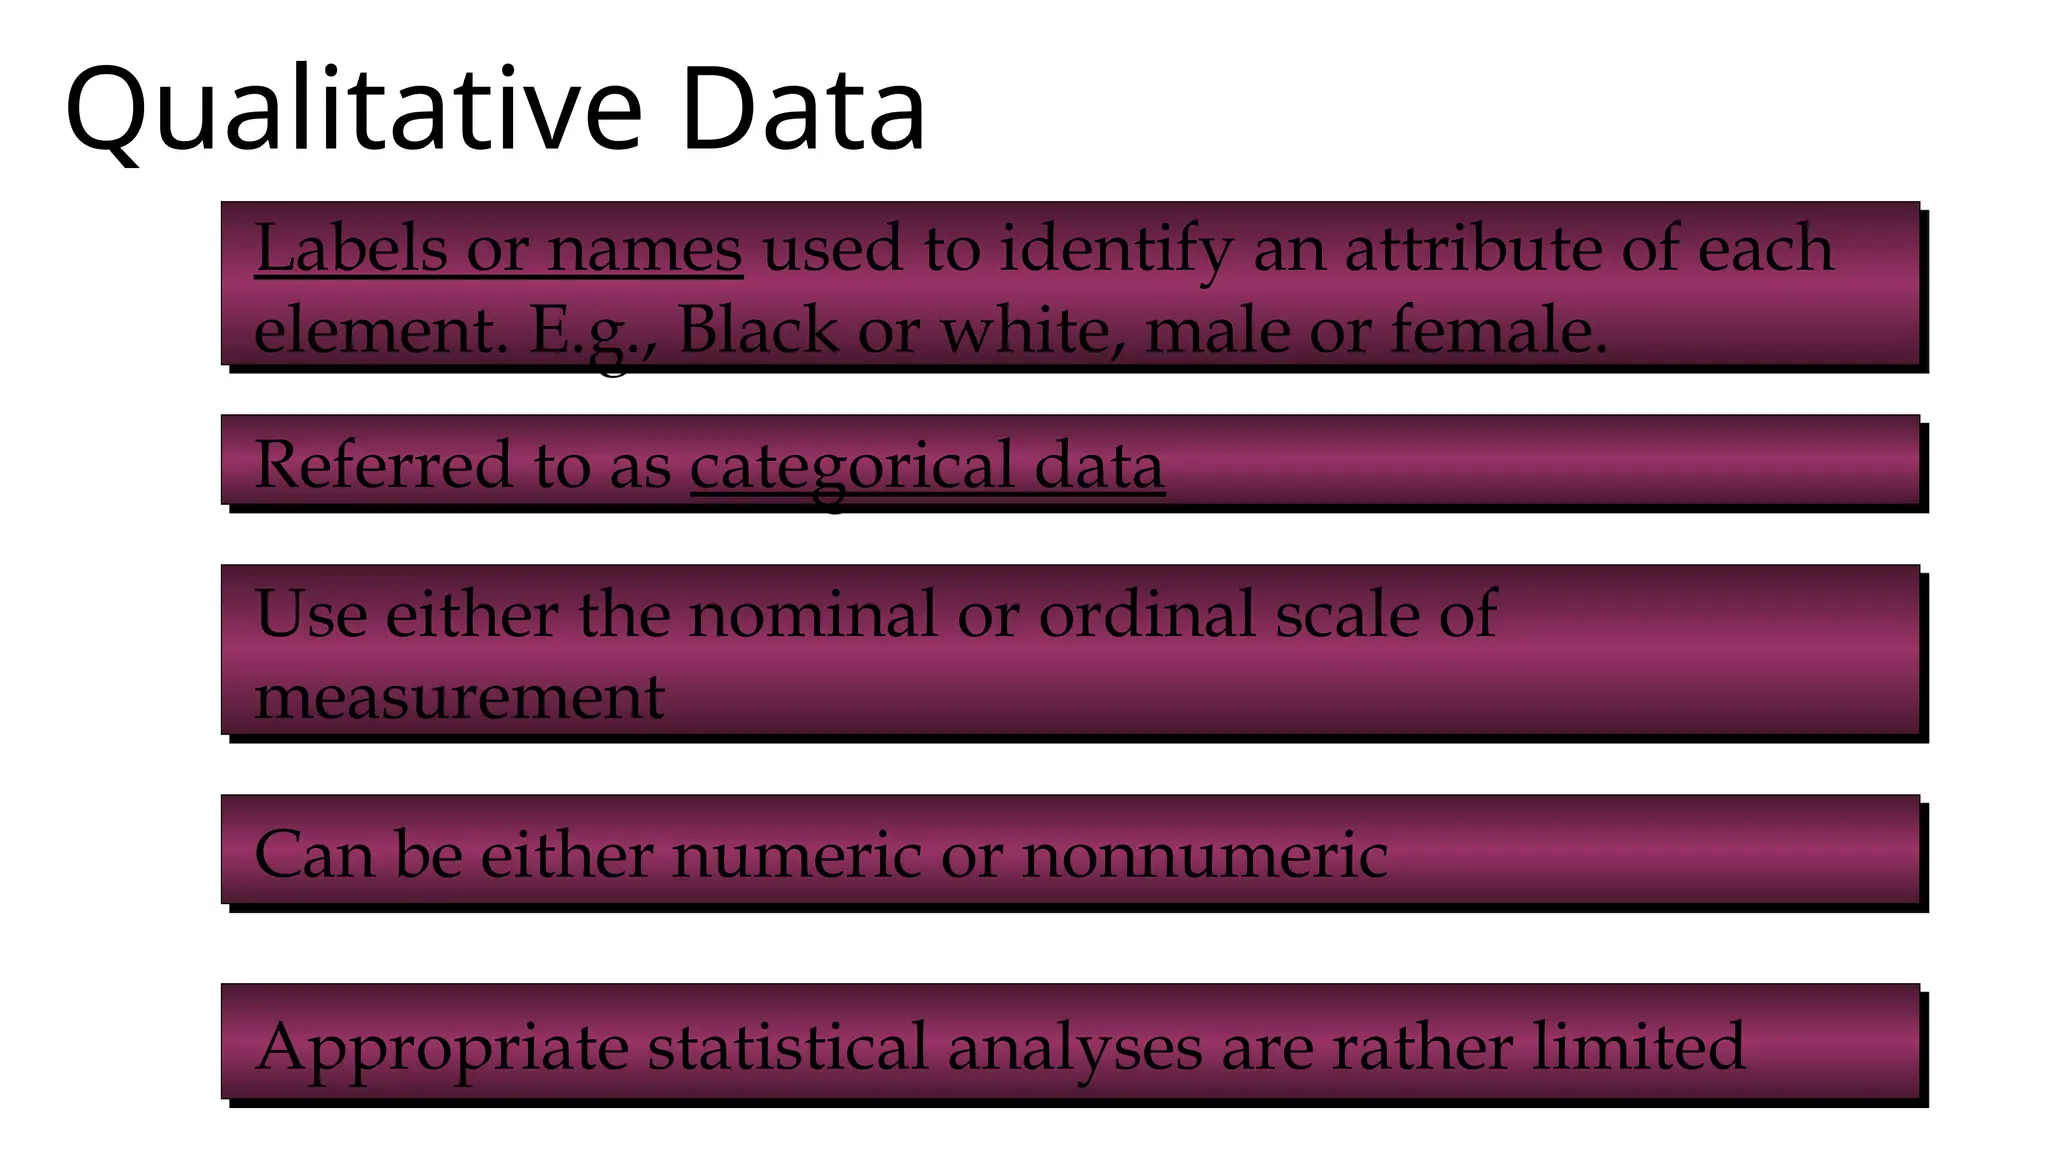
Qualitative Data
Labels ornames used to identify an attribute of each
element. E.g., Black or white, male or female.
Referred to as categorical data
Use either the nominal or ordinal scale of
measurement
Can be either numeric or nonnumeric
Appropriate statistical analyses are rather limited
55.
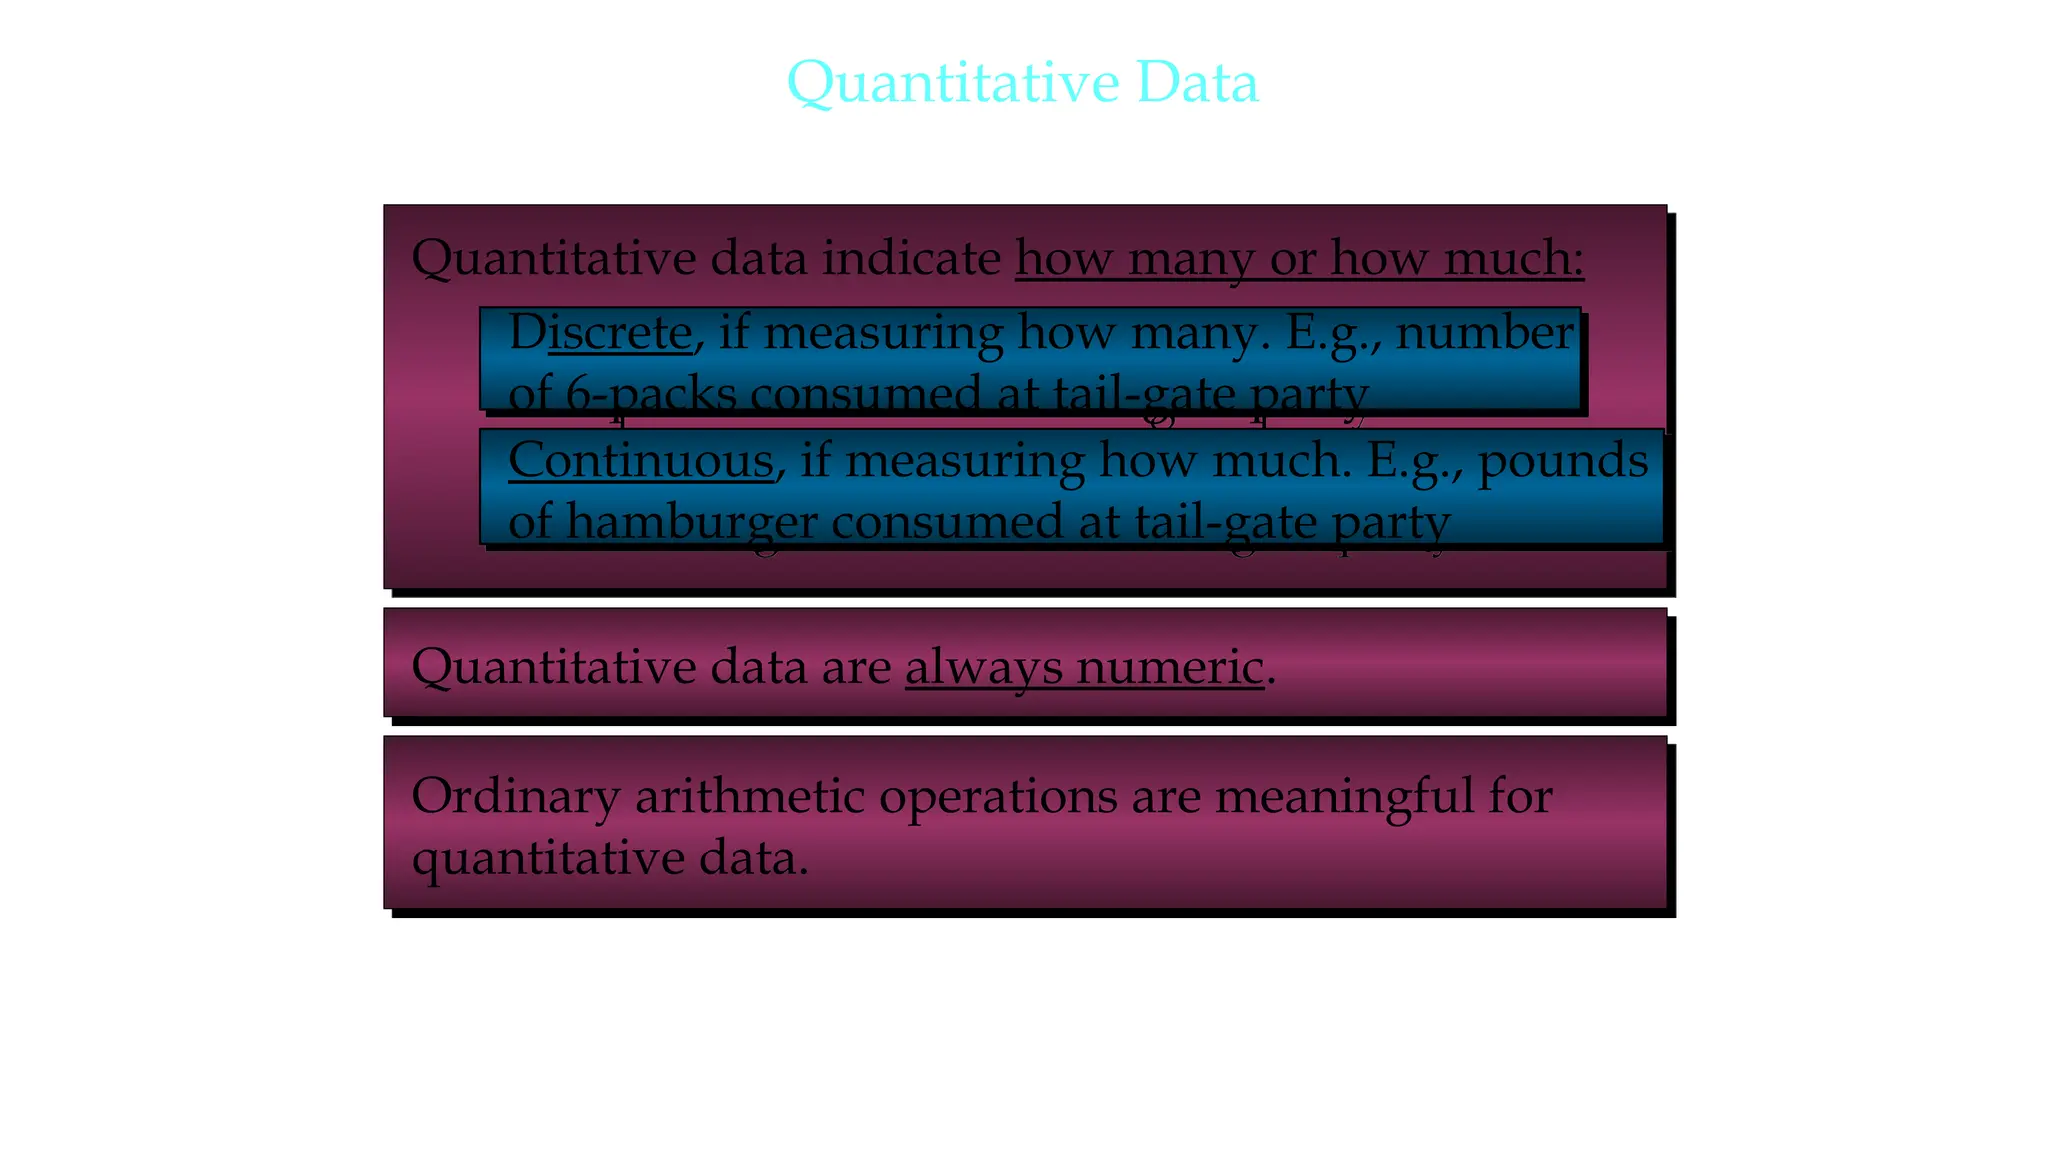
Quantitative Data
Quantitative dataindicate how many or how much:
Discrete, if measuring how many. E.g., number
of 6-packs consumed at tail-gate party
Continuous, if measuring how much. E.g., pounds
of hamburger consumed at tail-gate party
Quantitative data are always numeric.
Ordinary arithmetic operations are meaningful for
quantitative data.