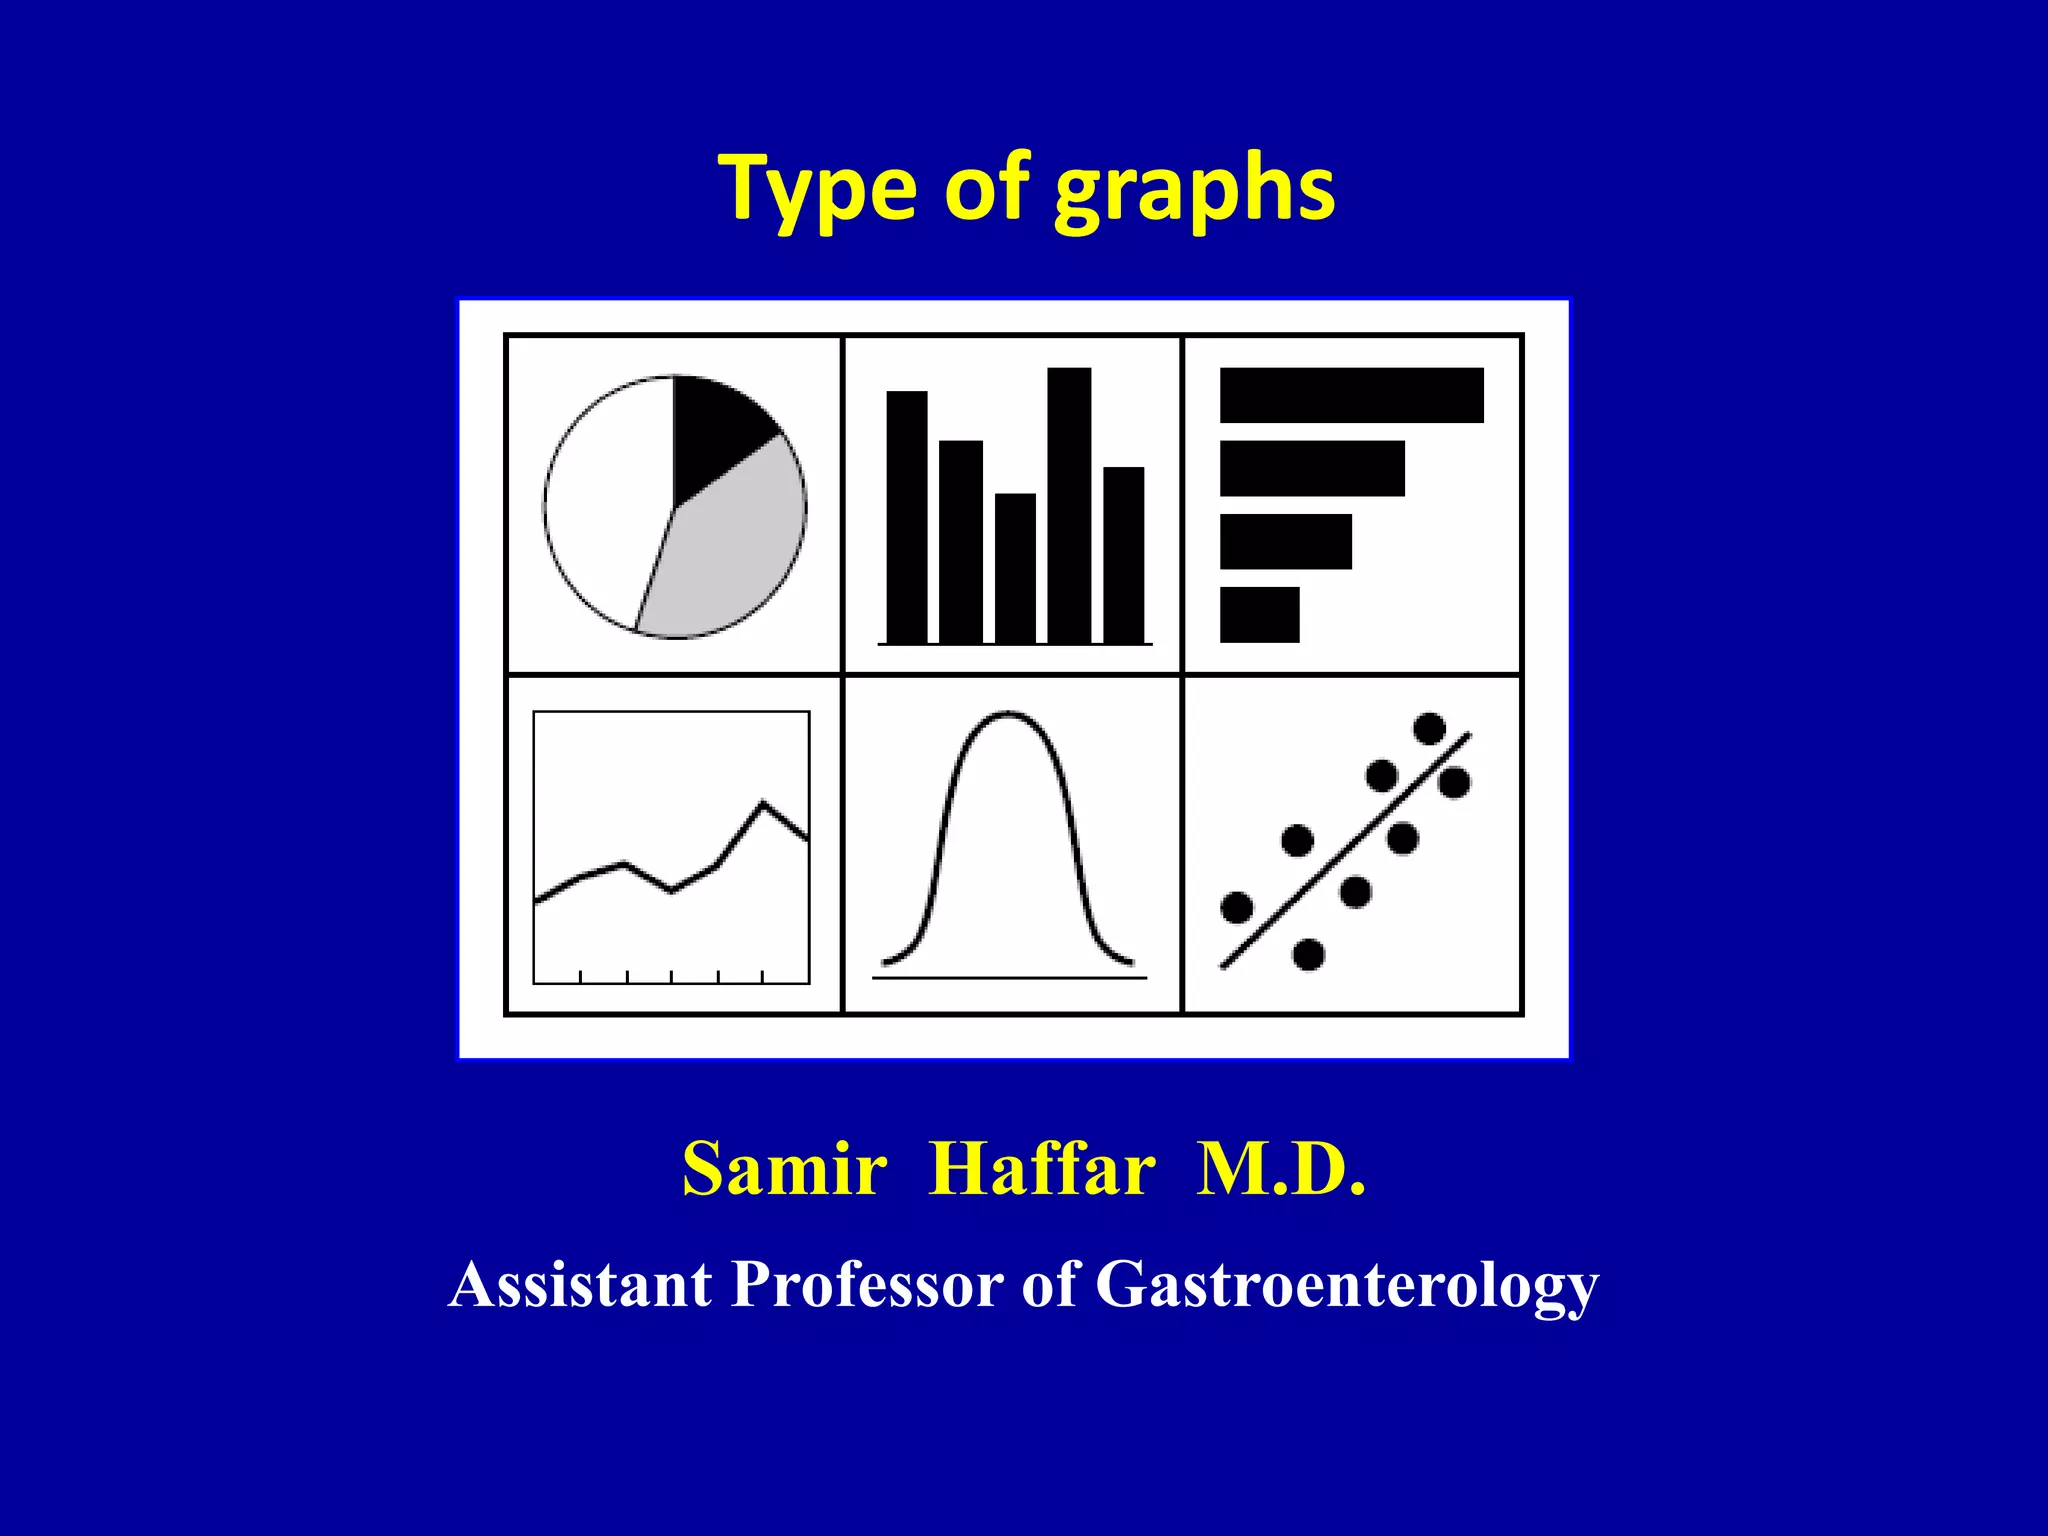
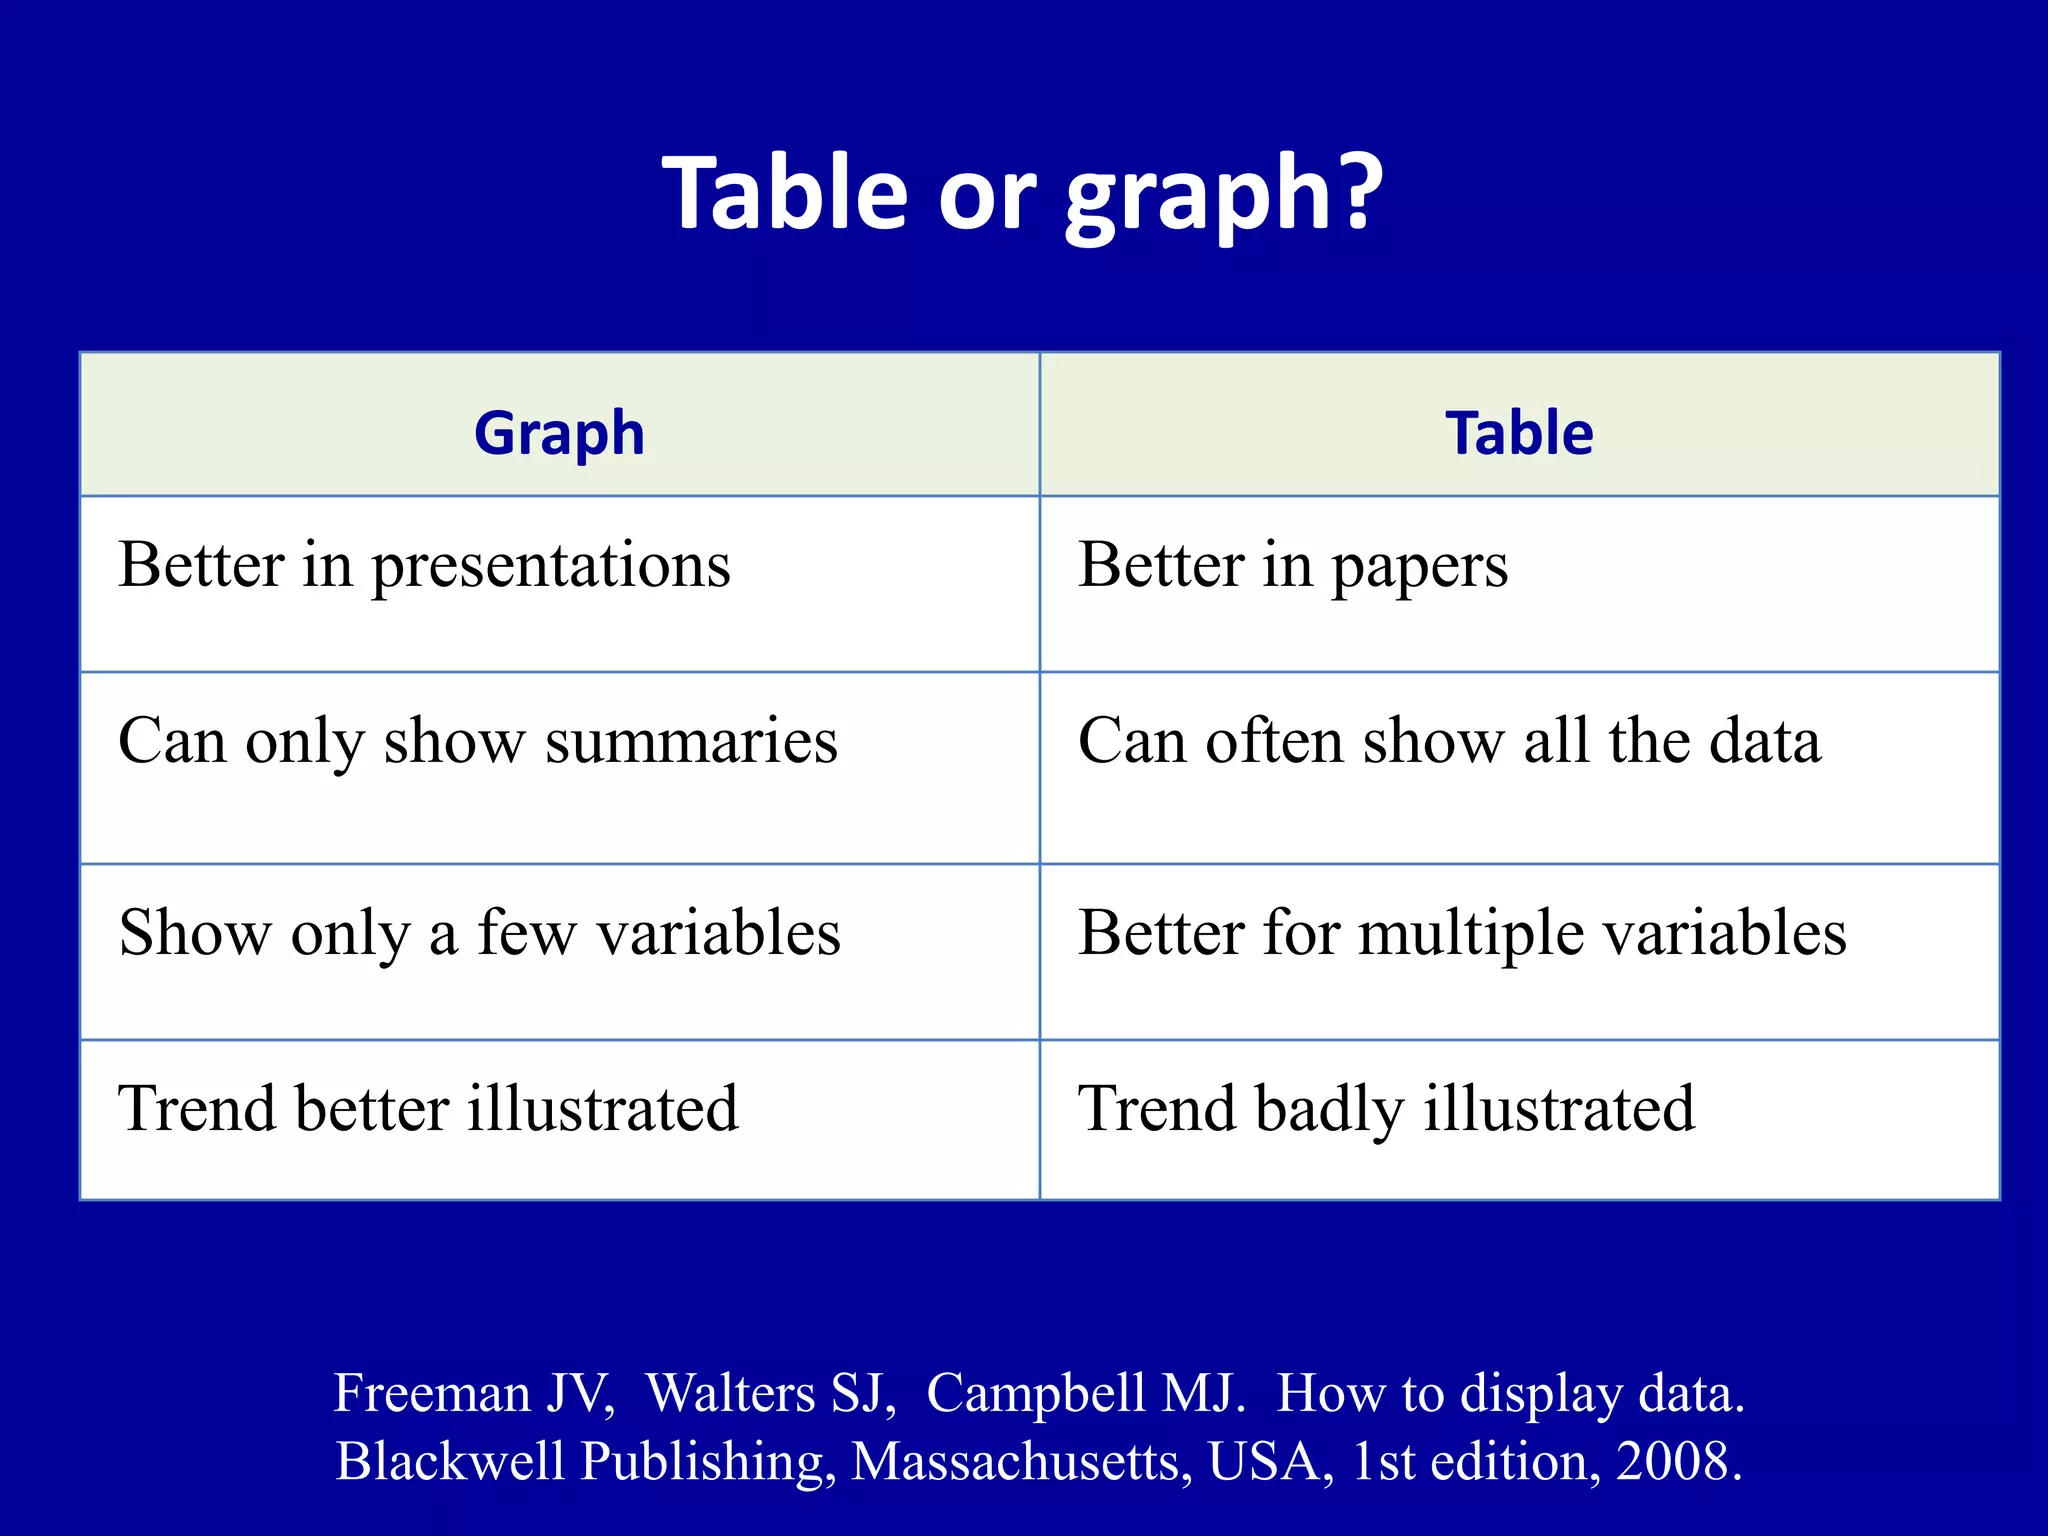
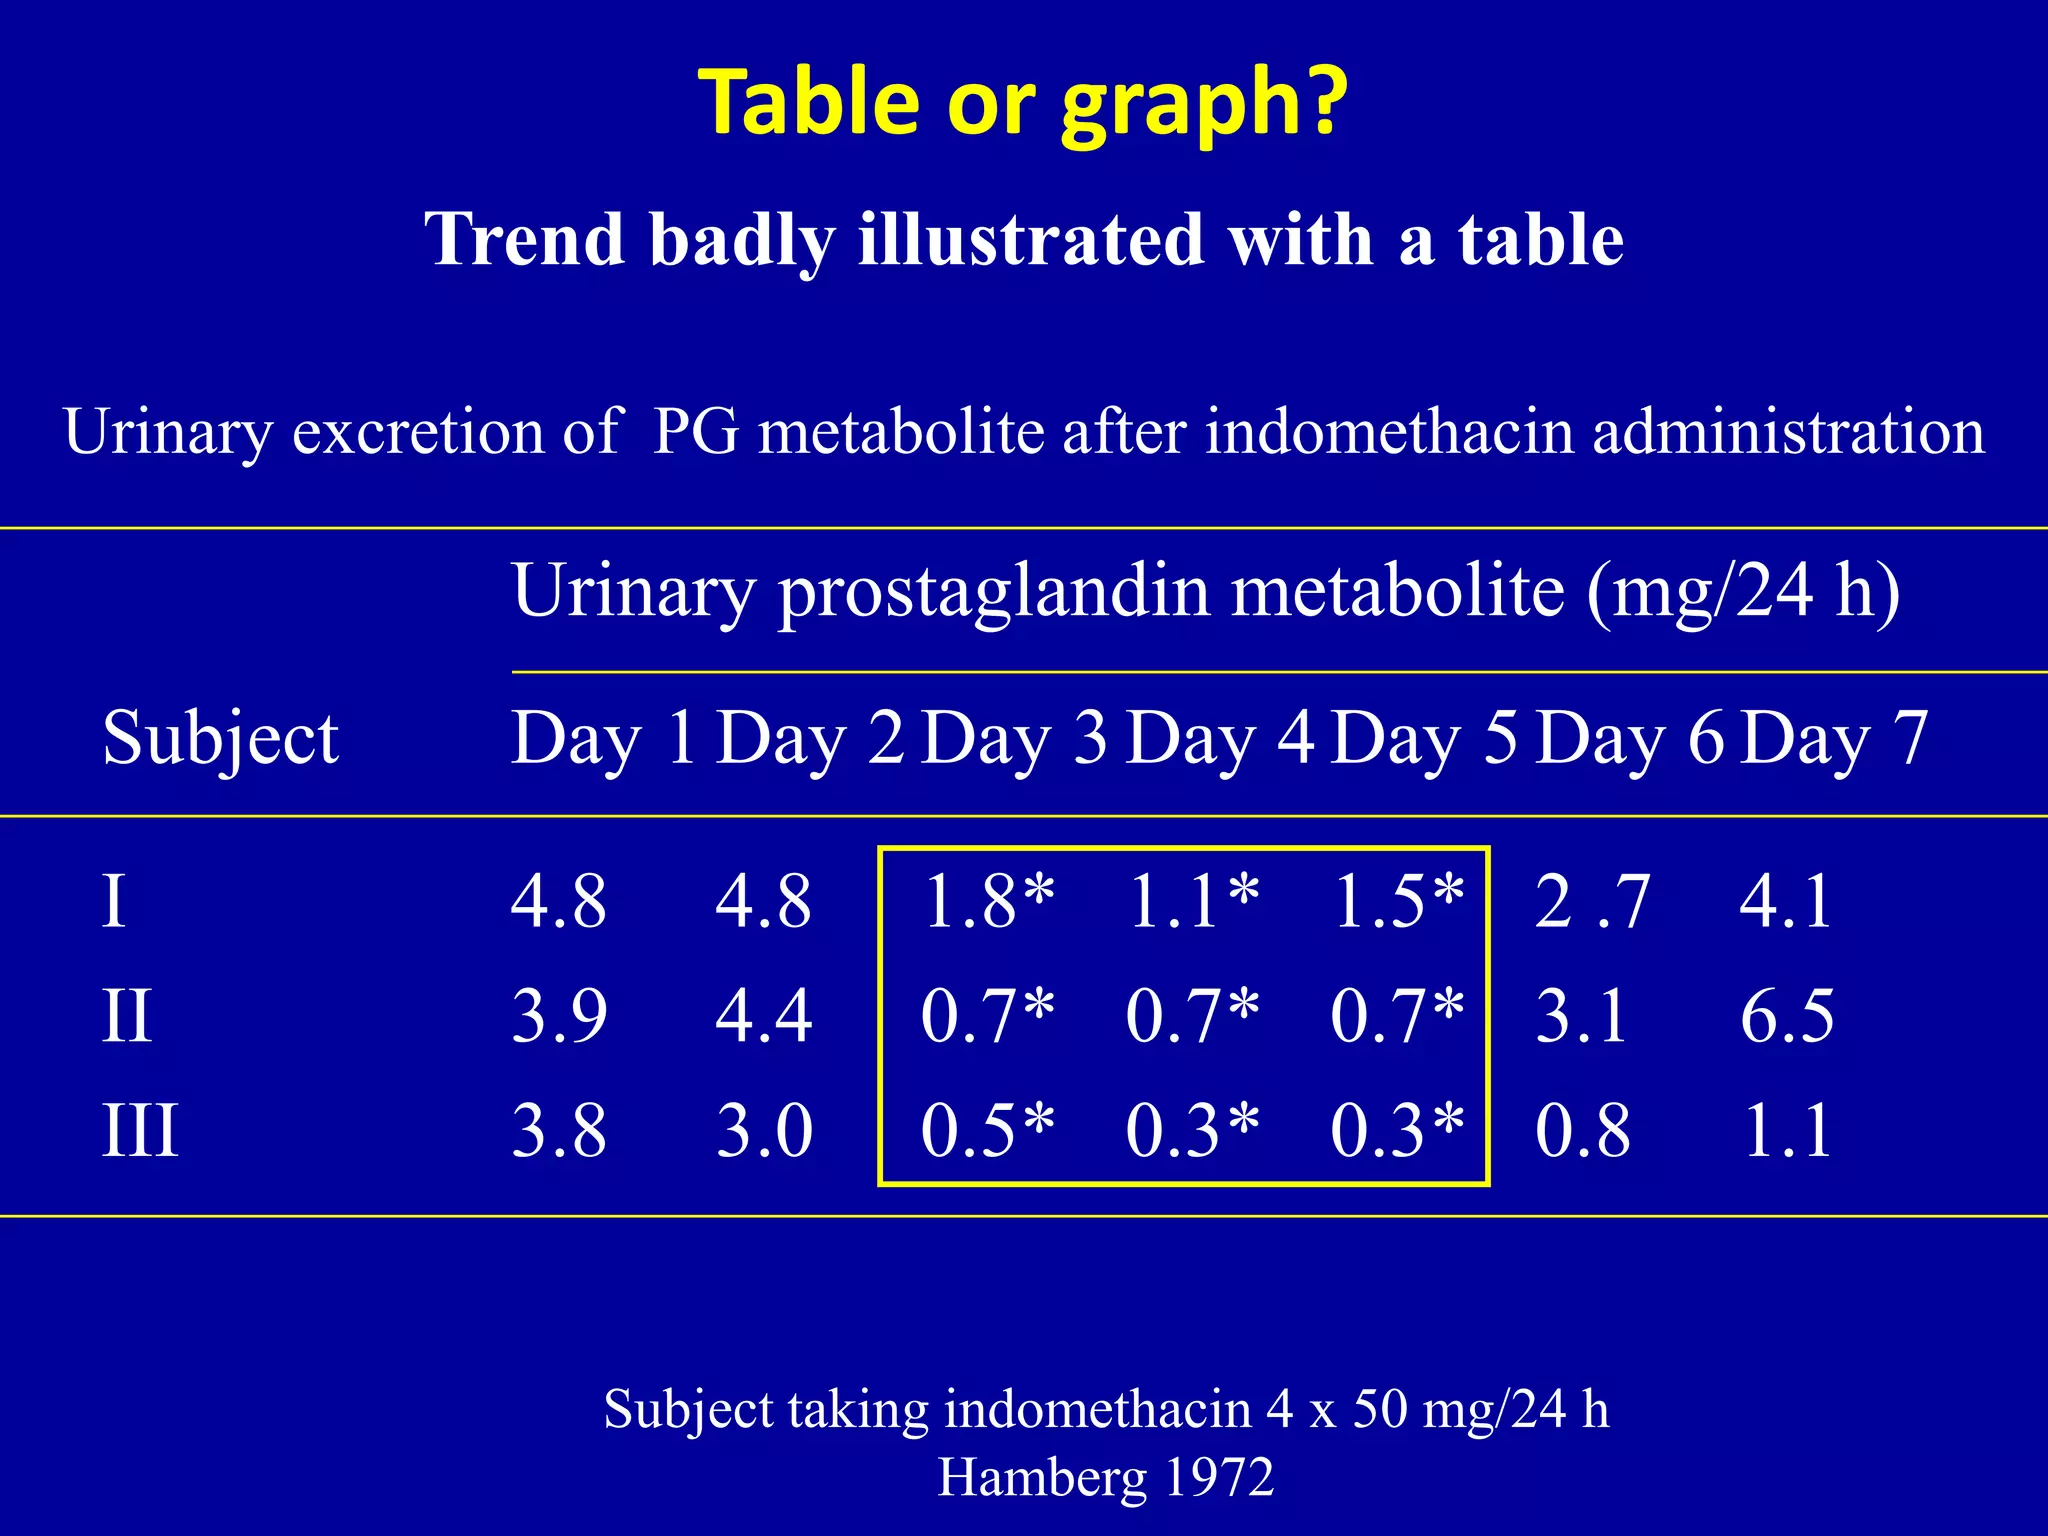
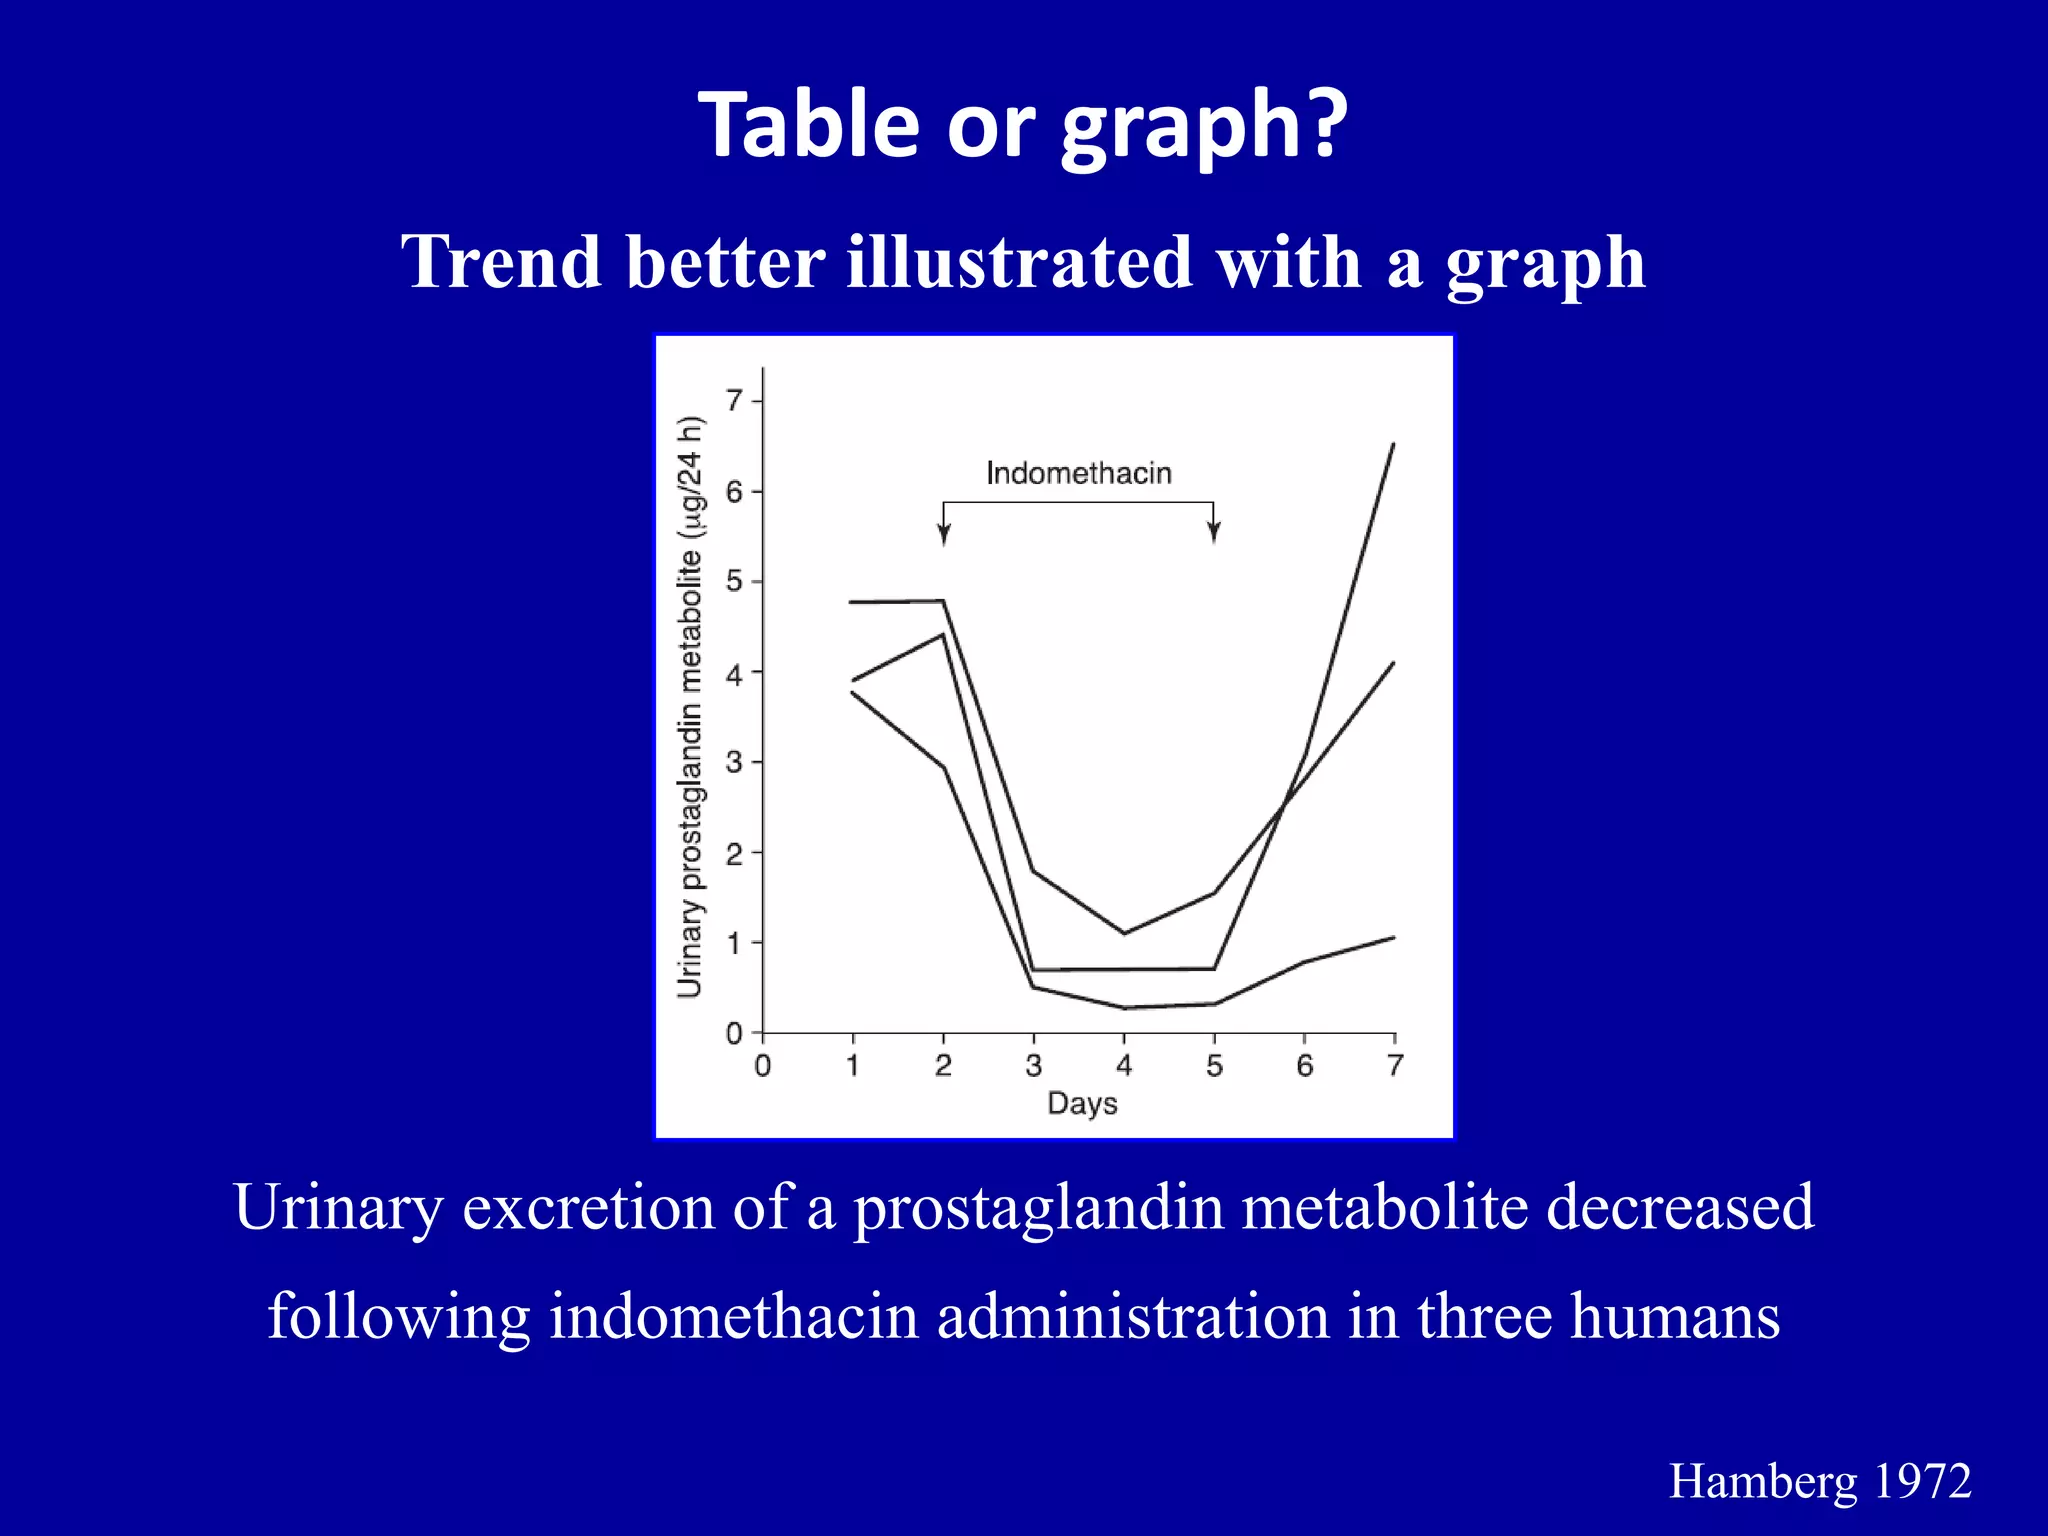
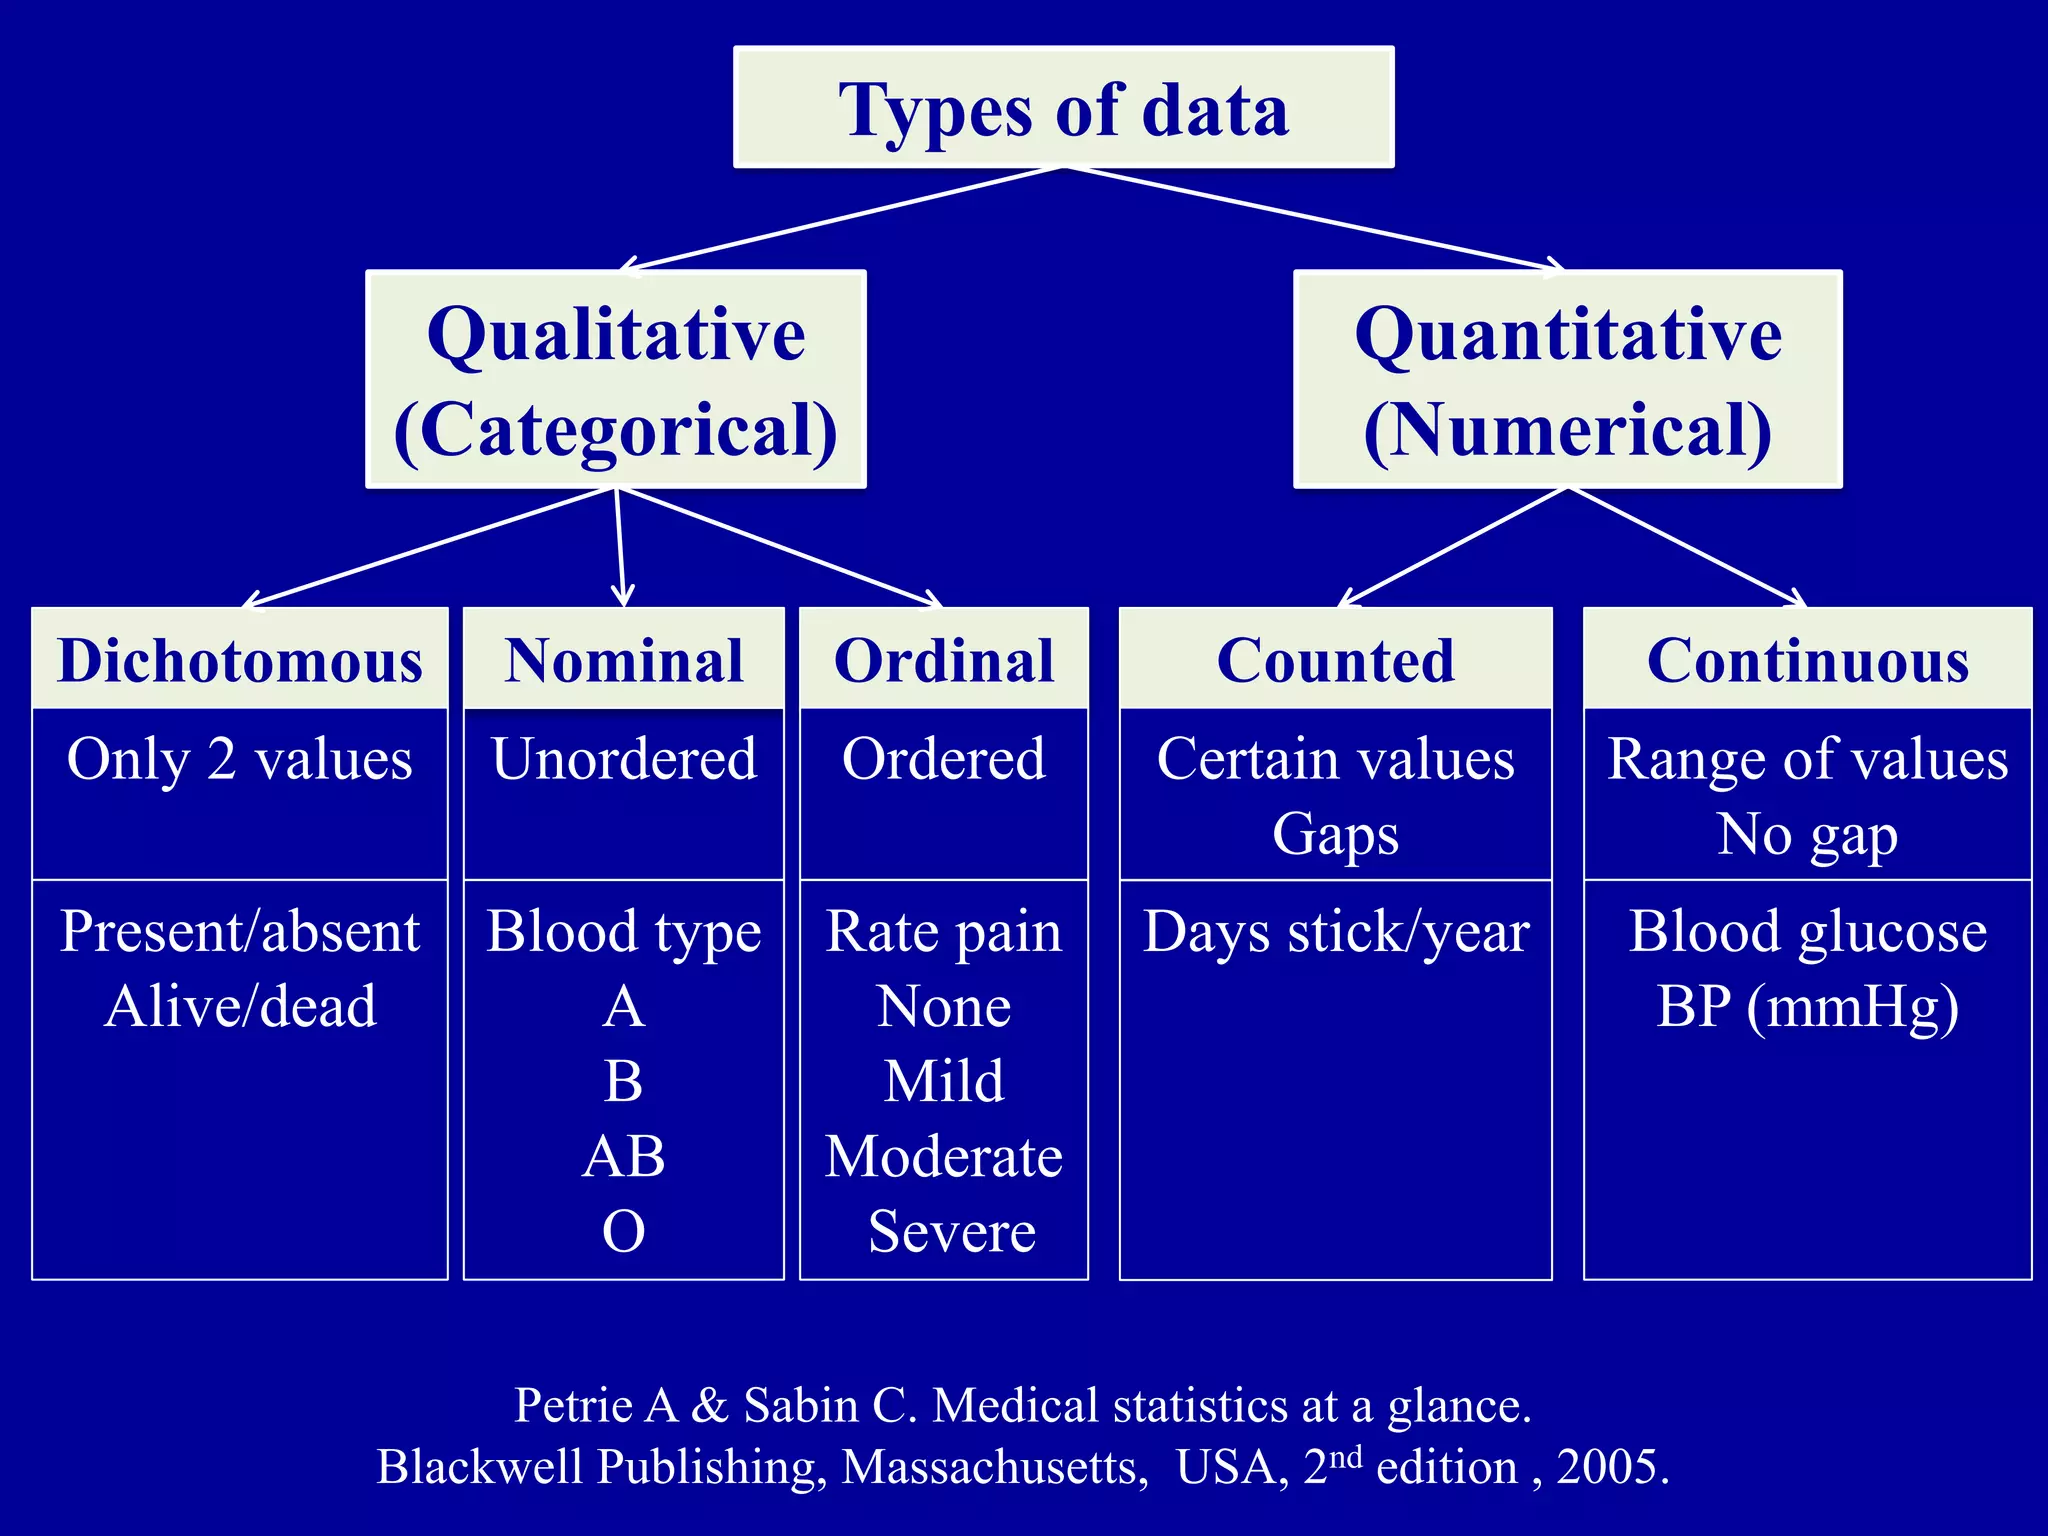
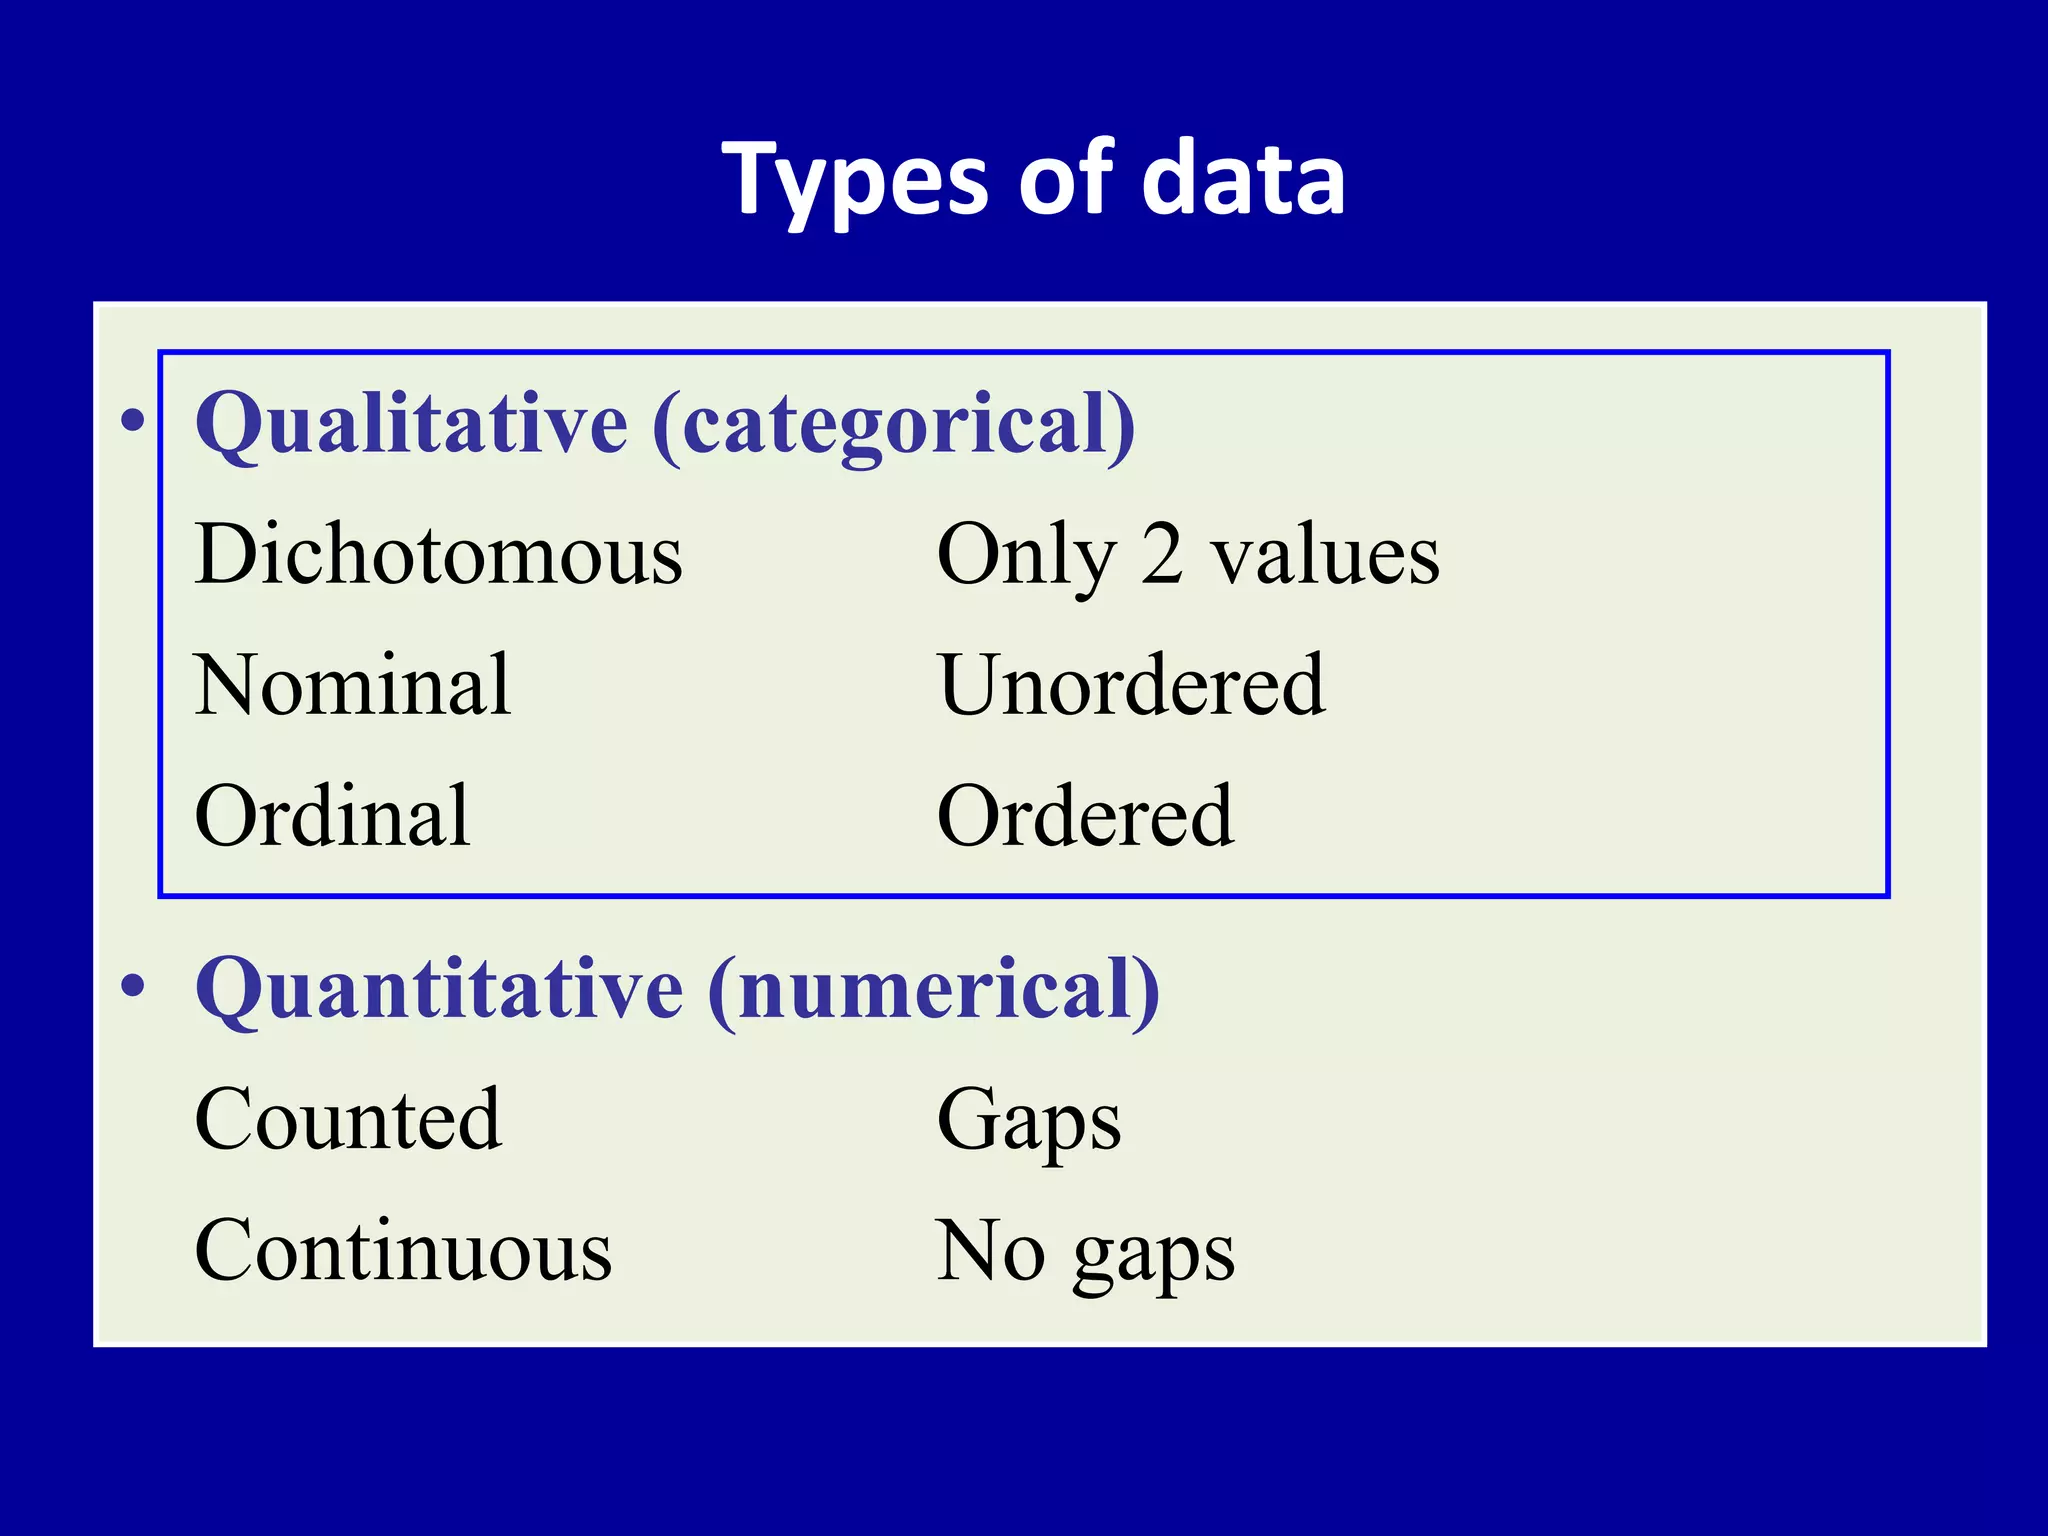
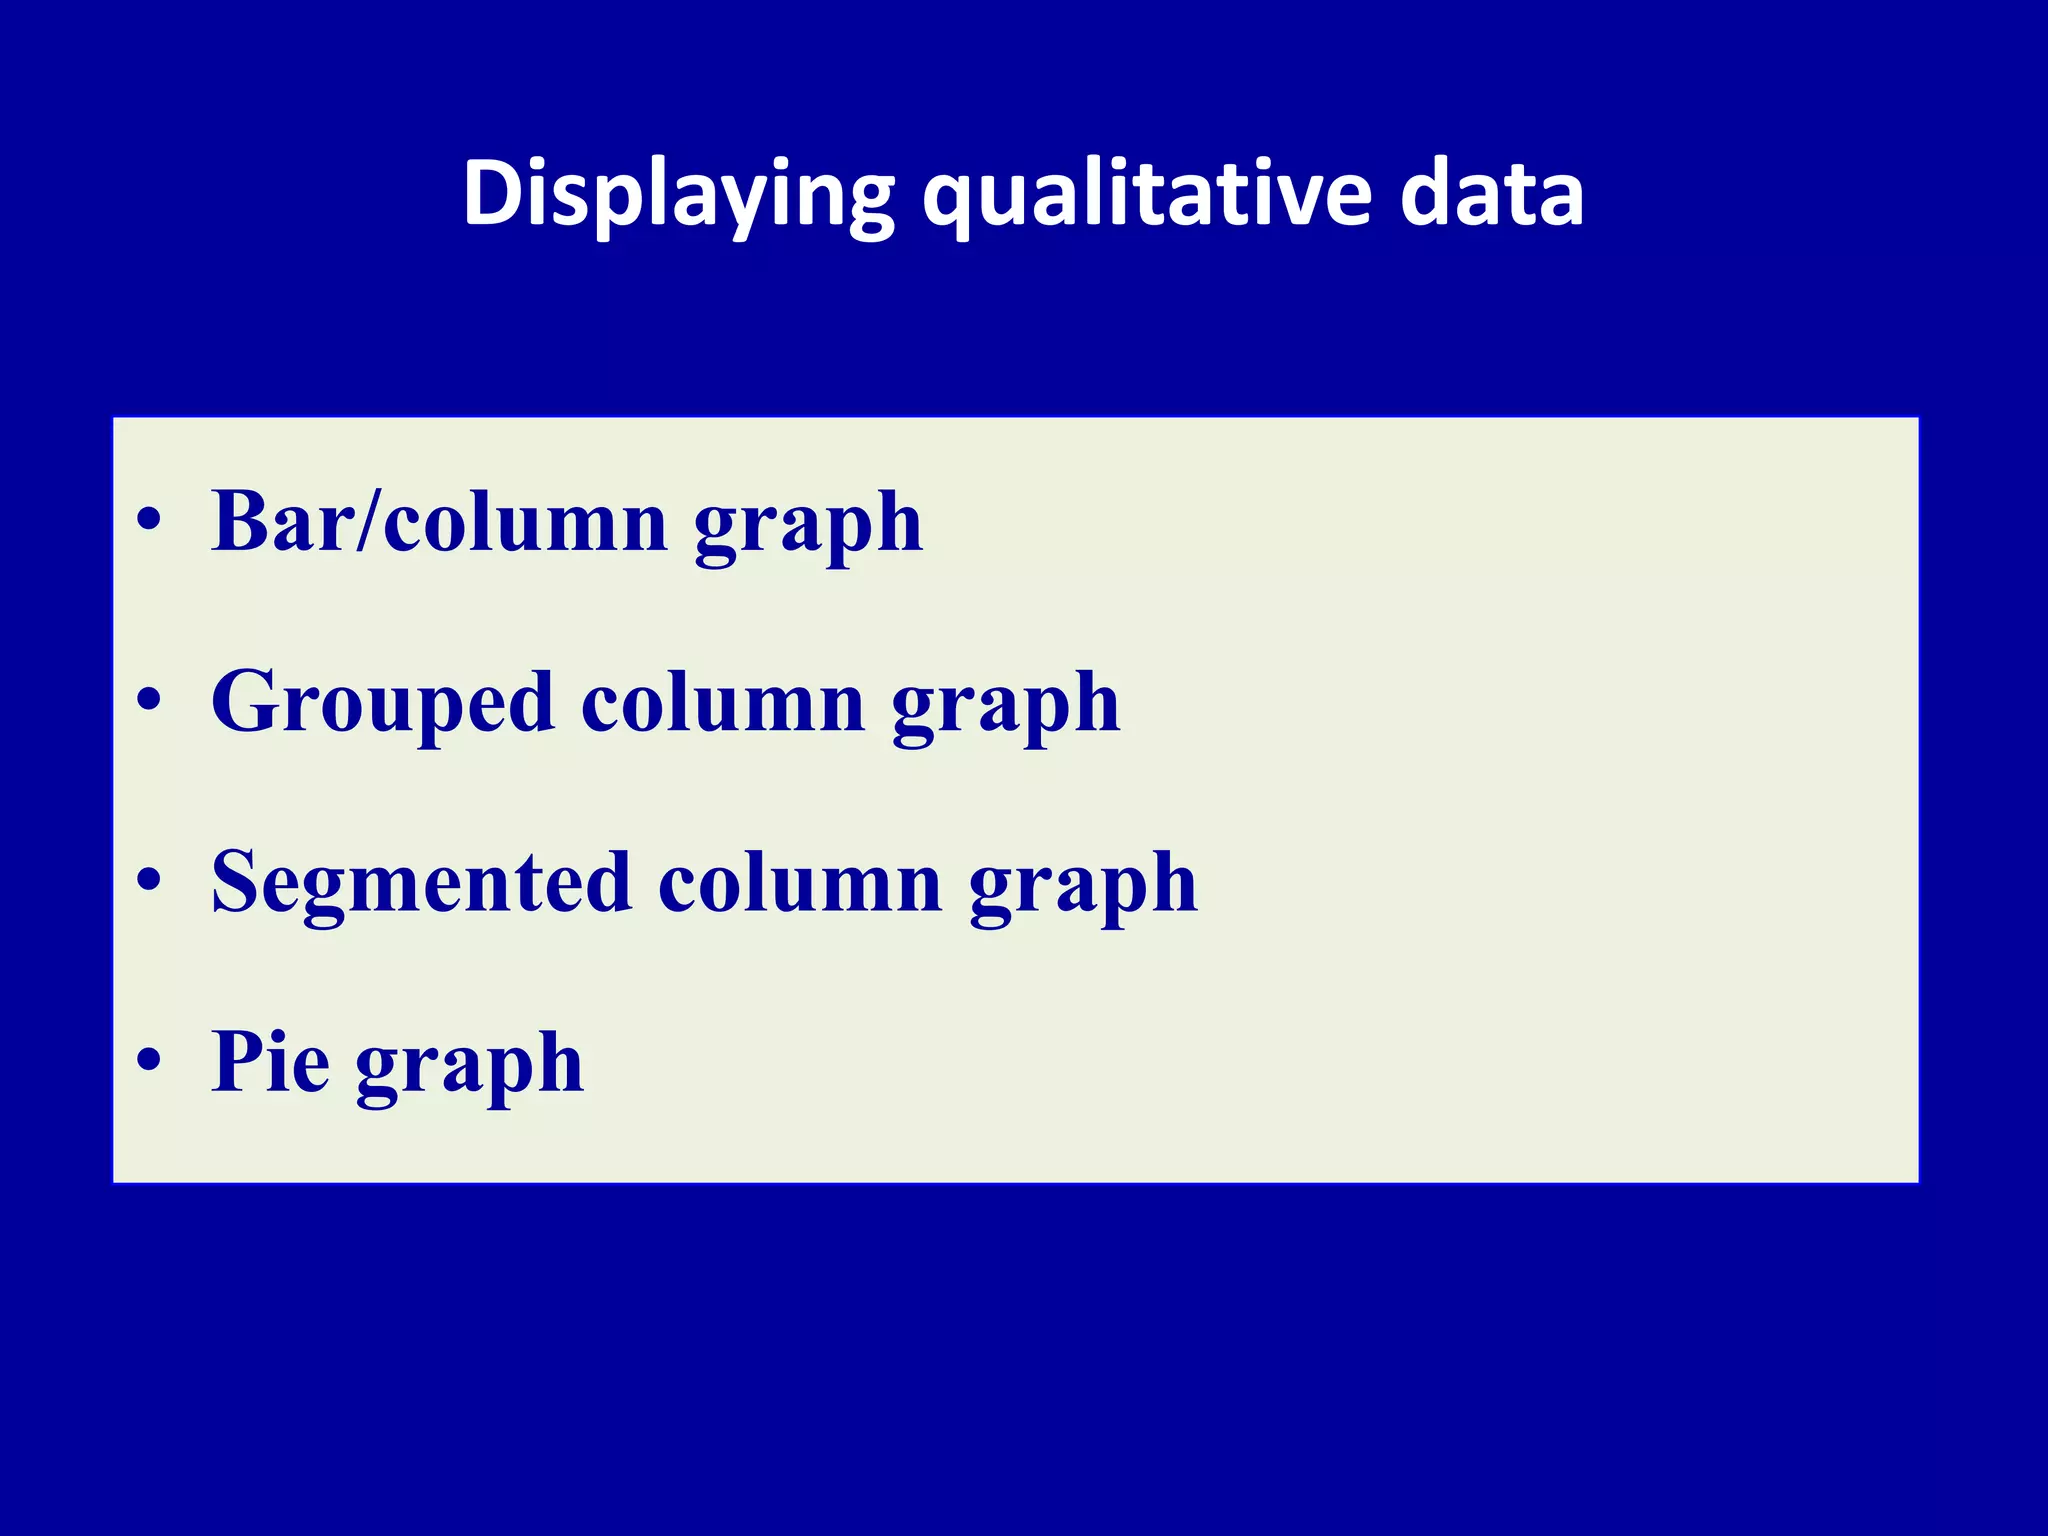
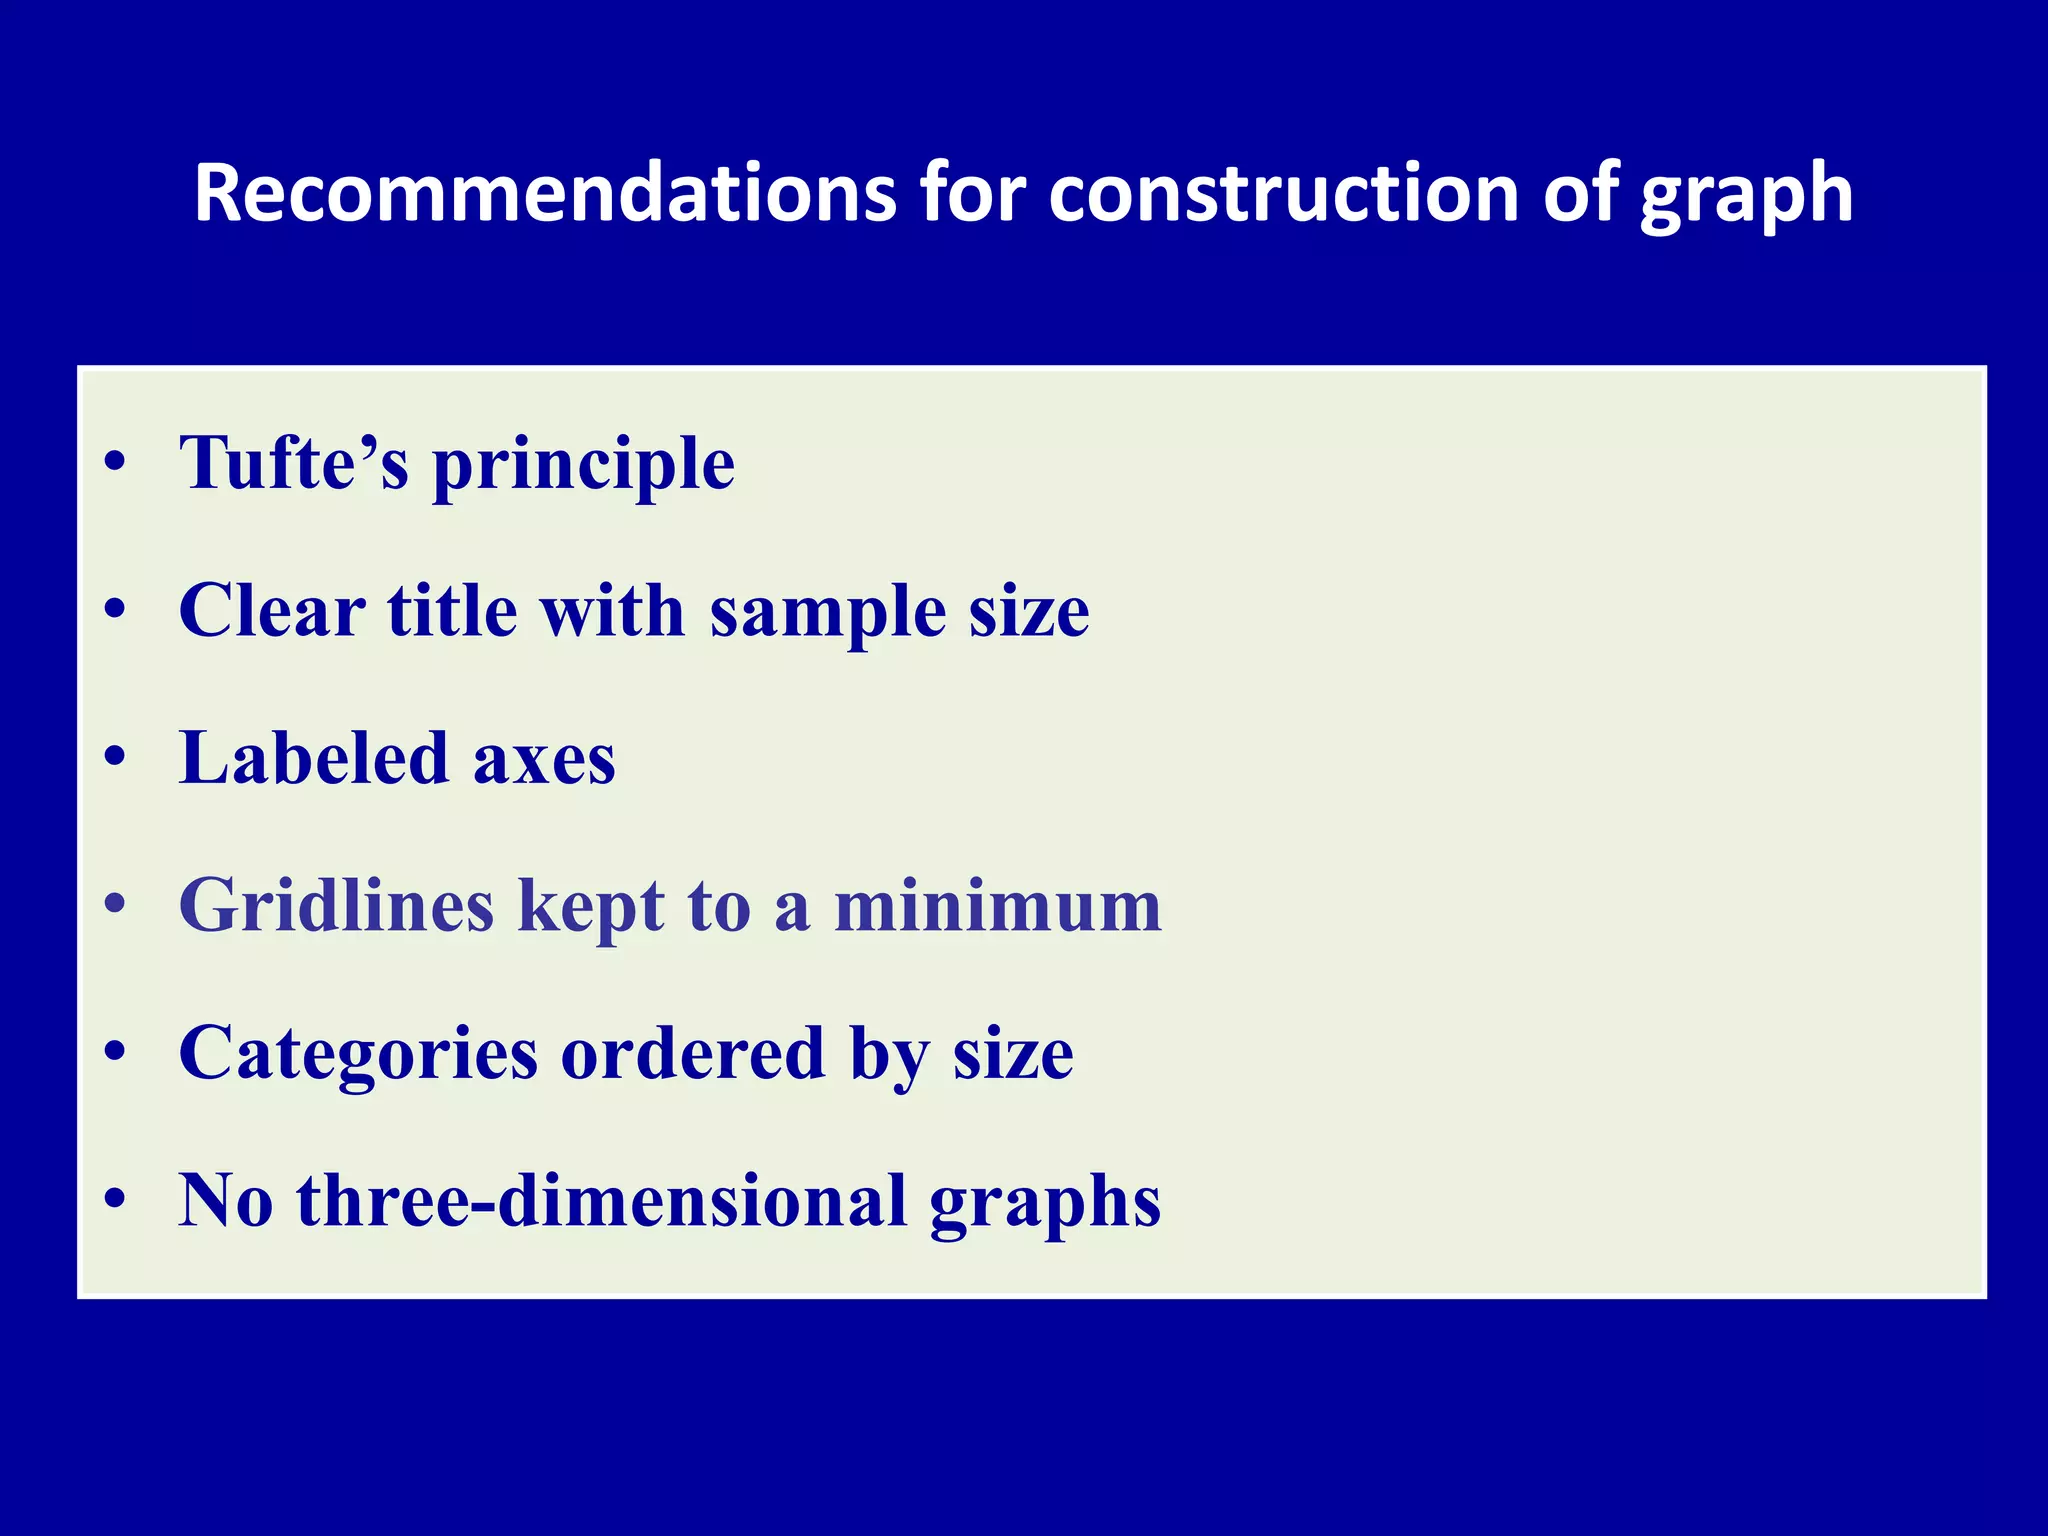
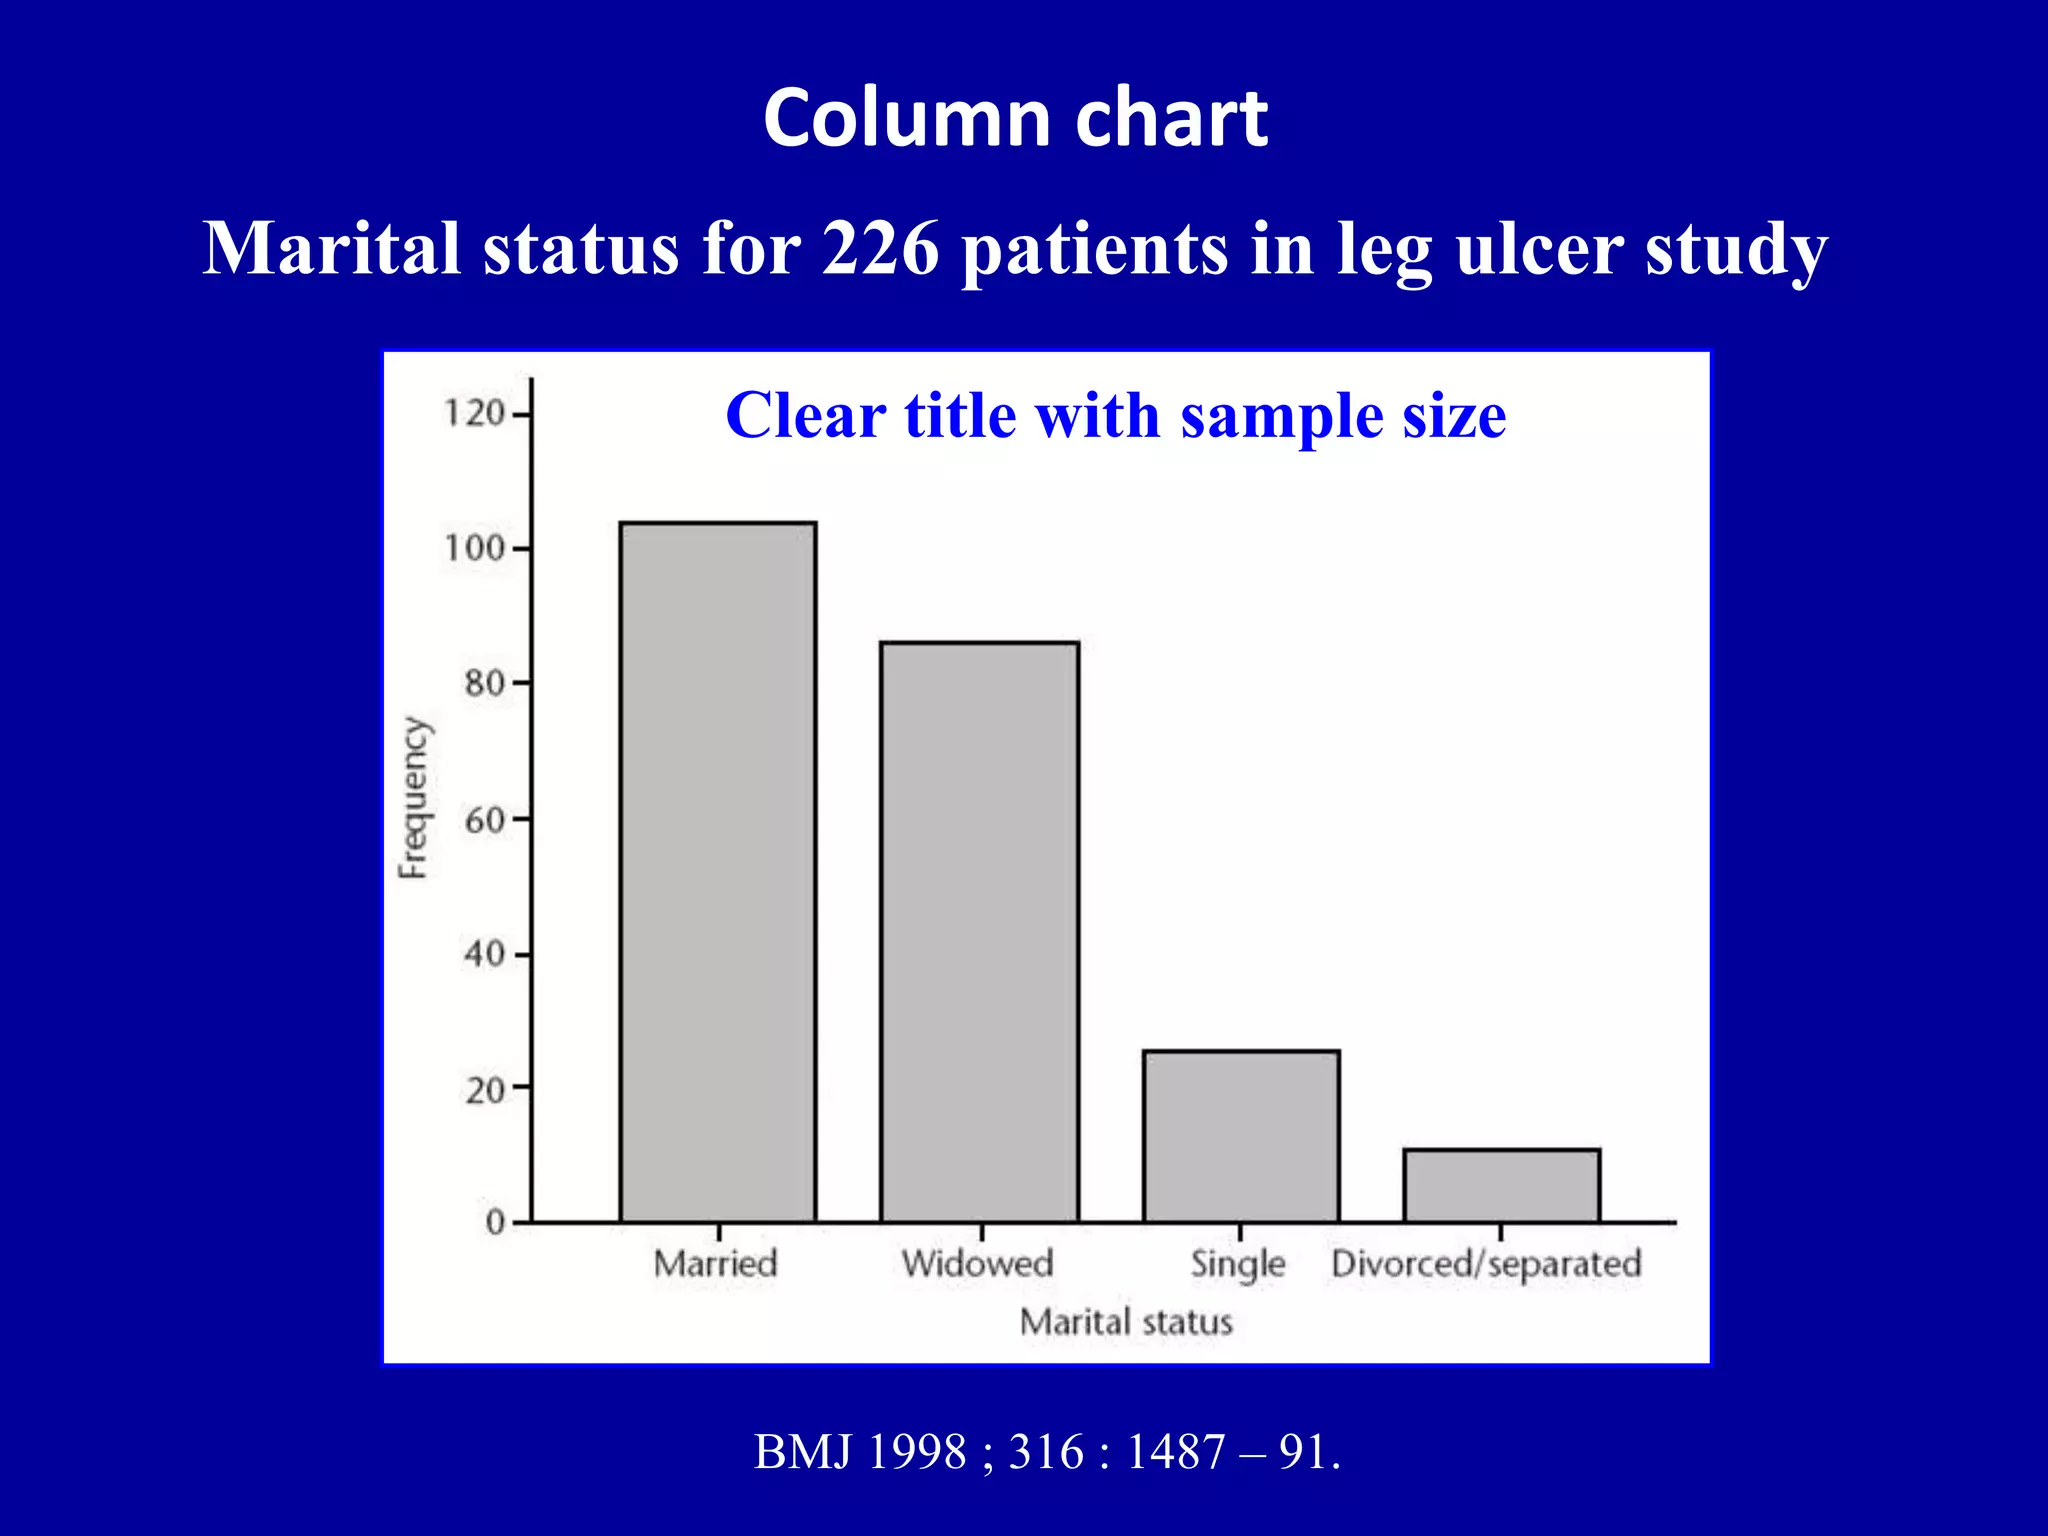
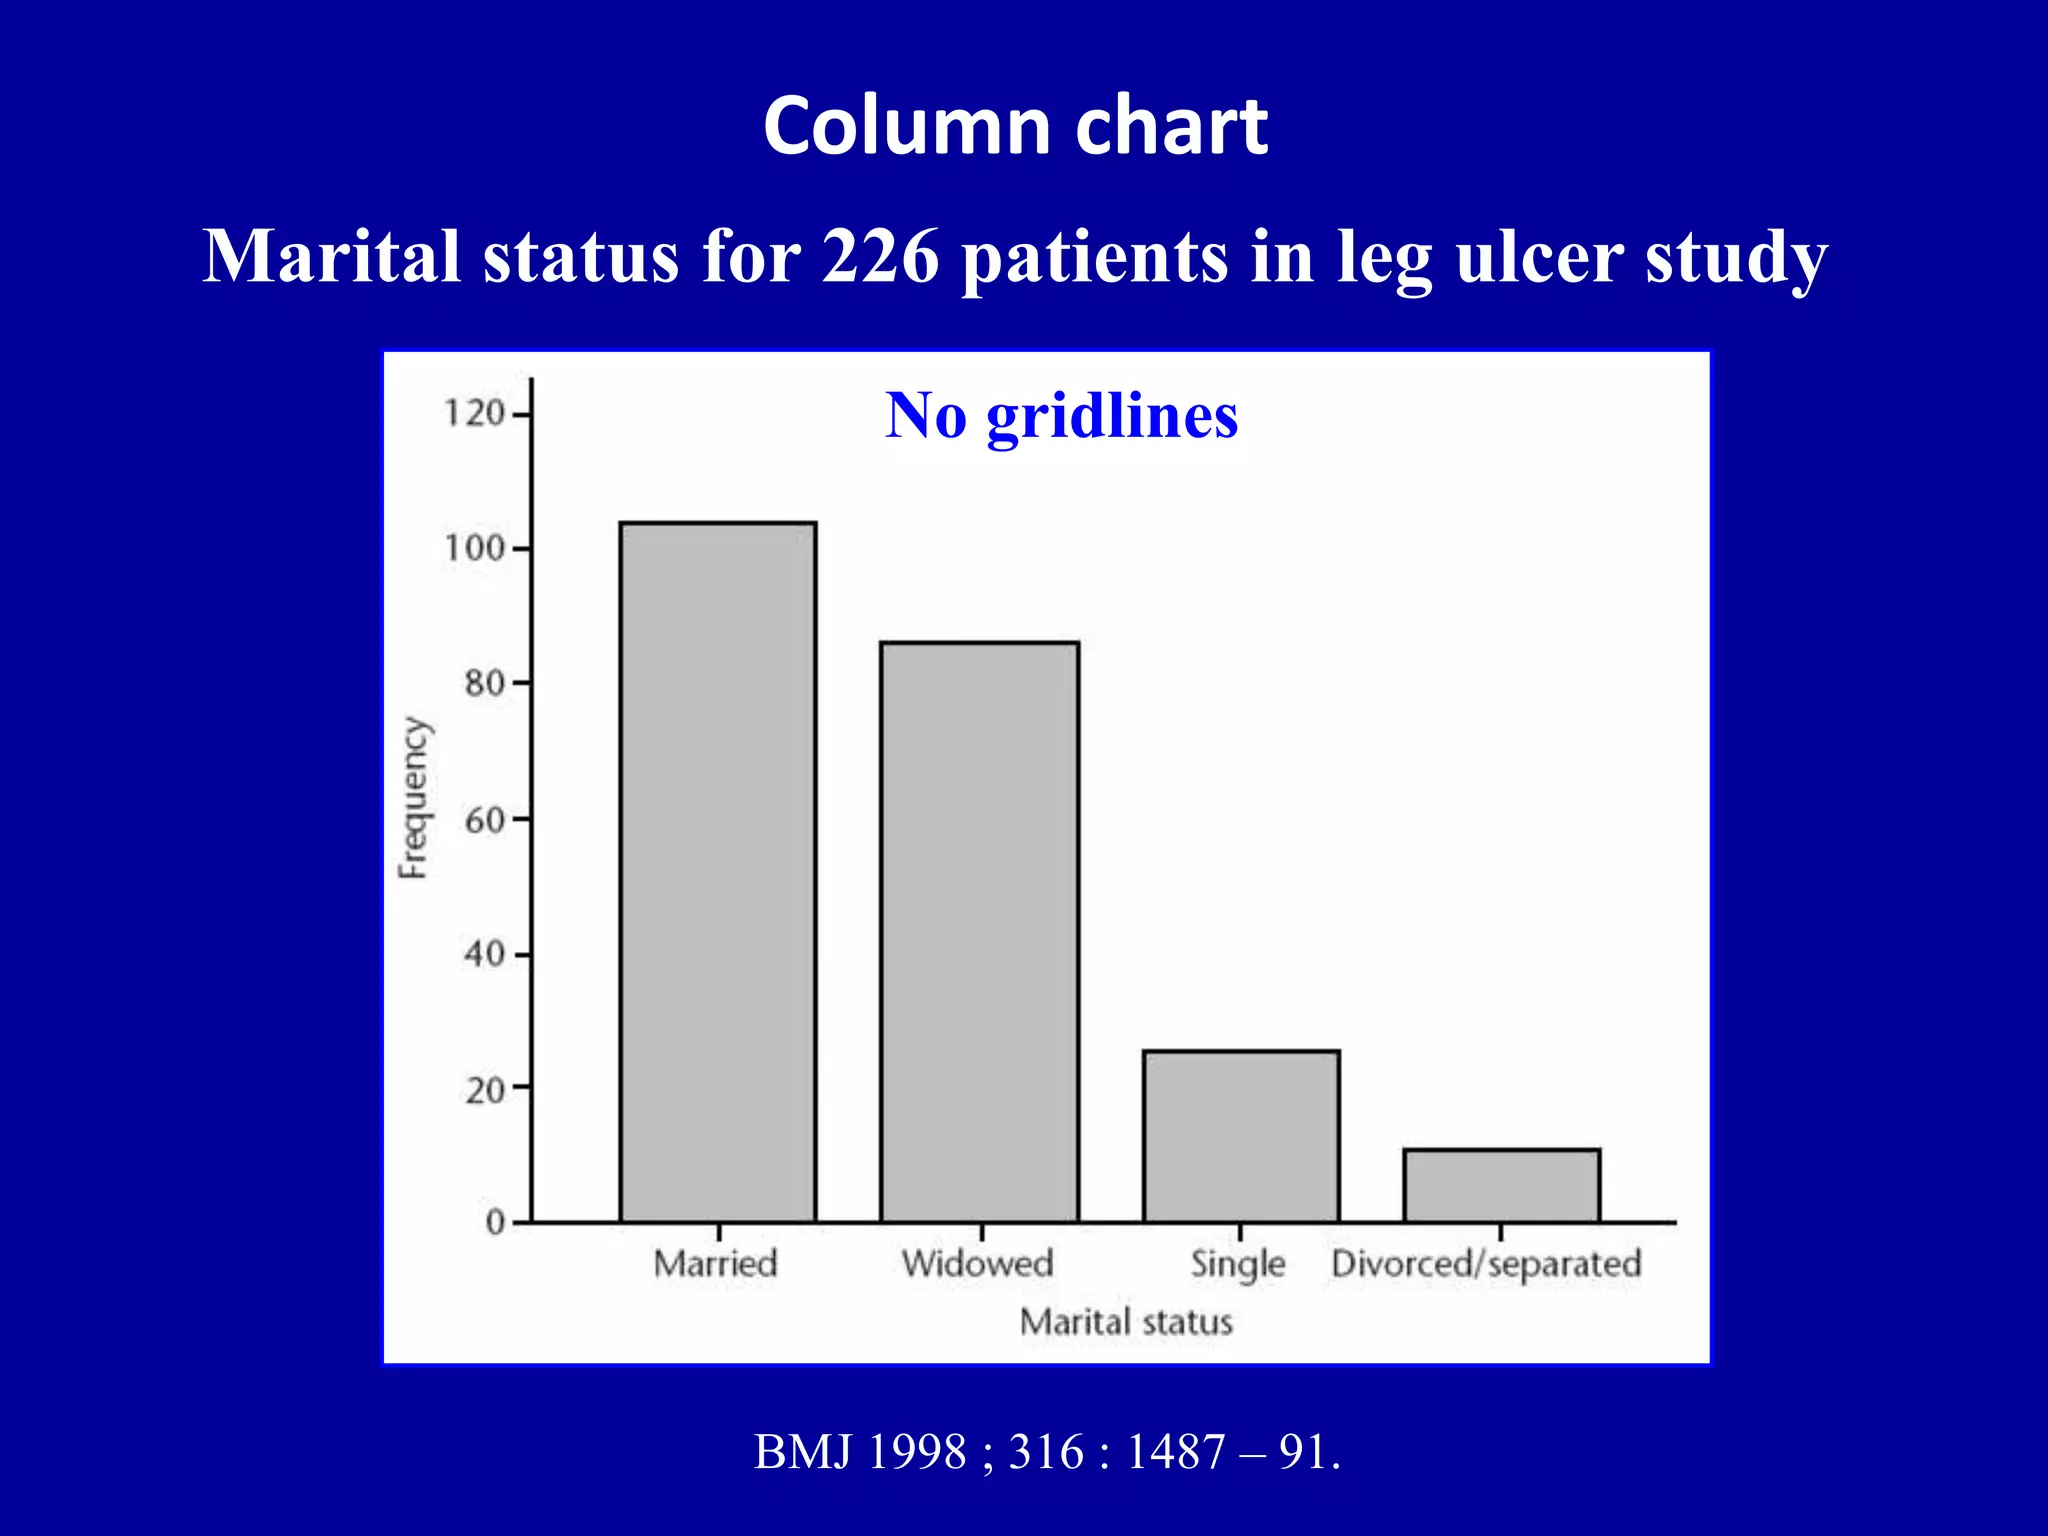
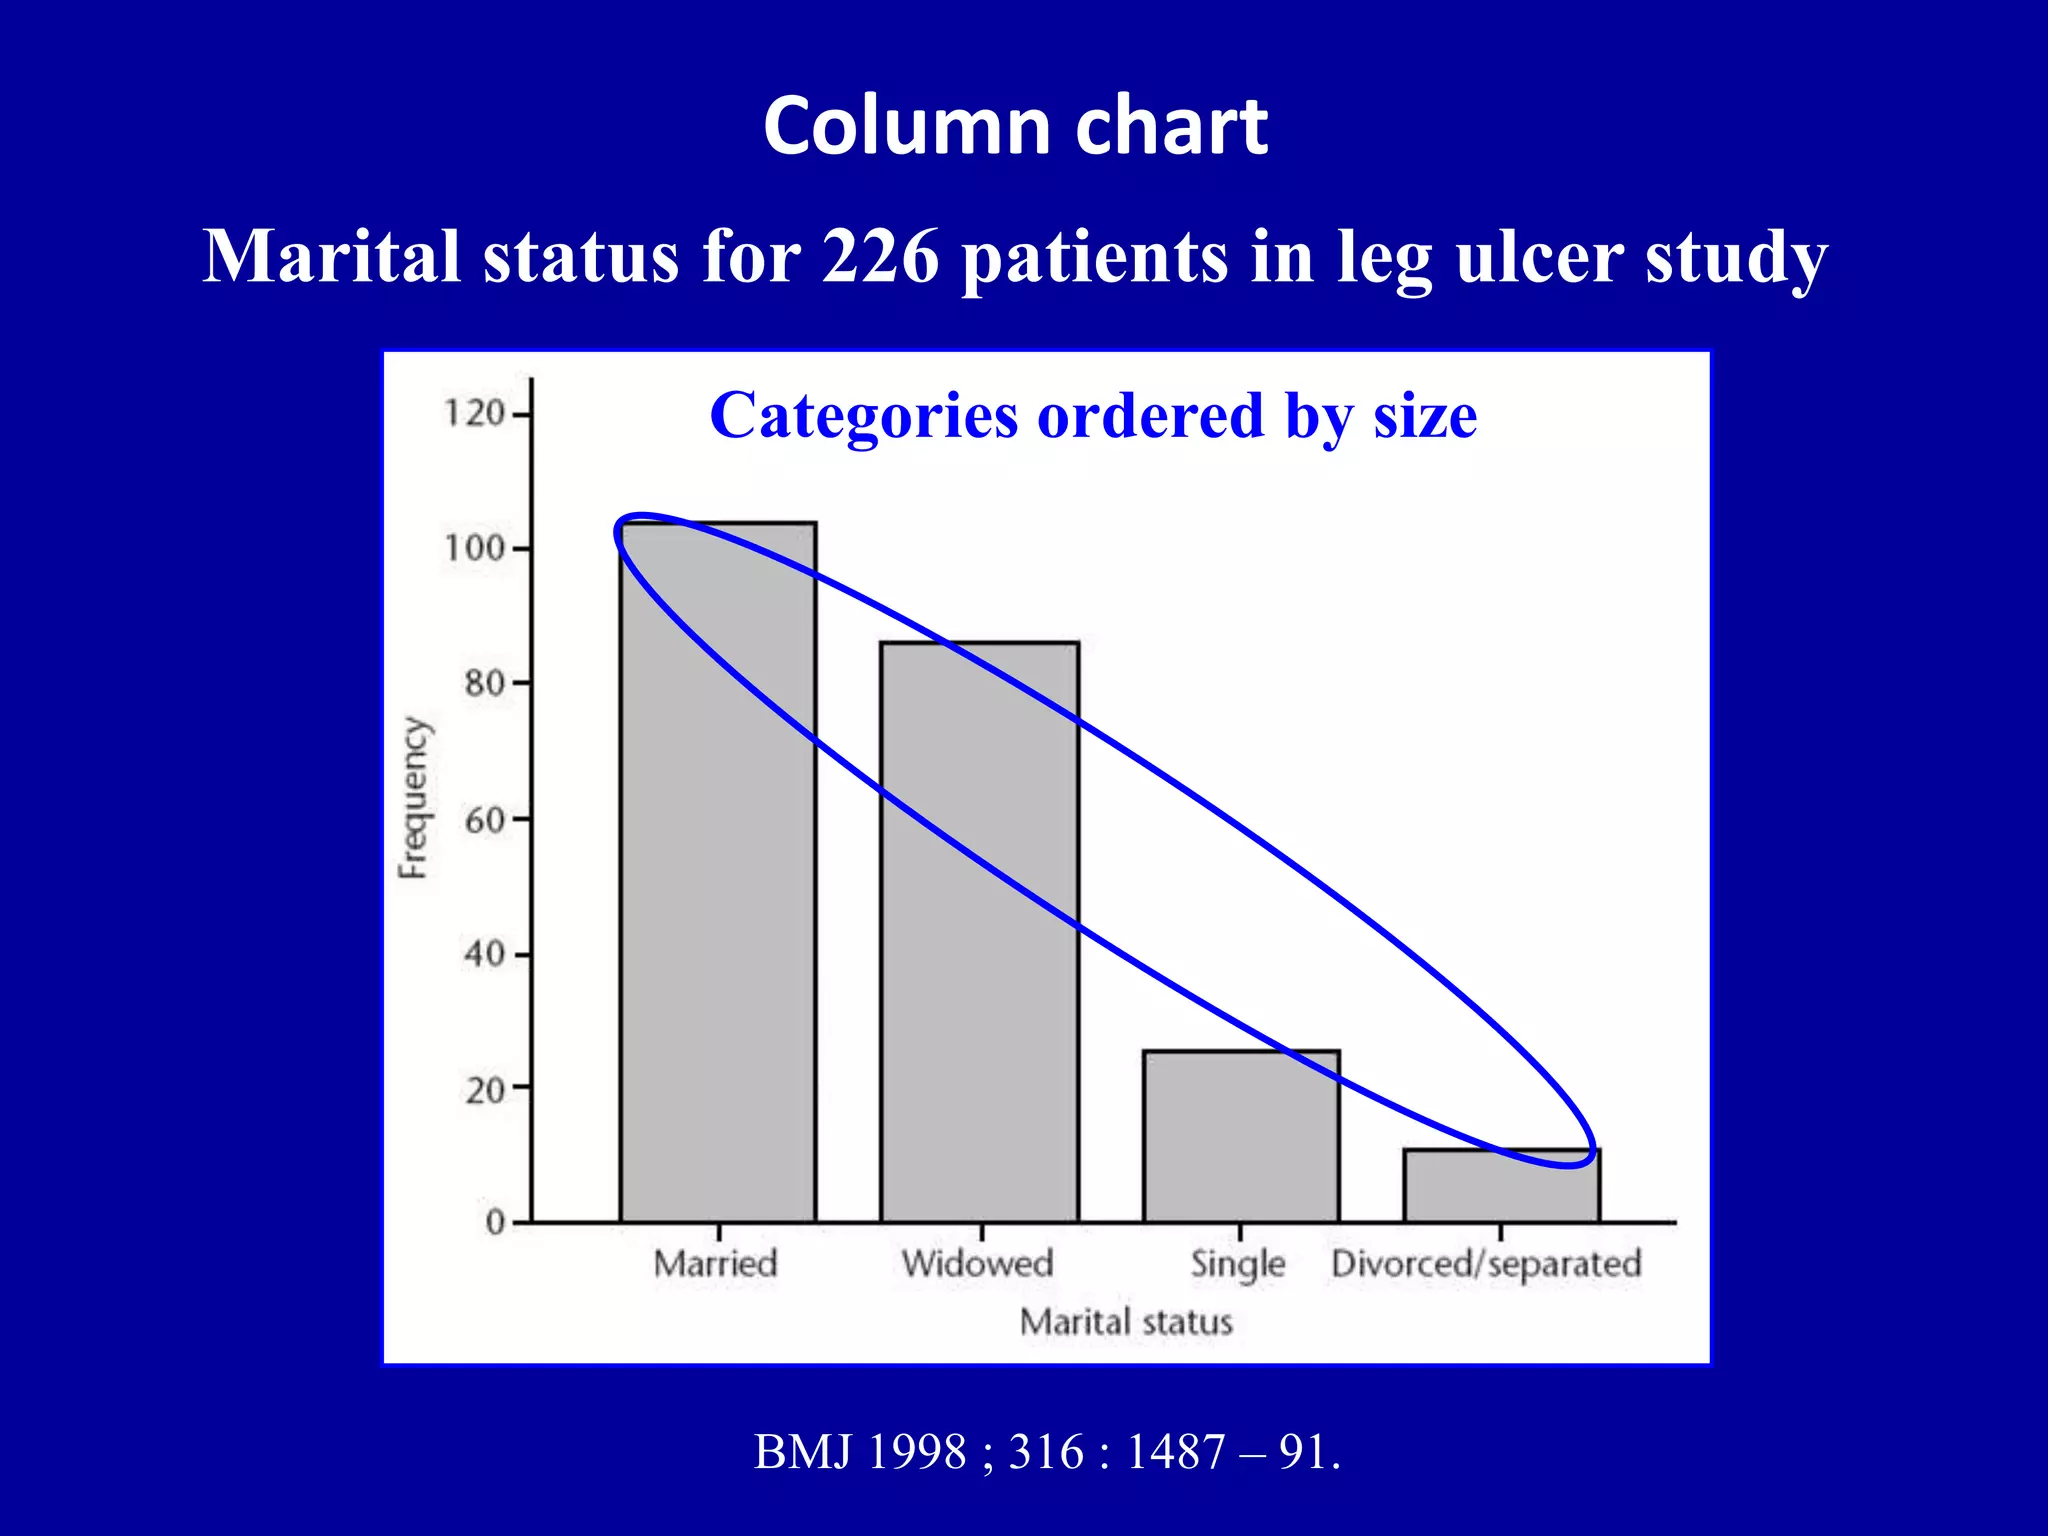
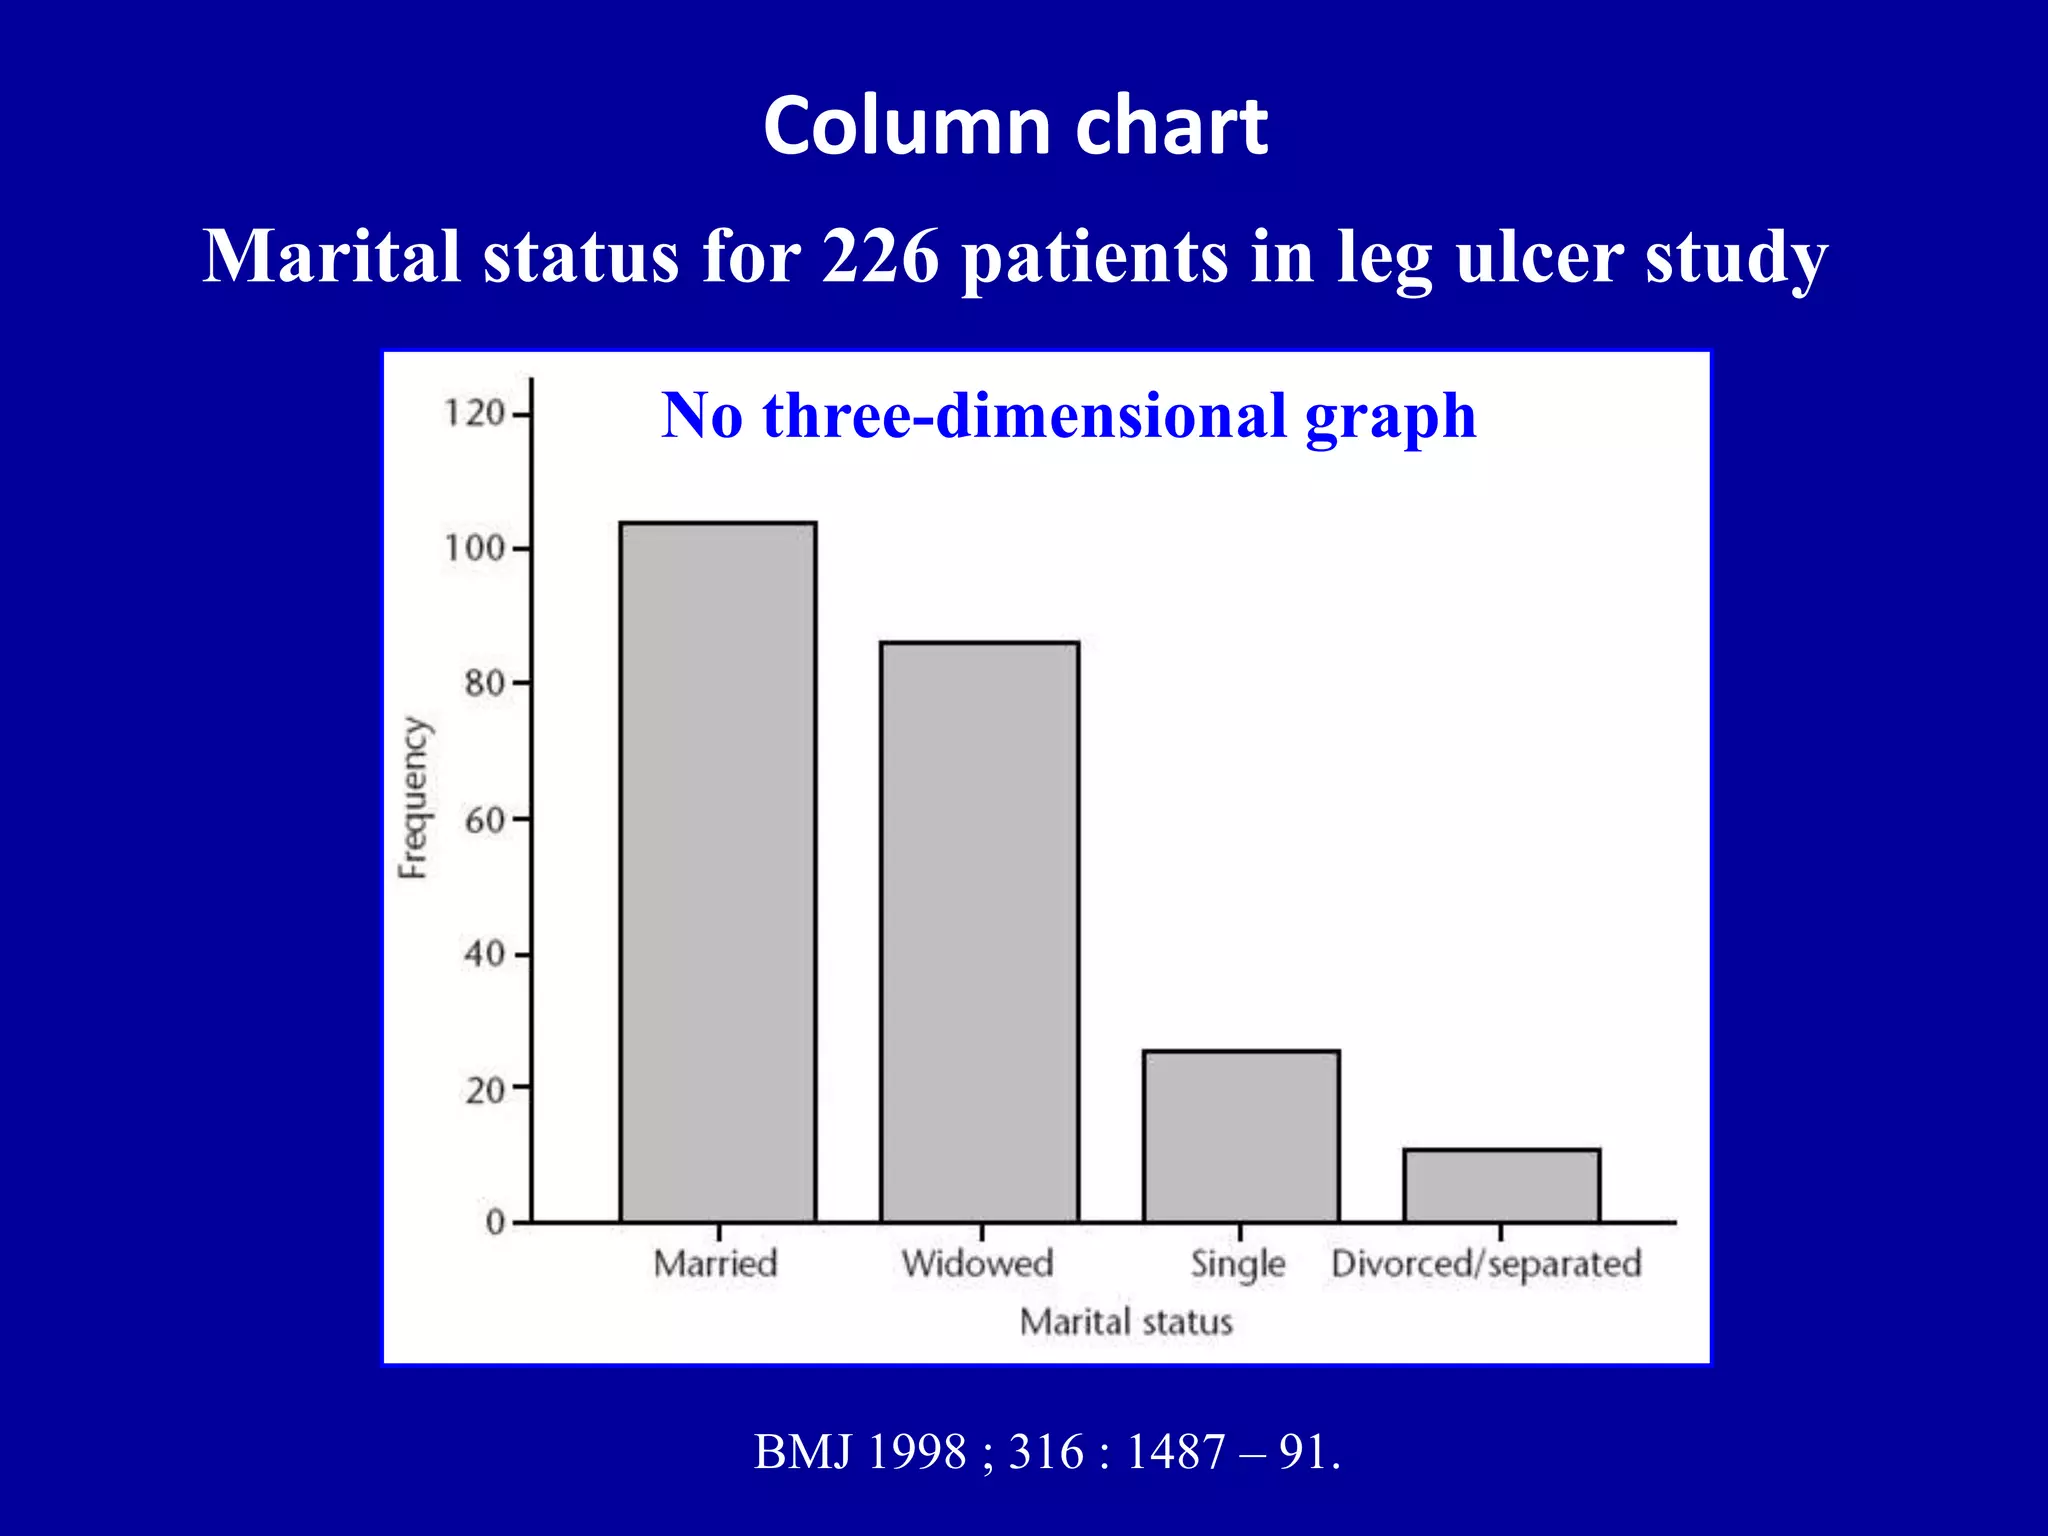
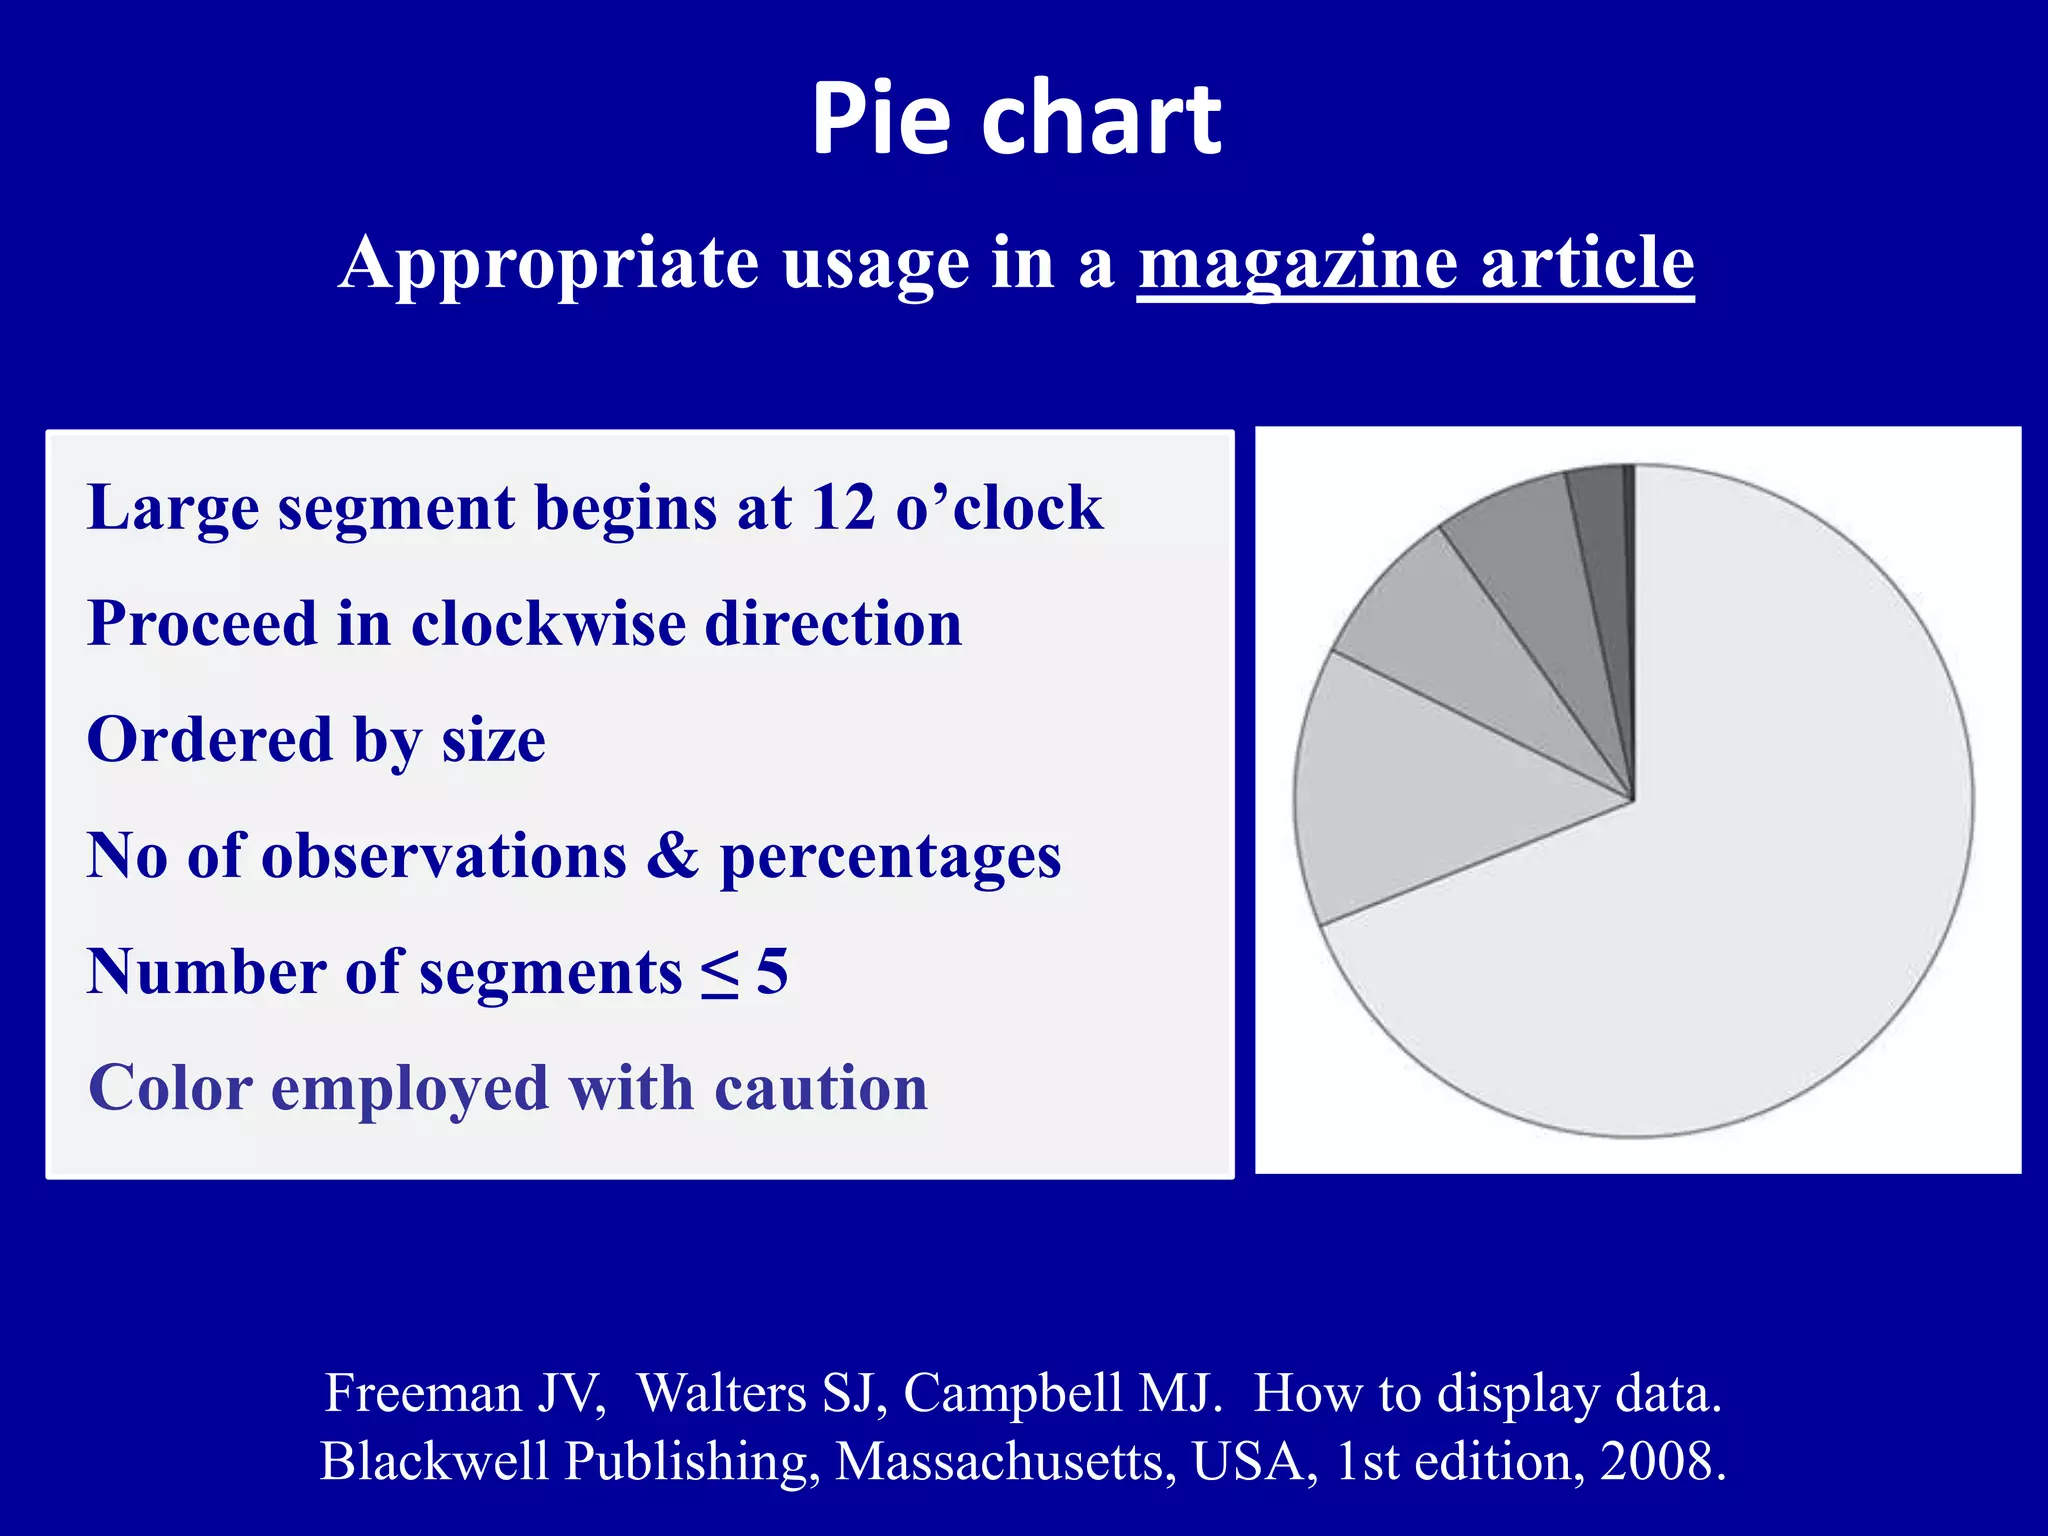
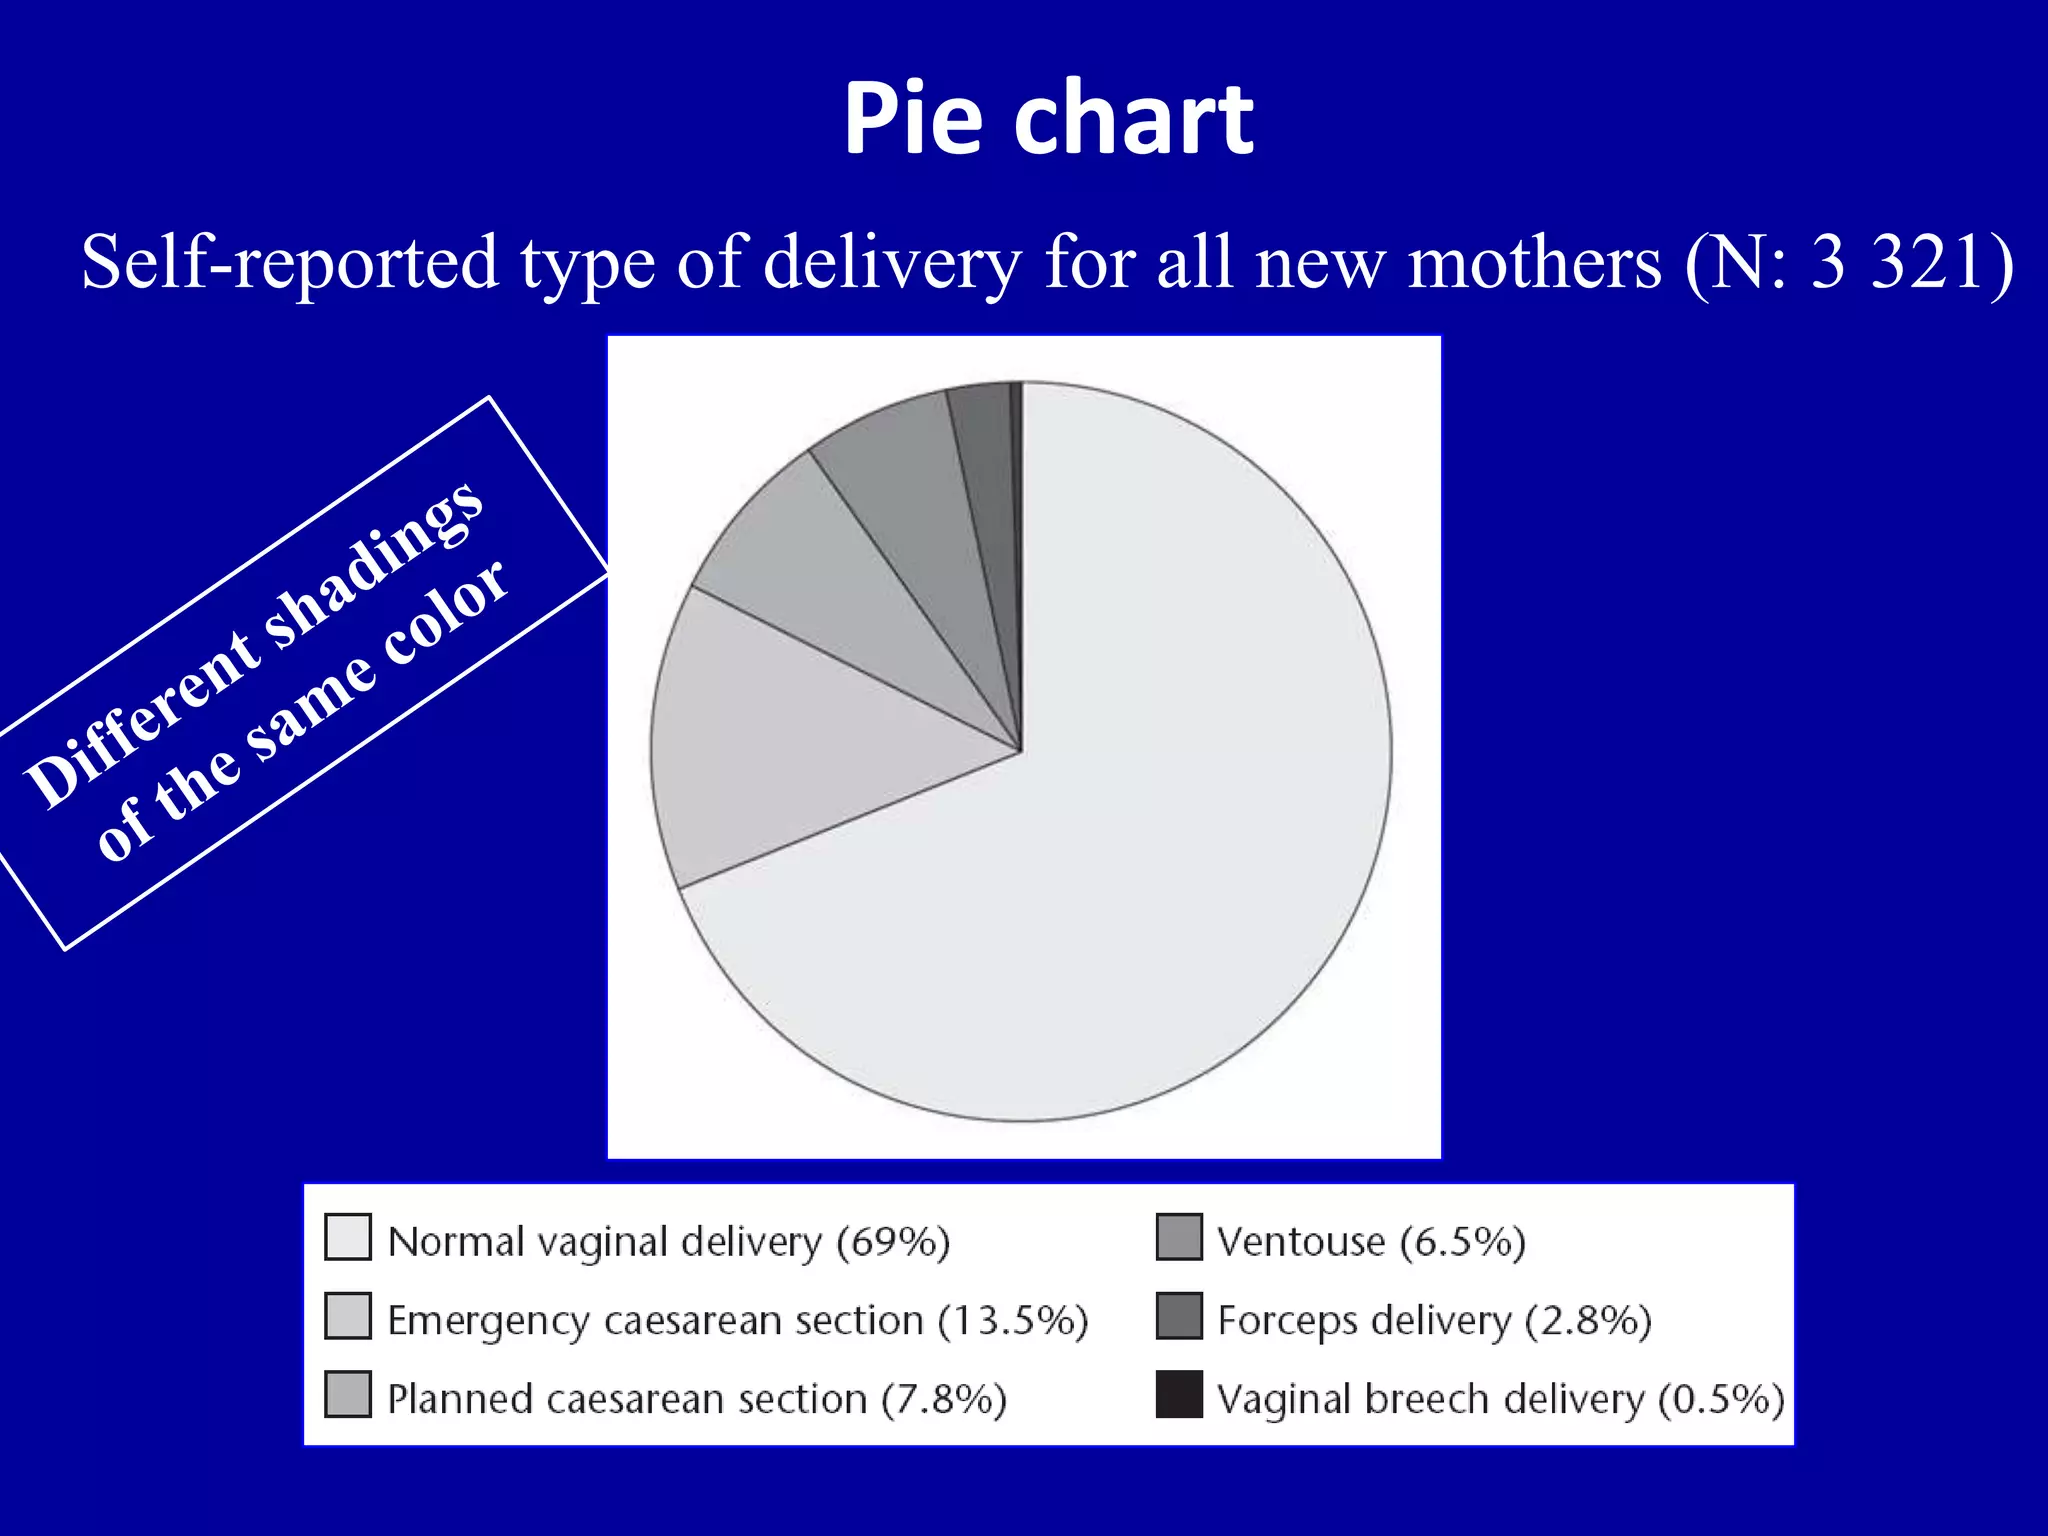
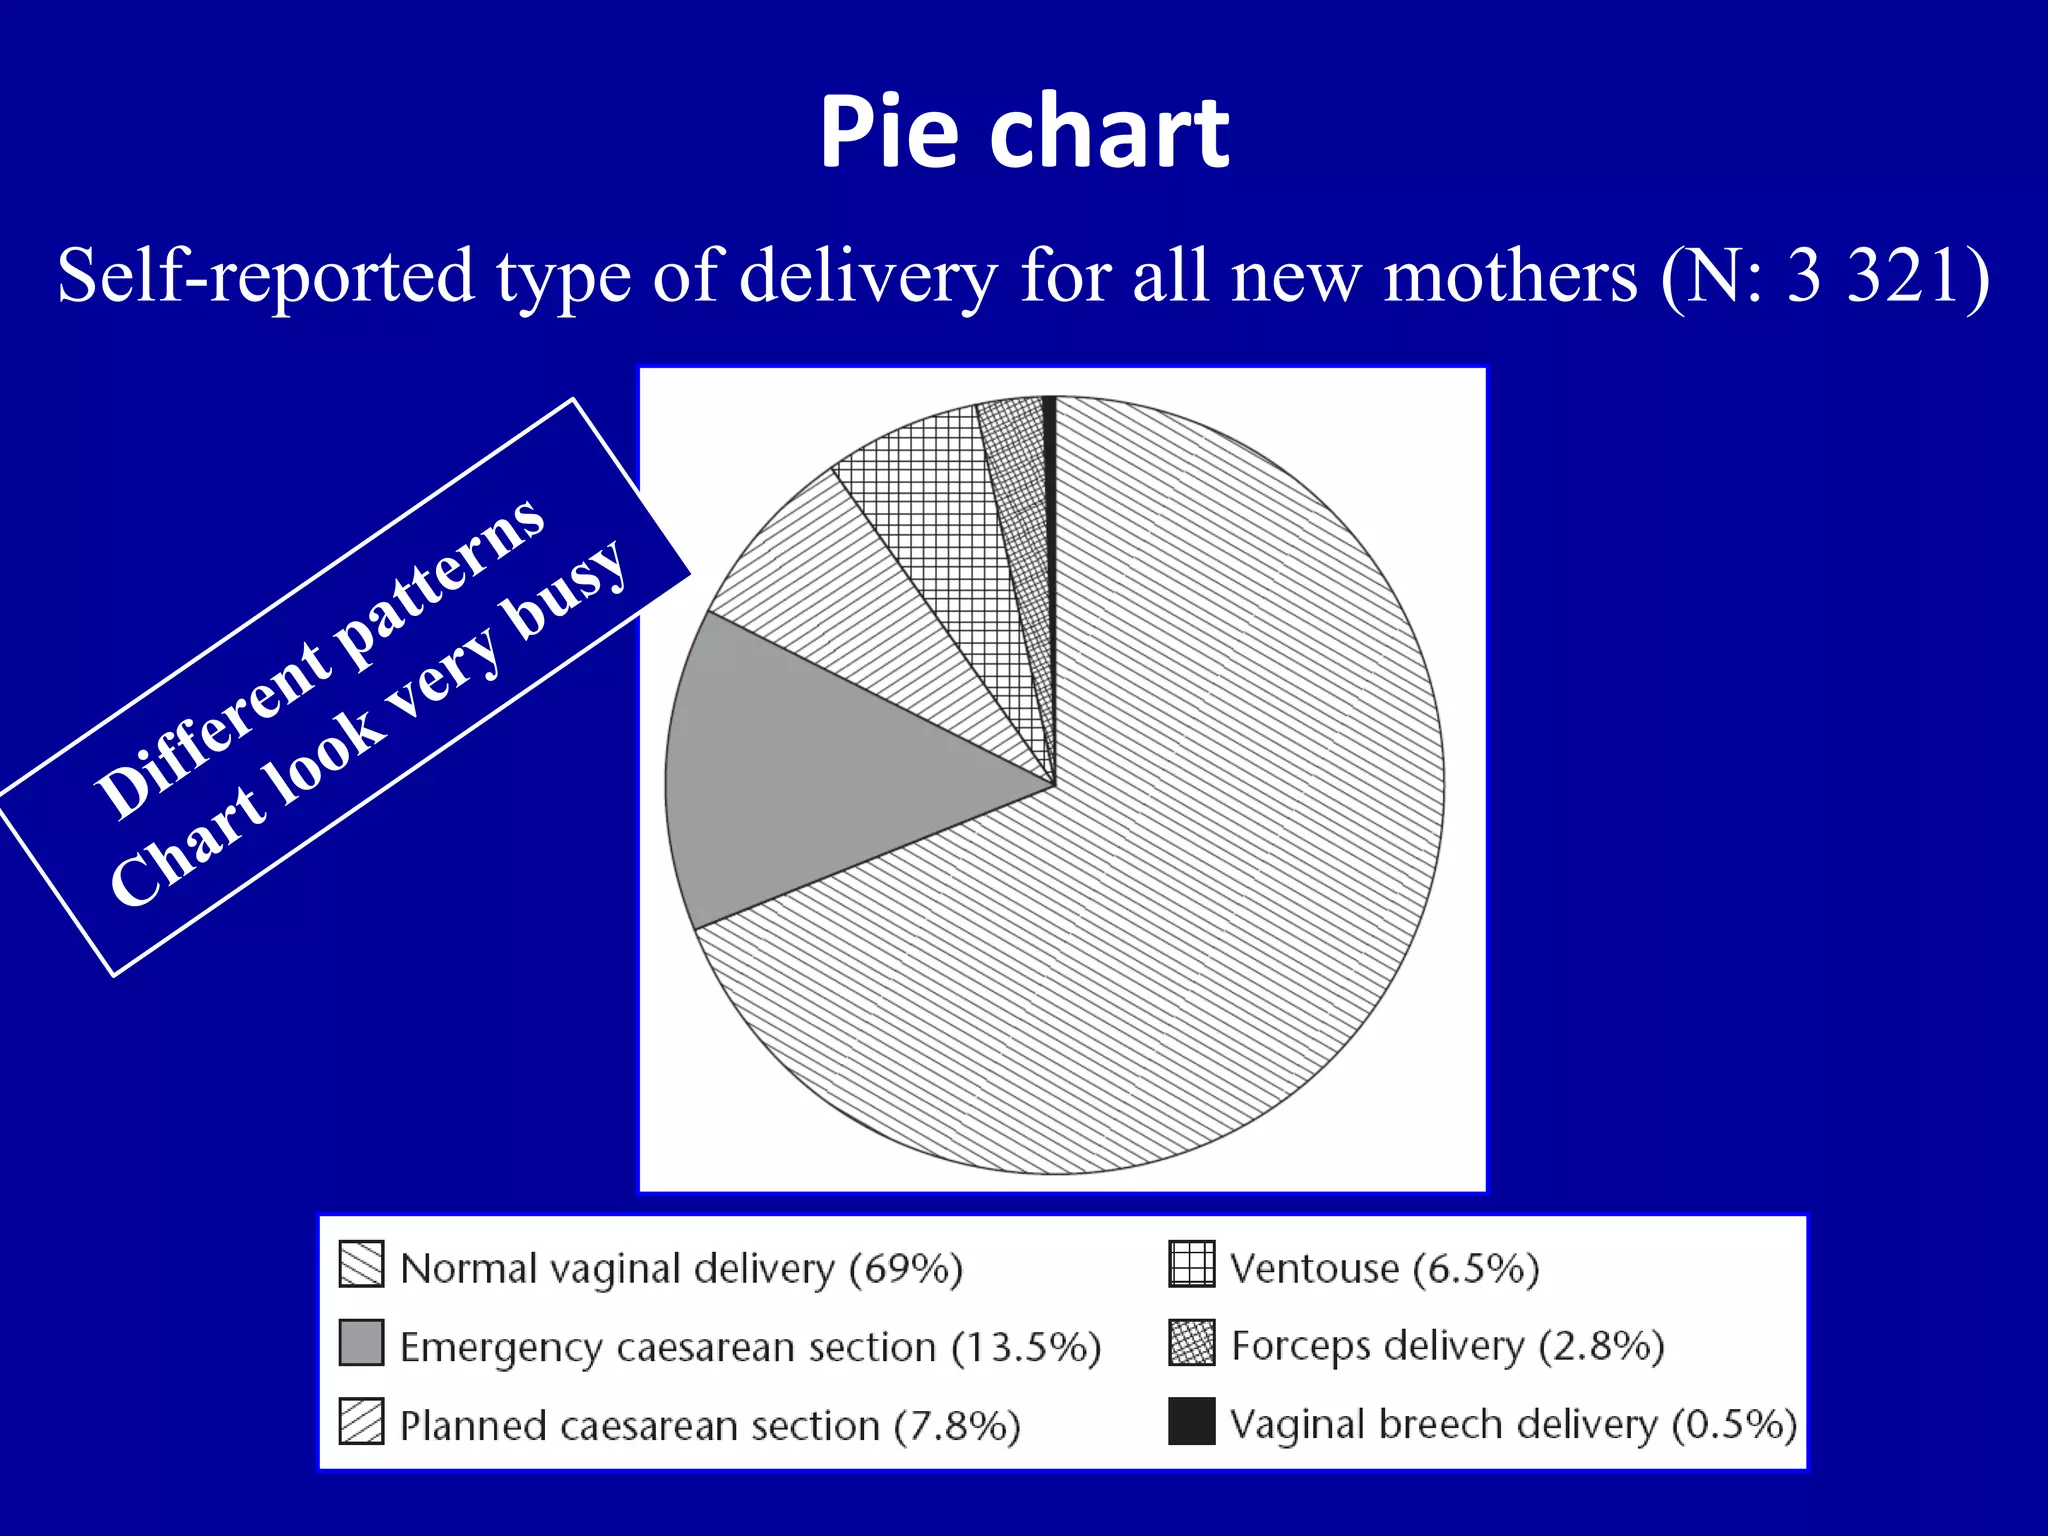
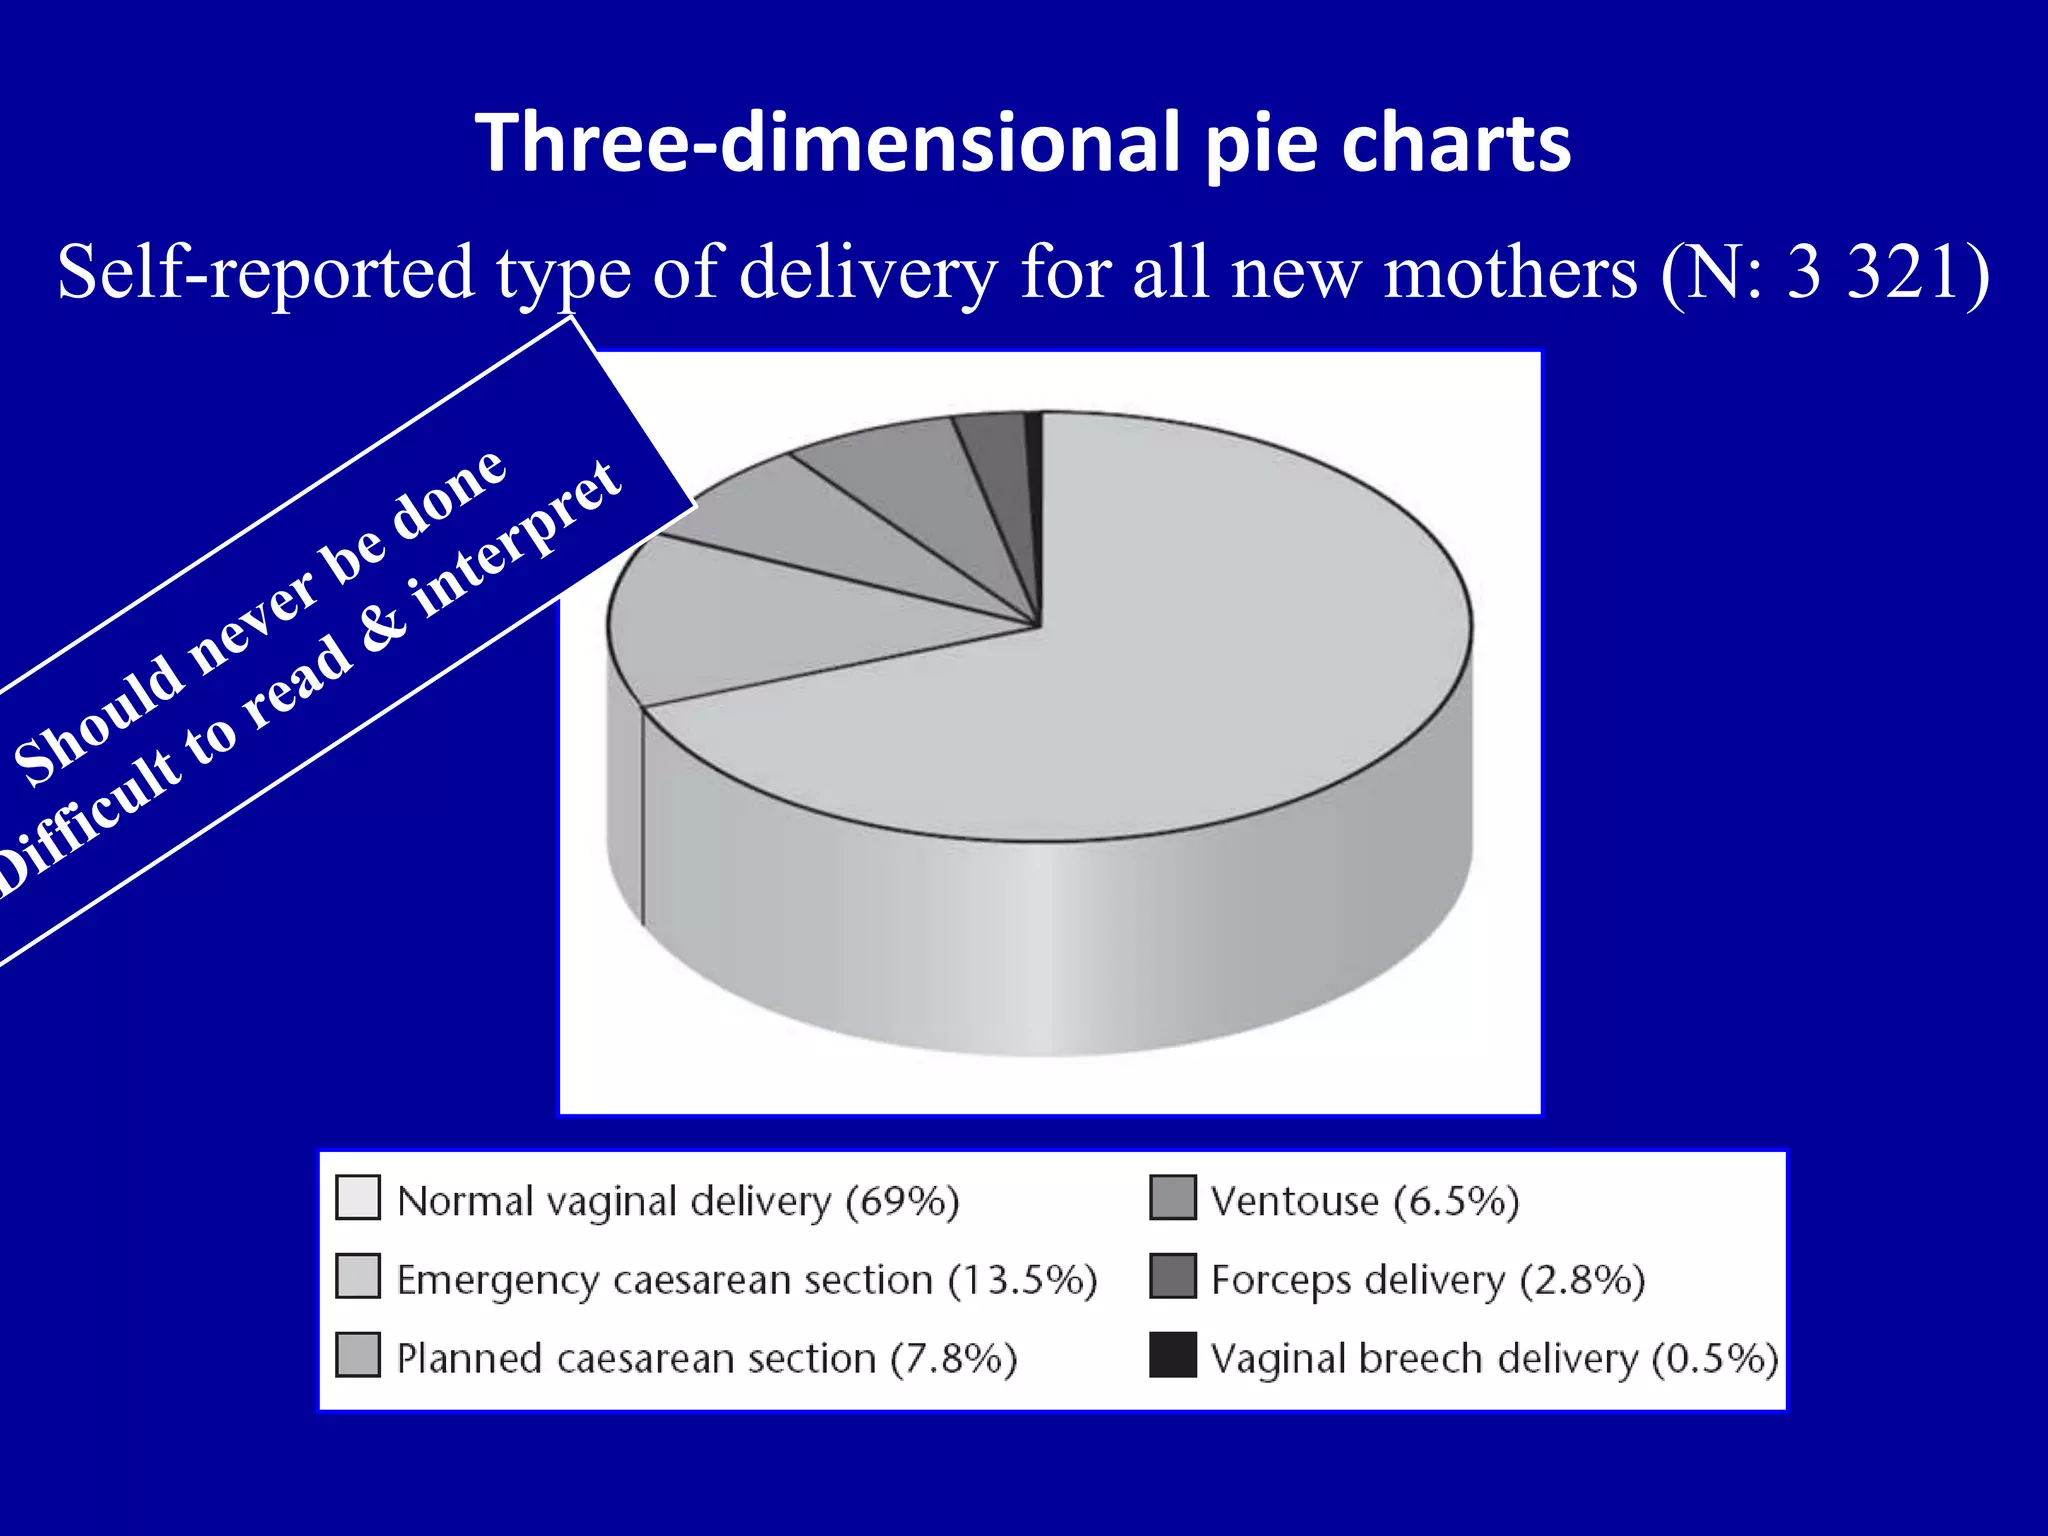
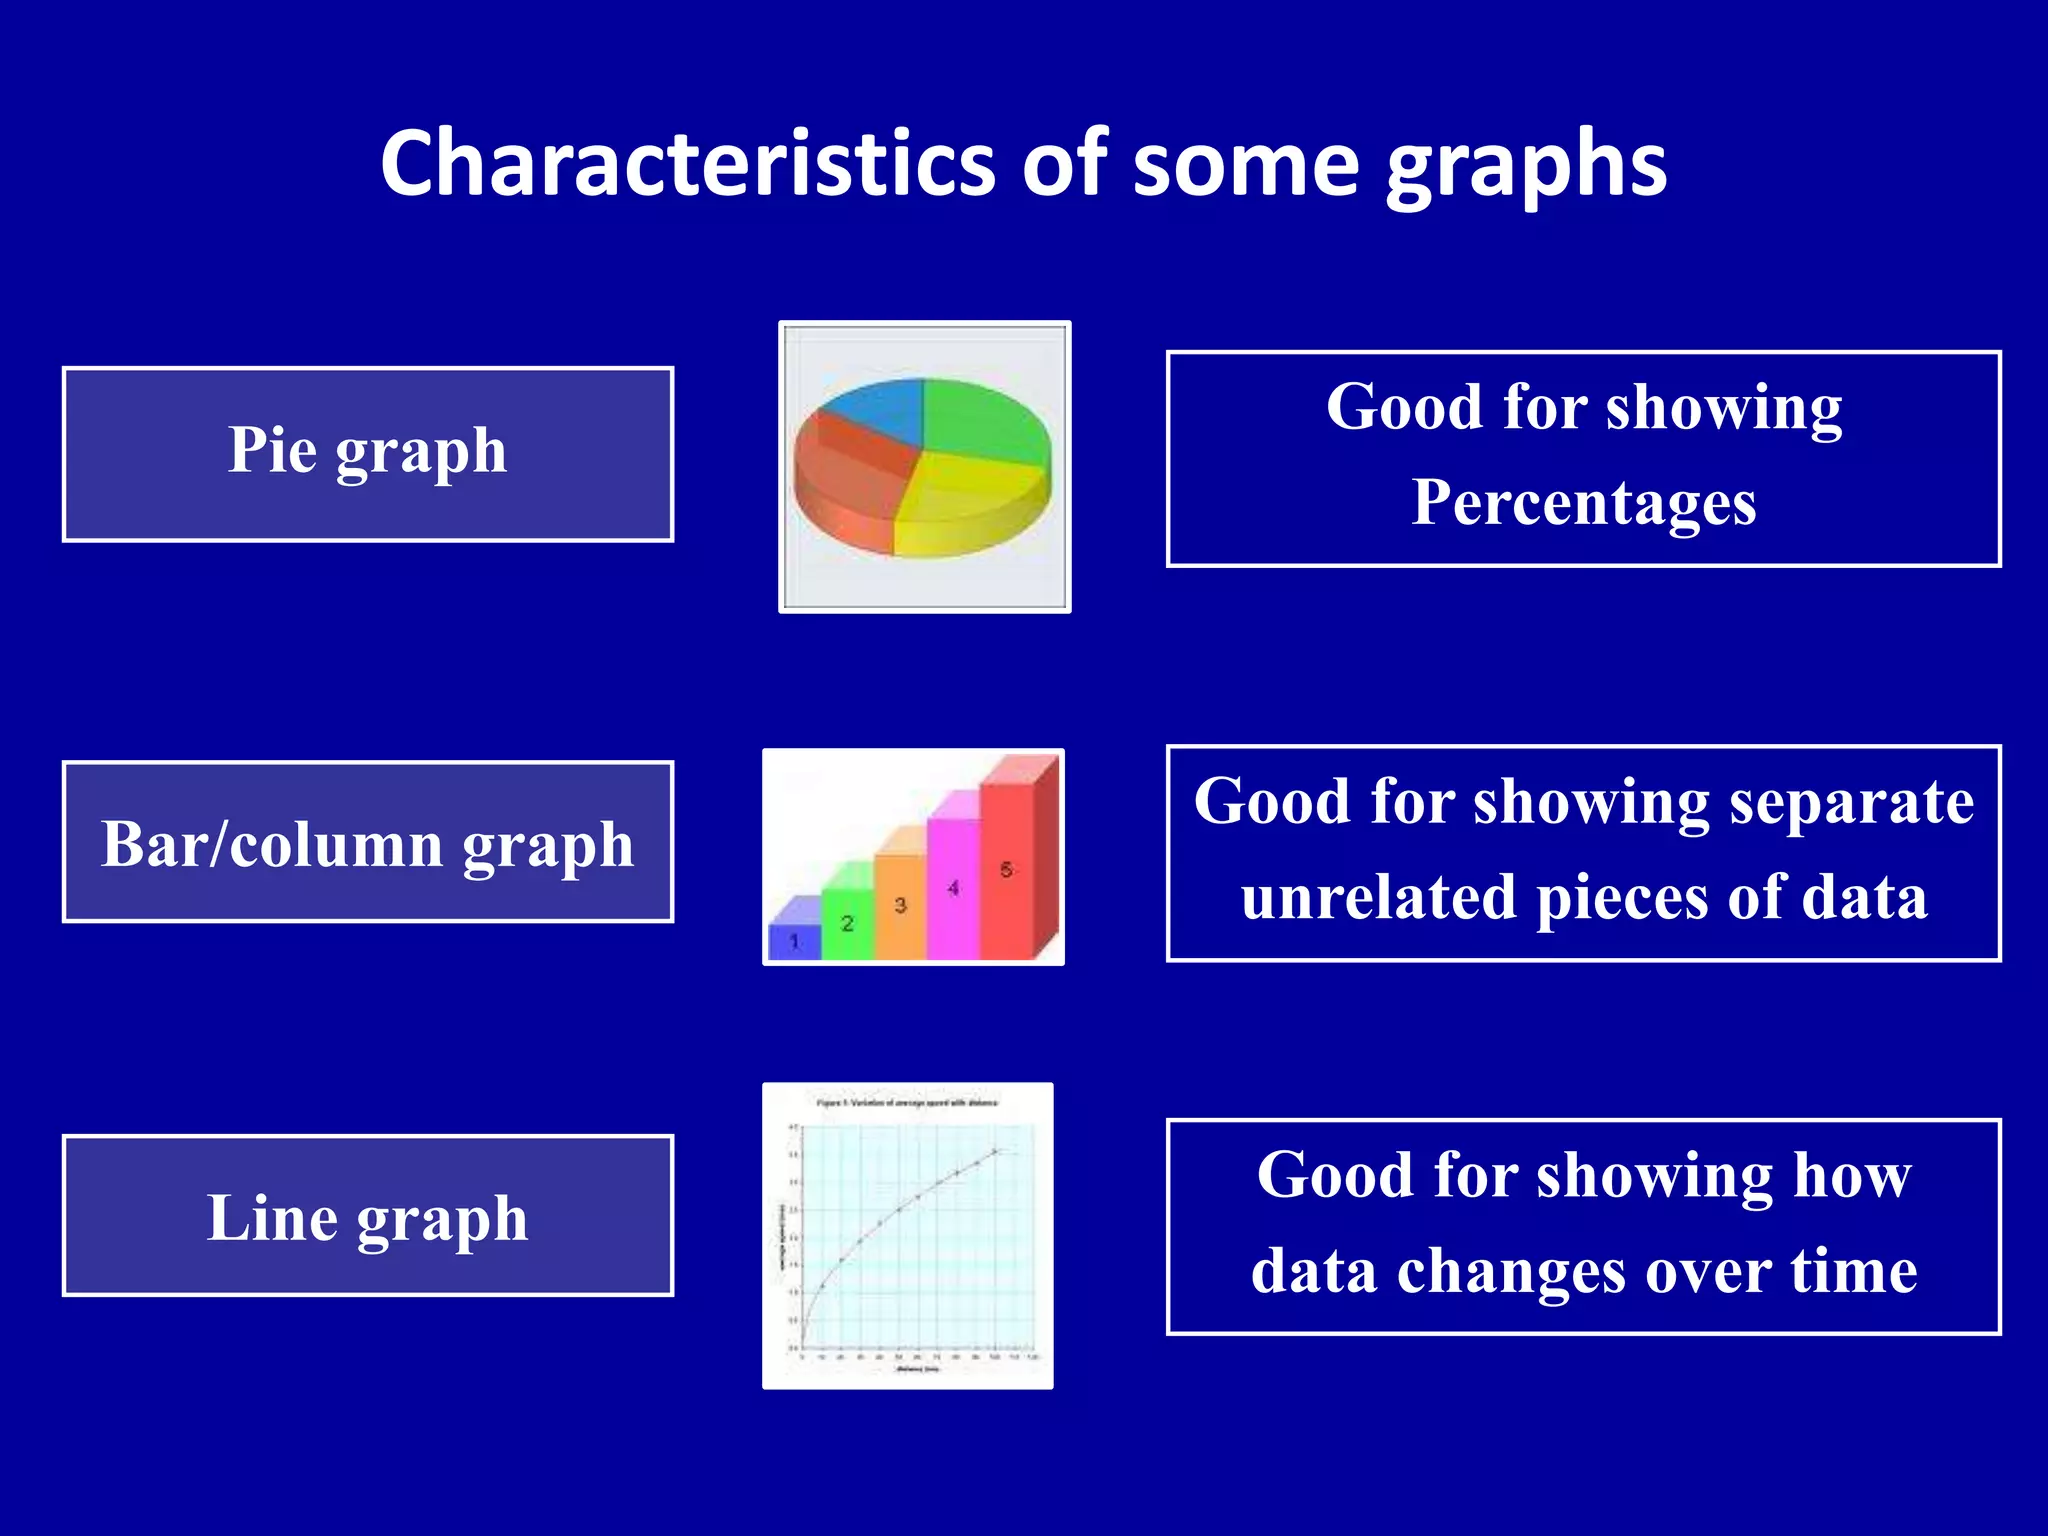
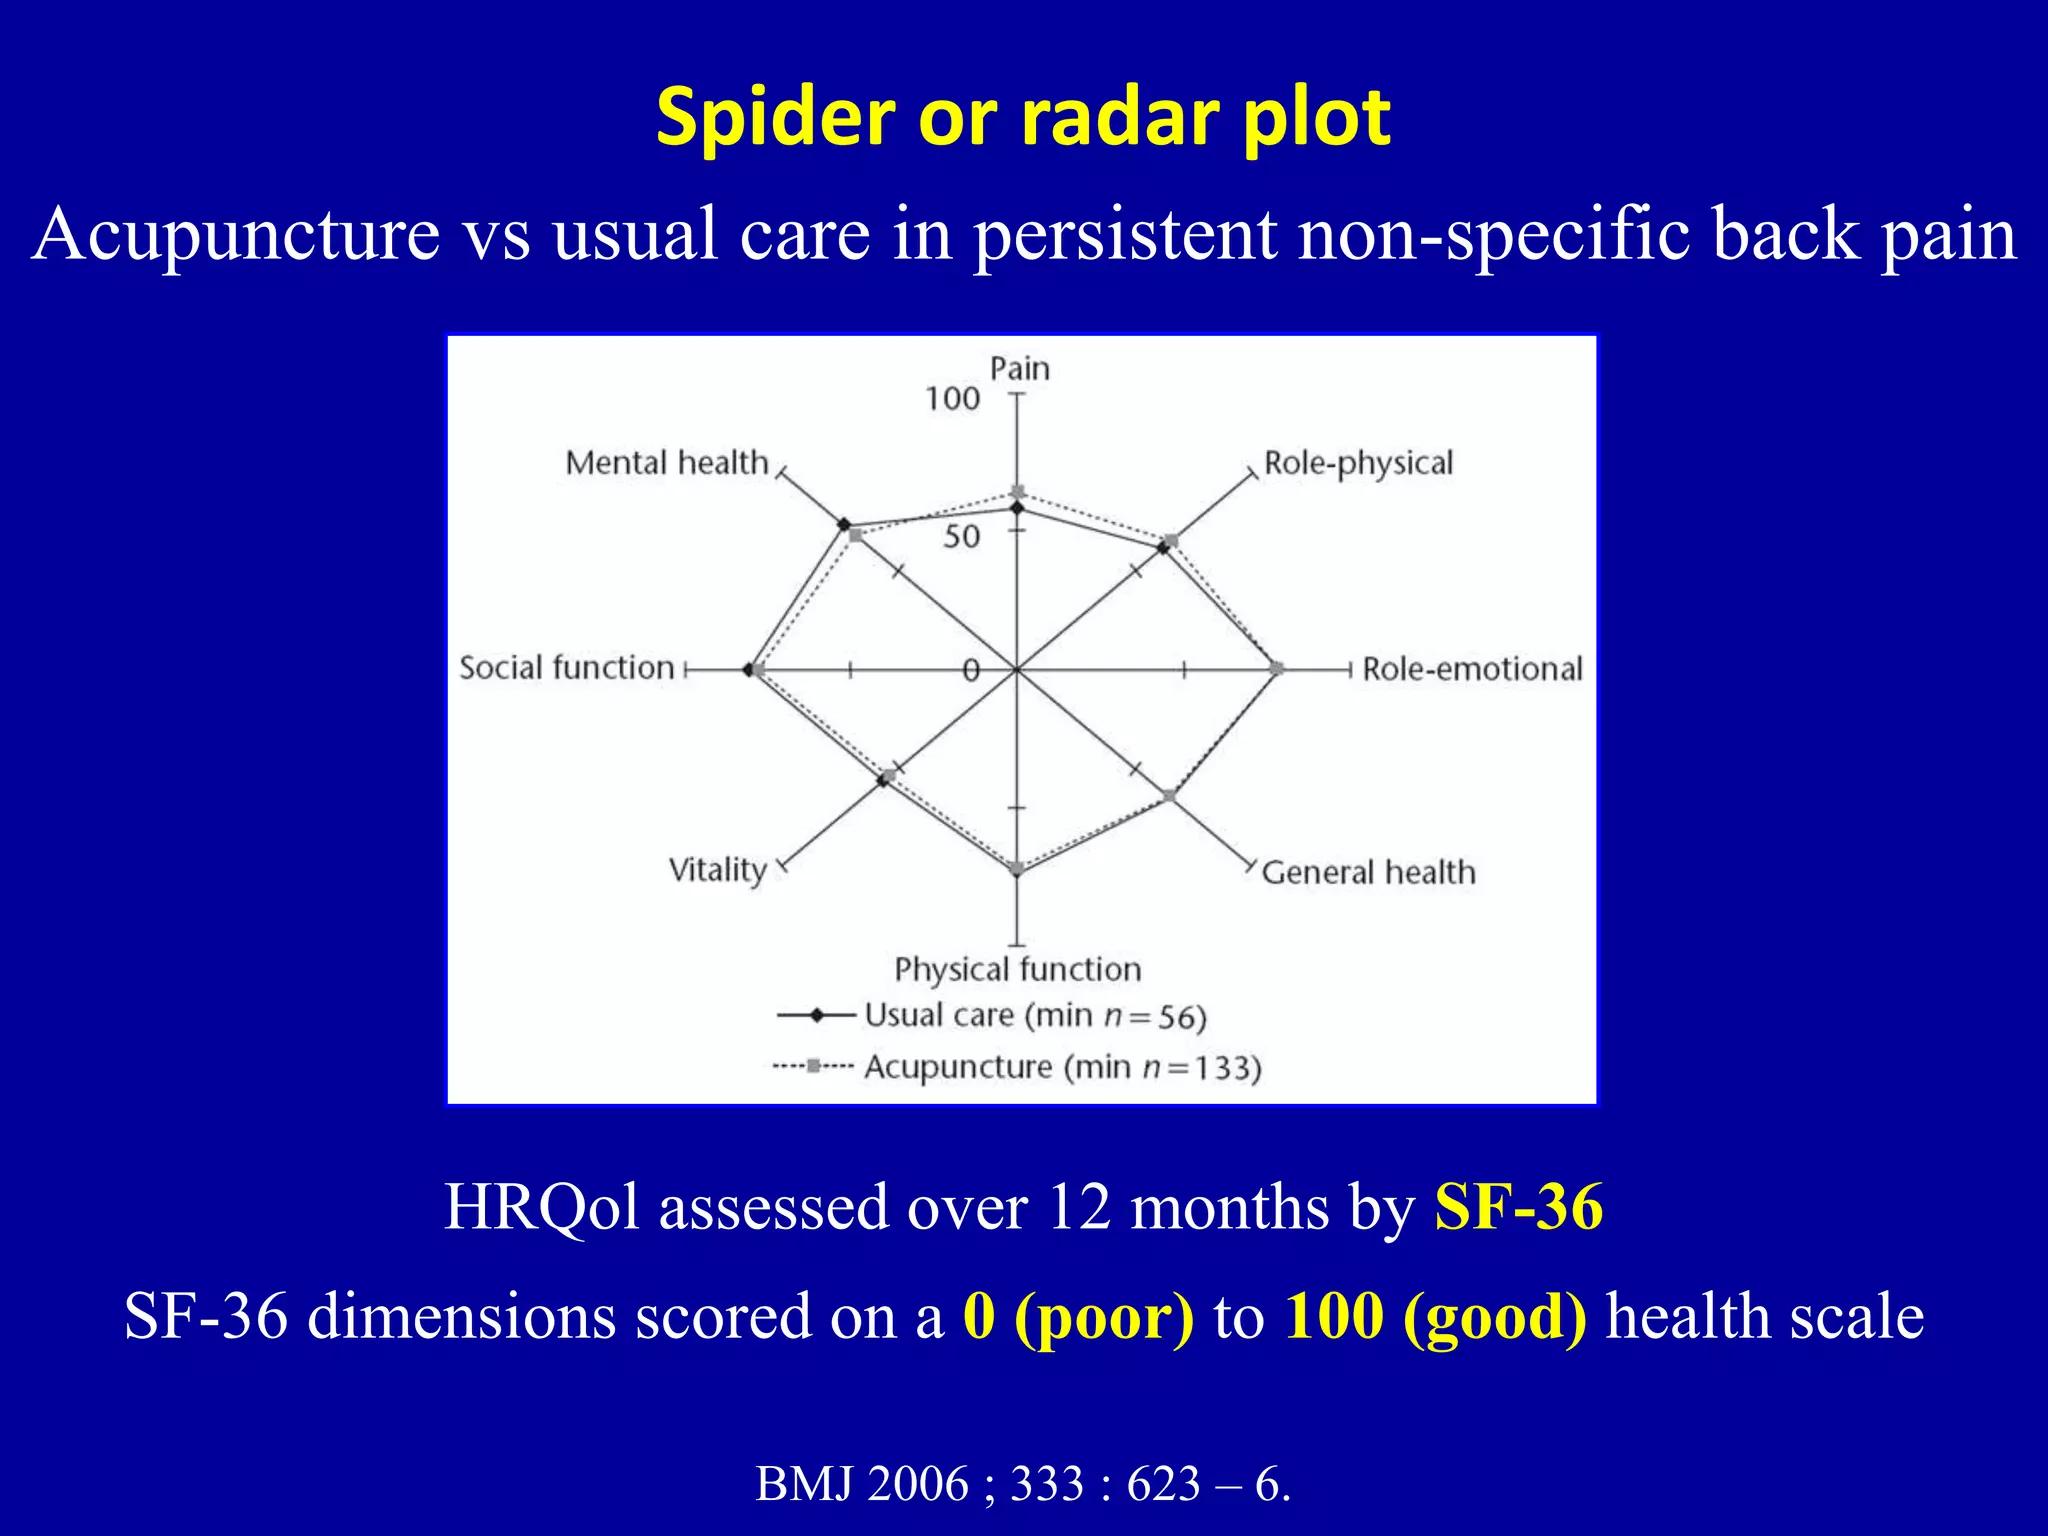
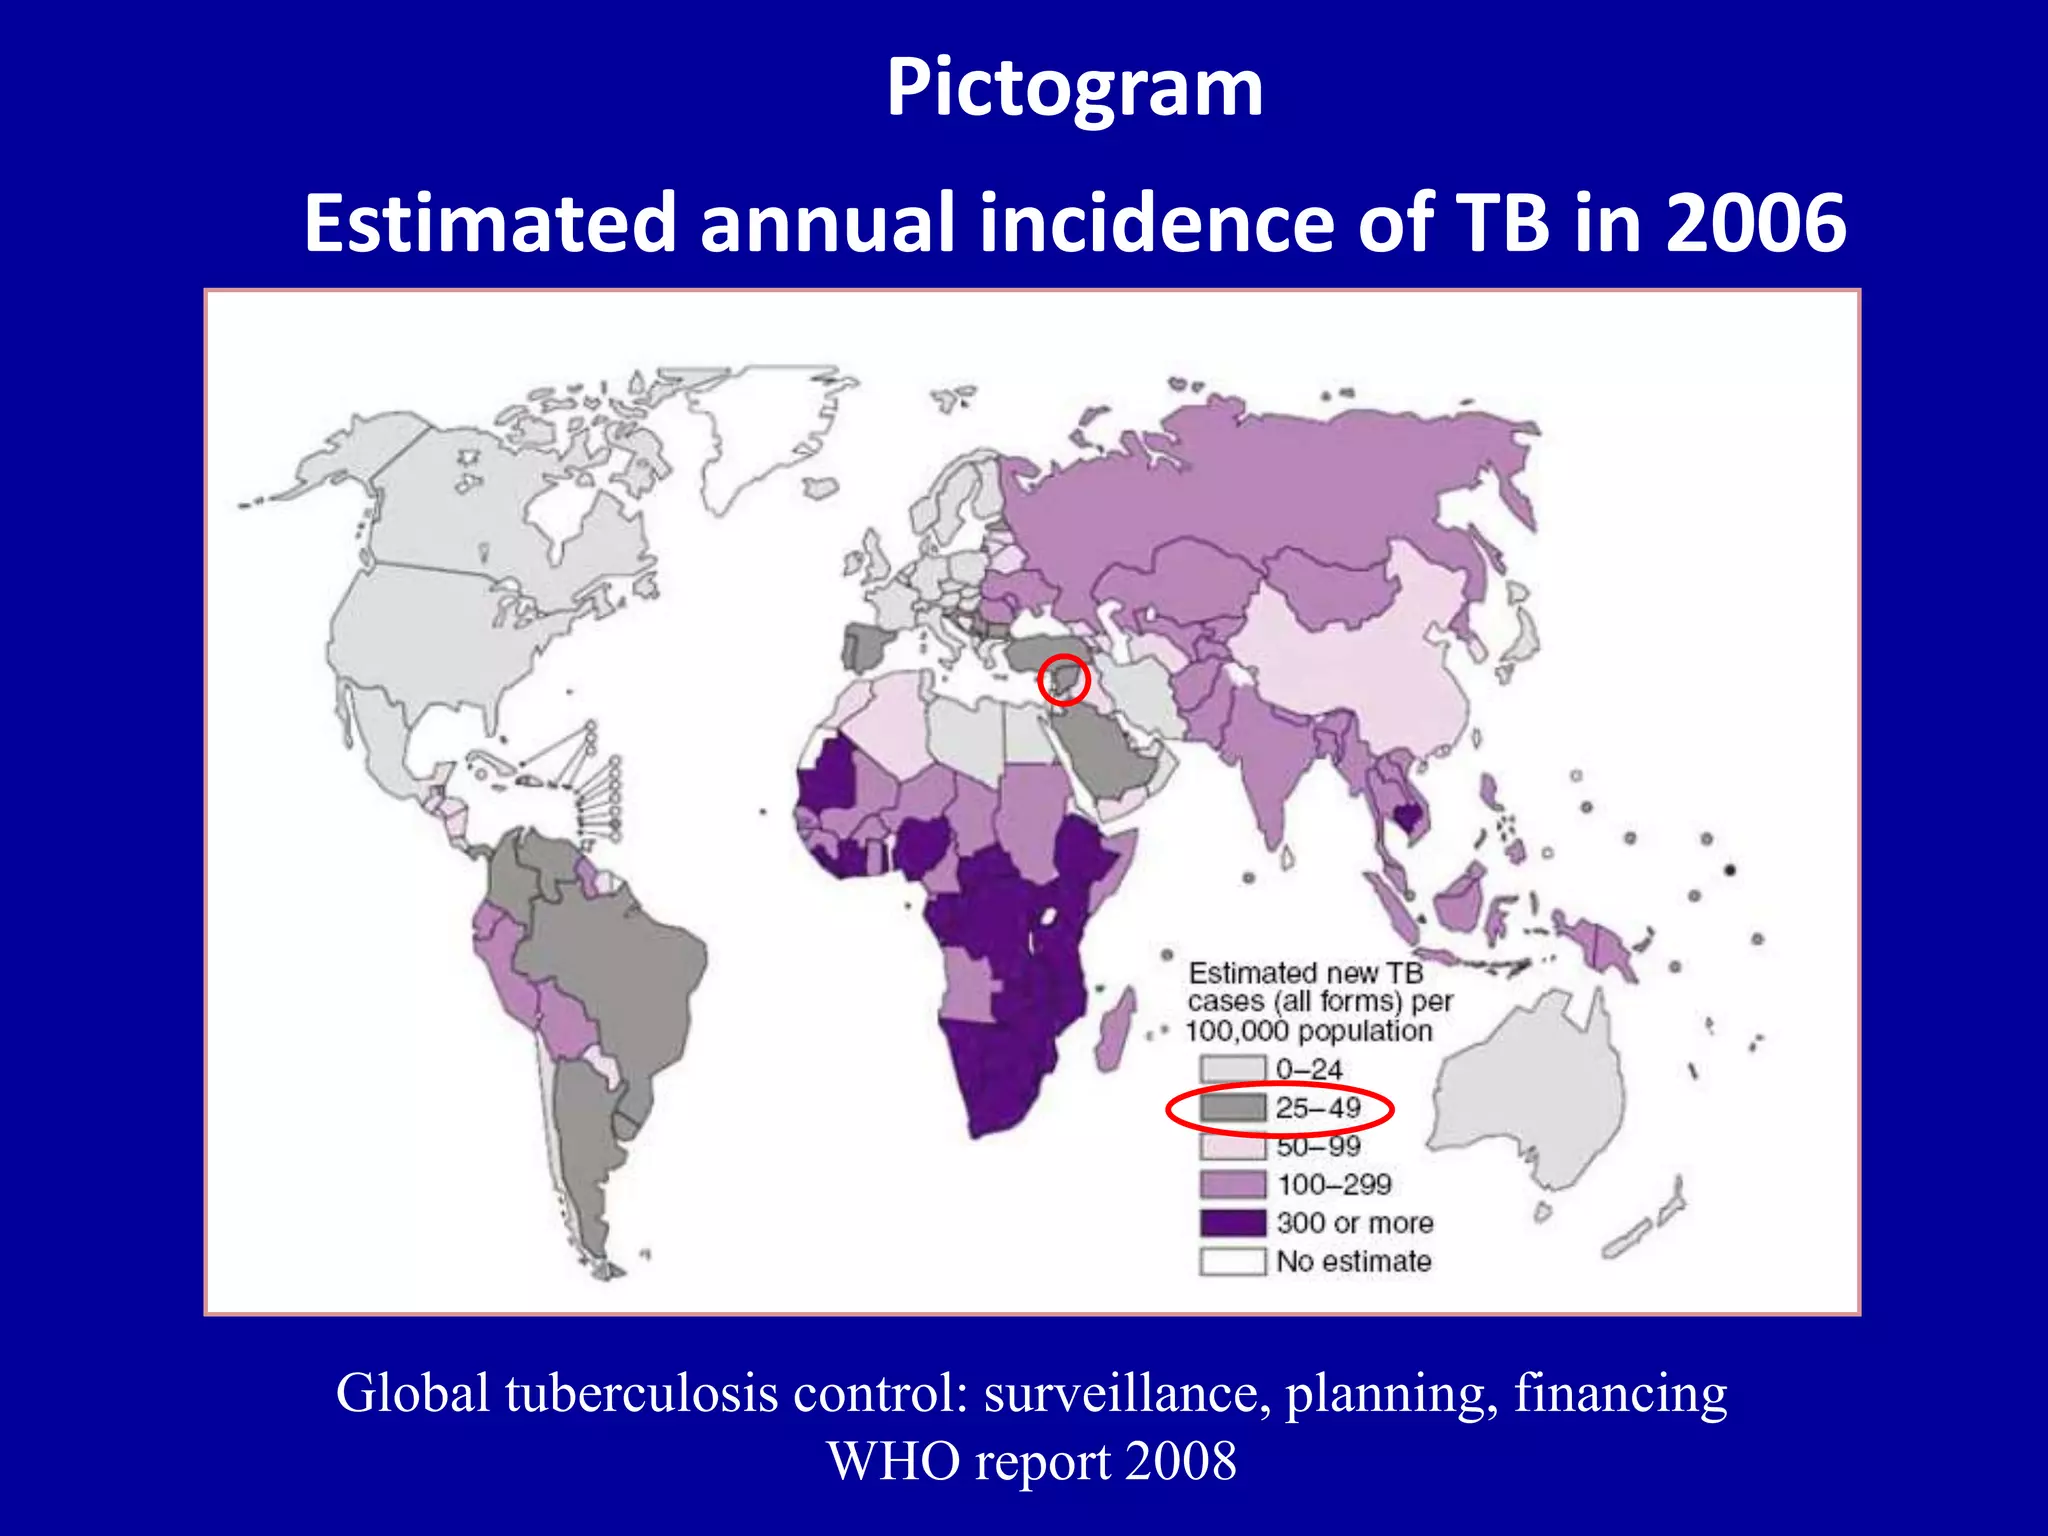
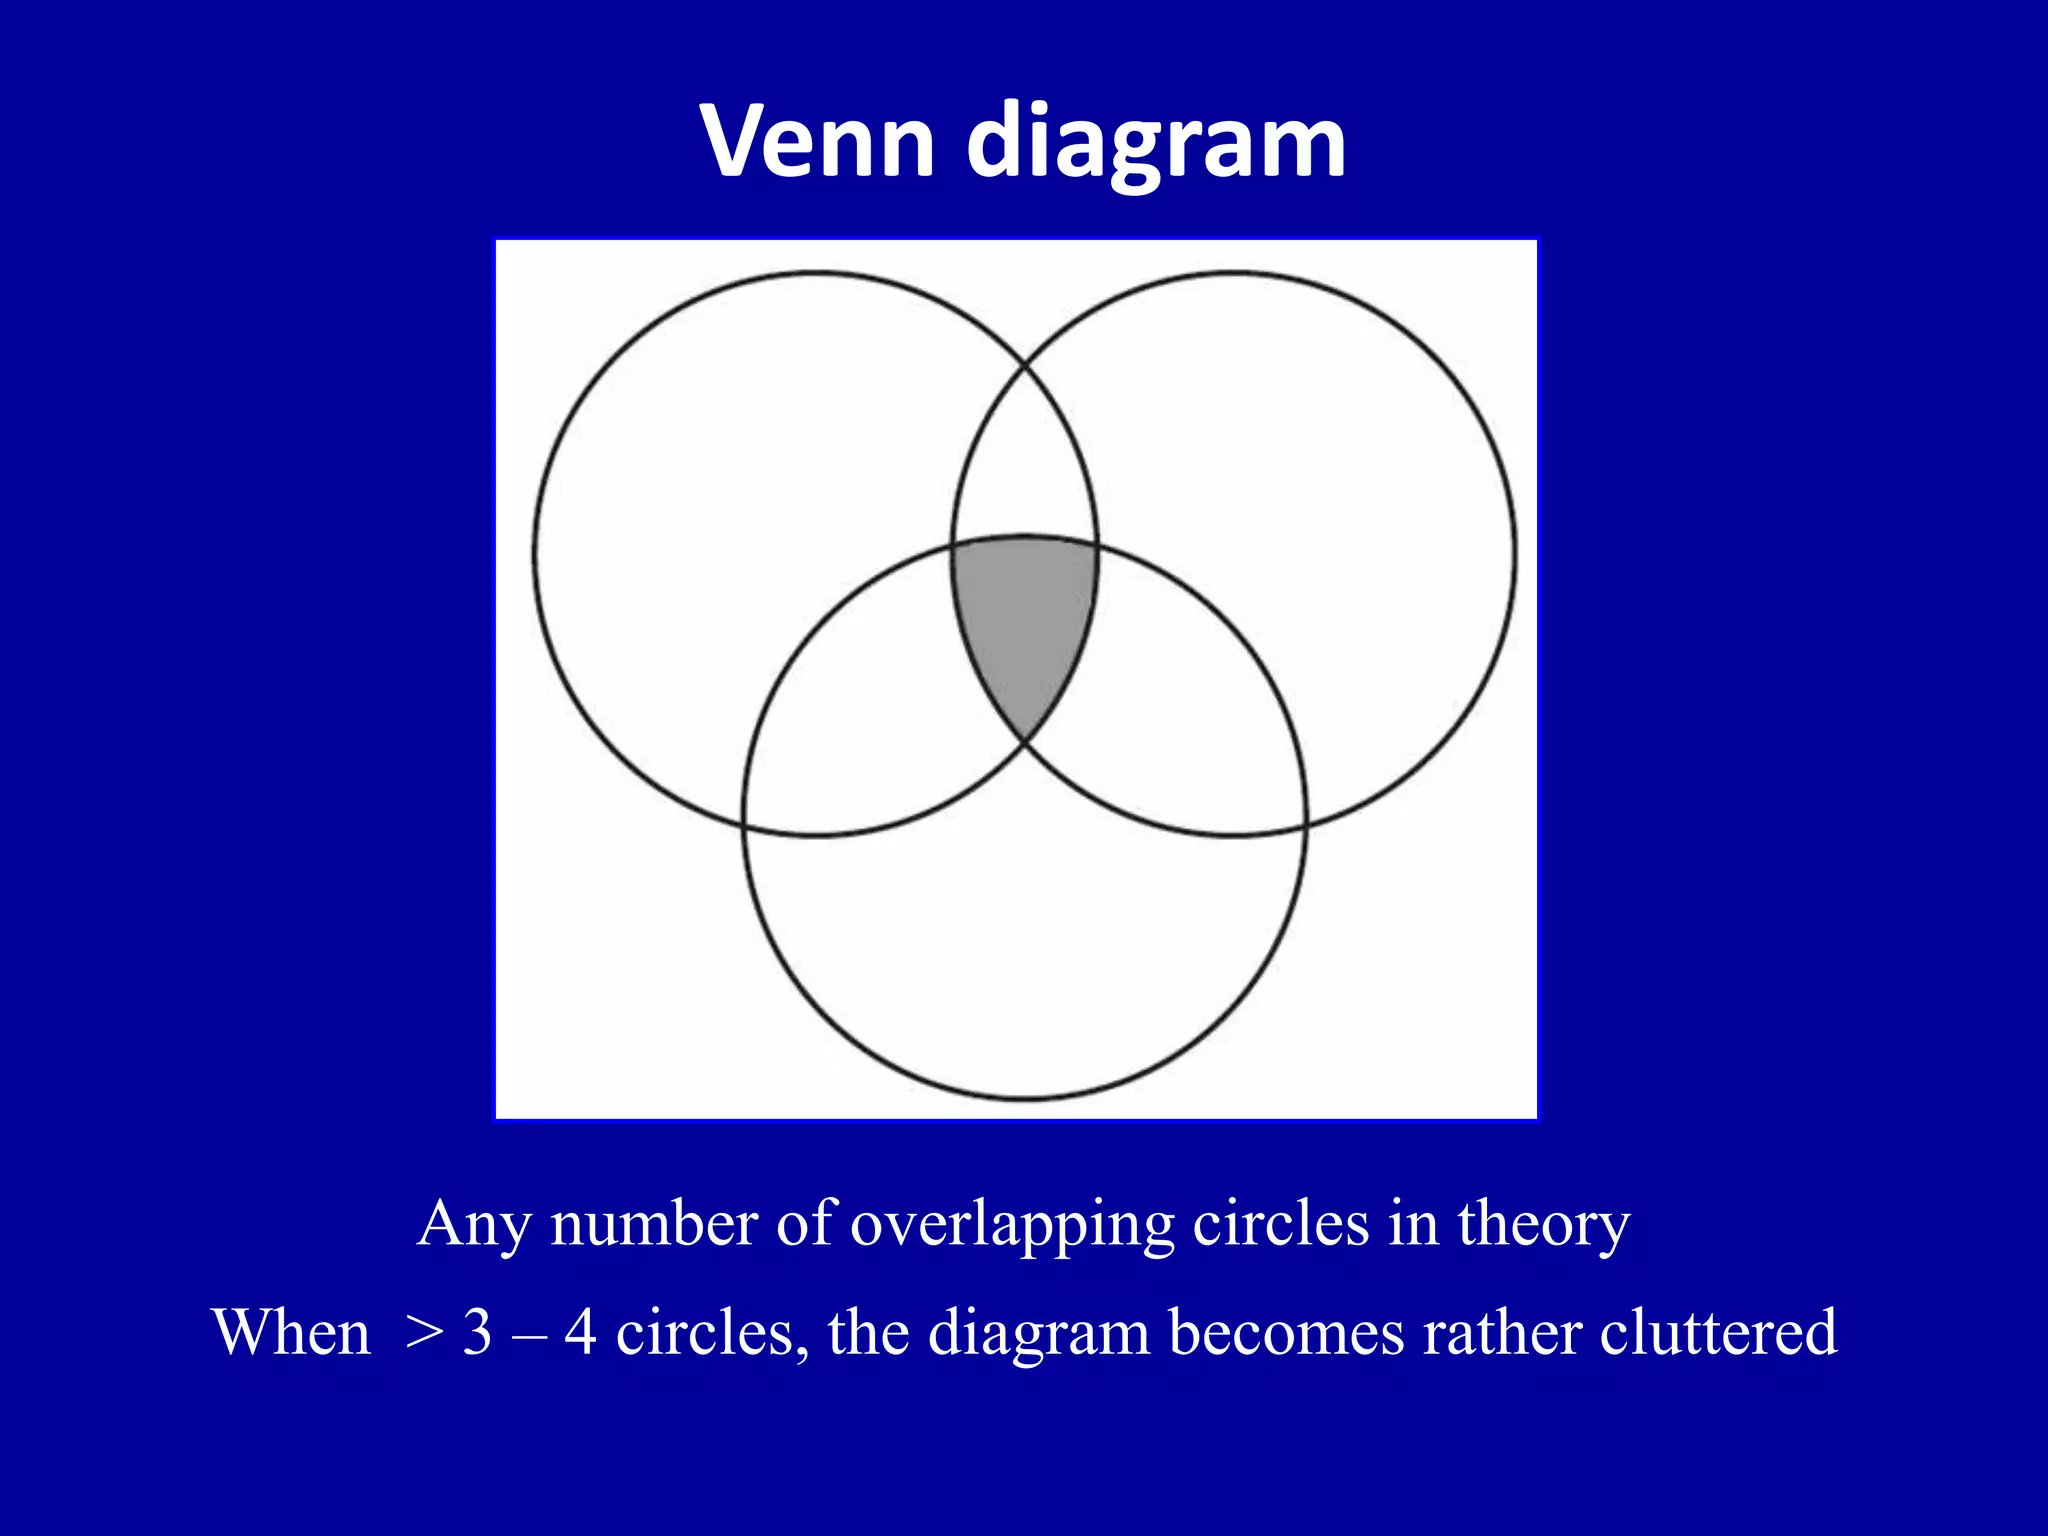
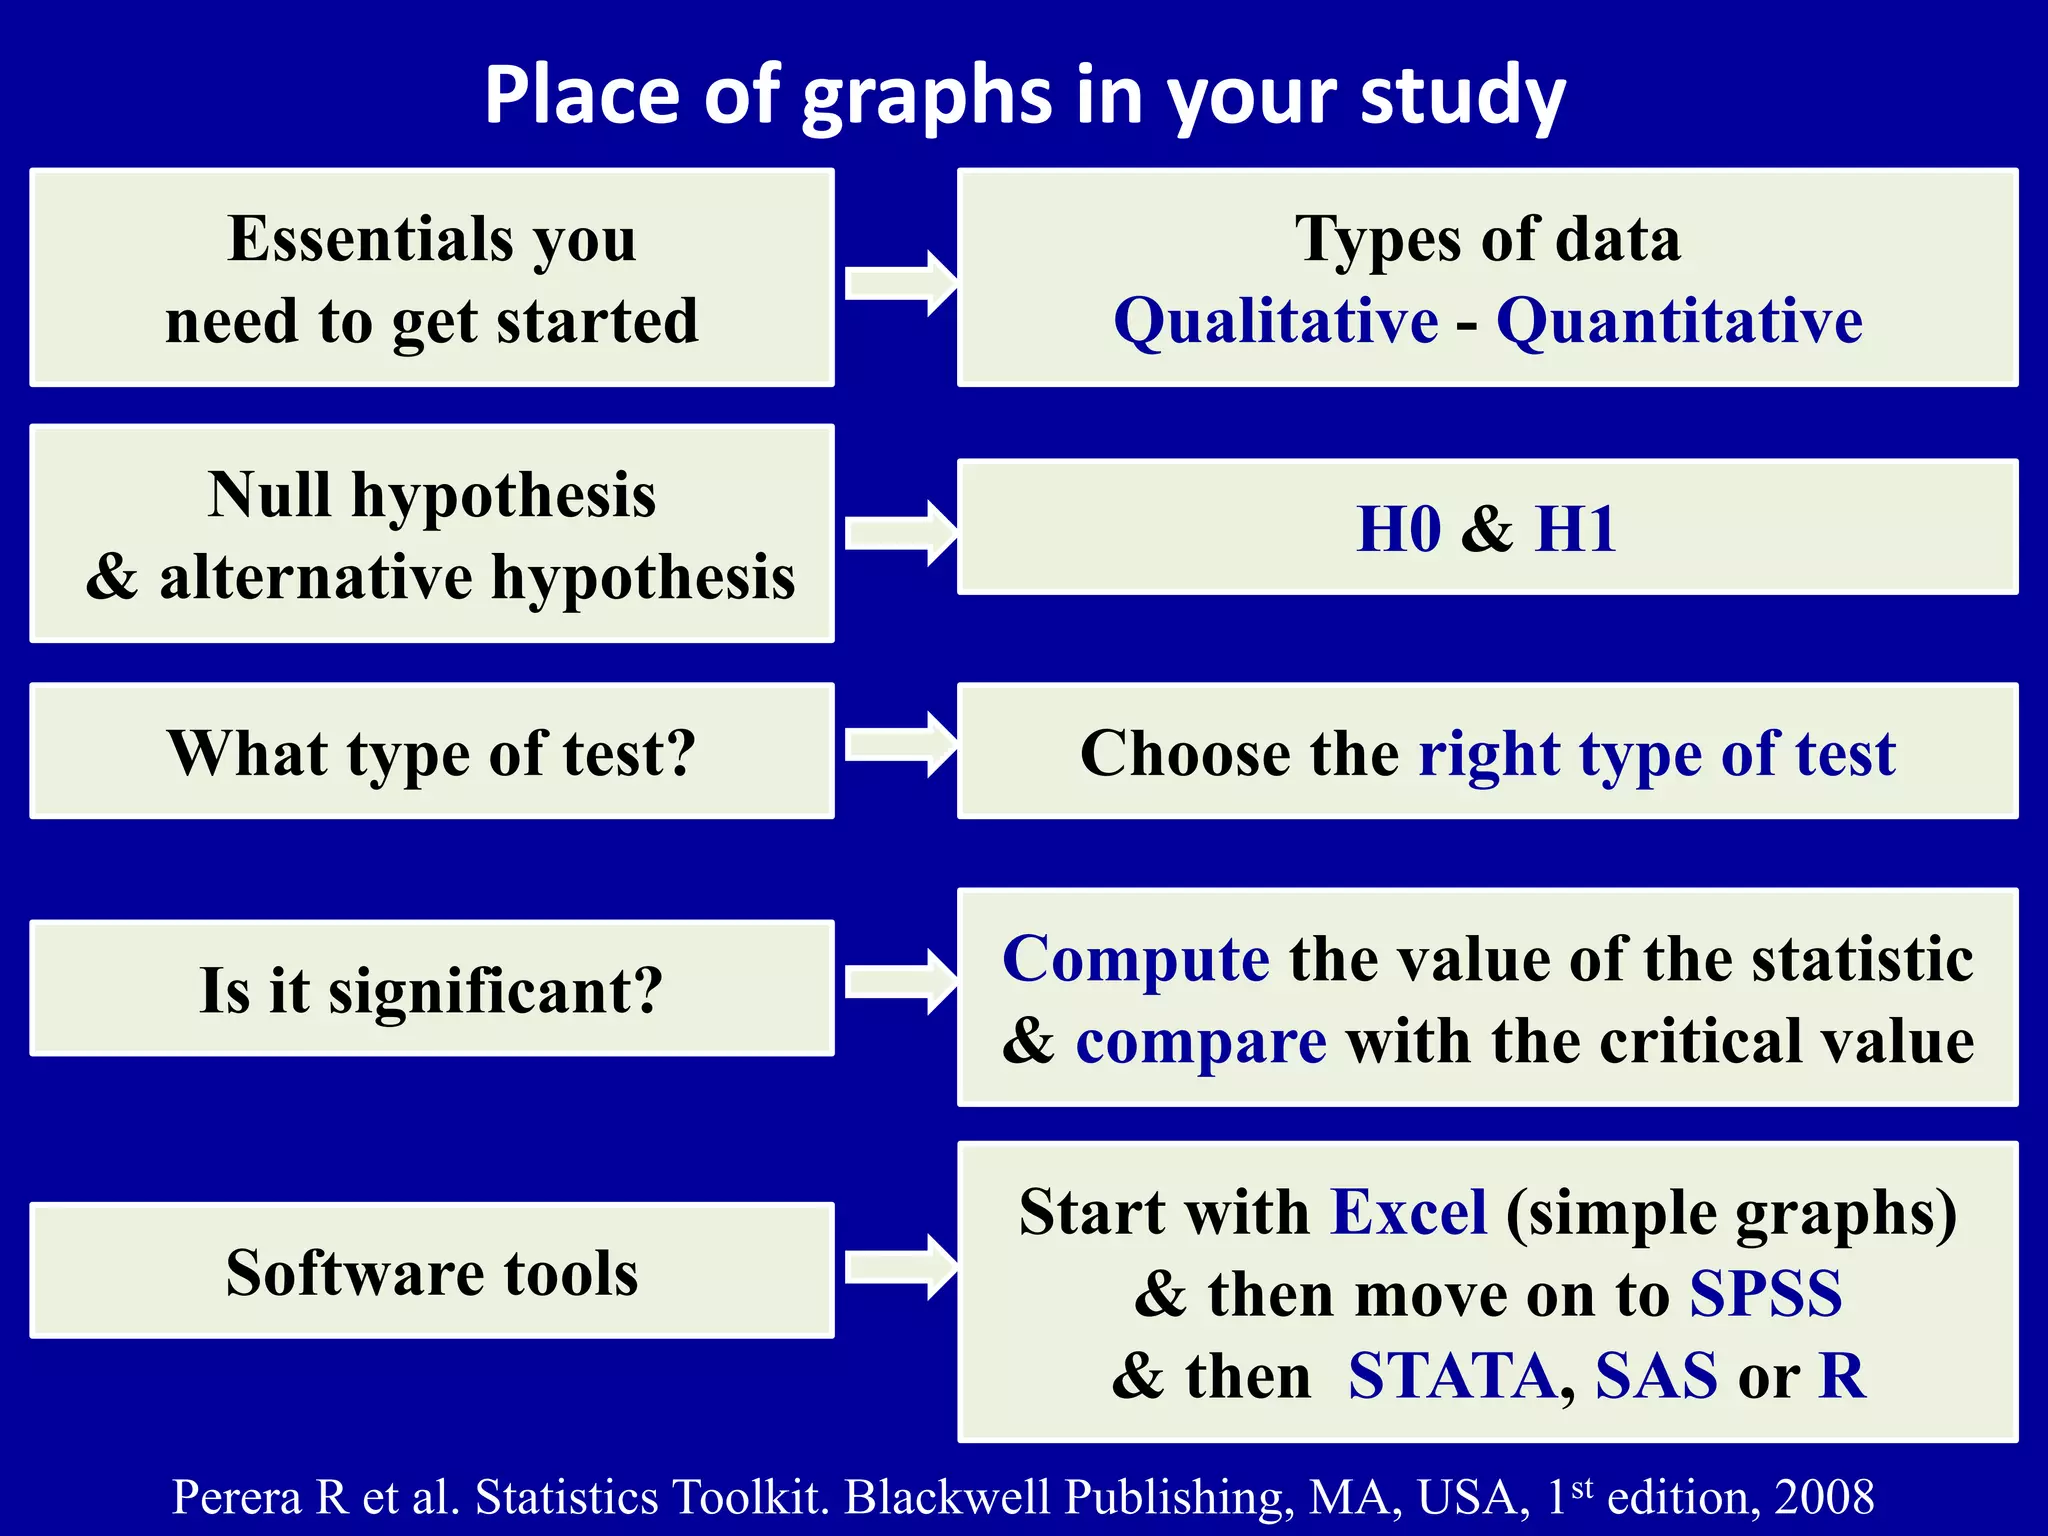
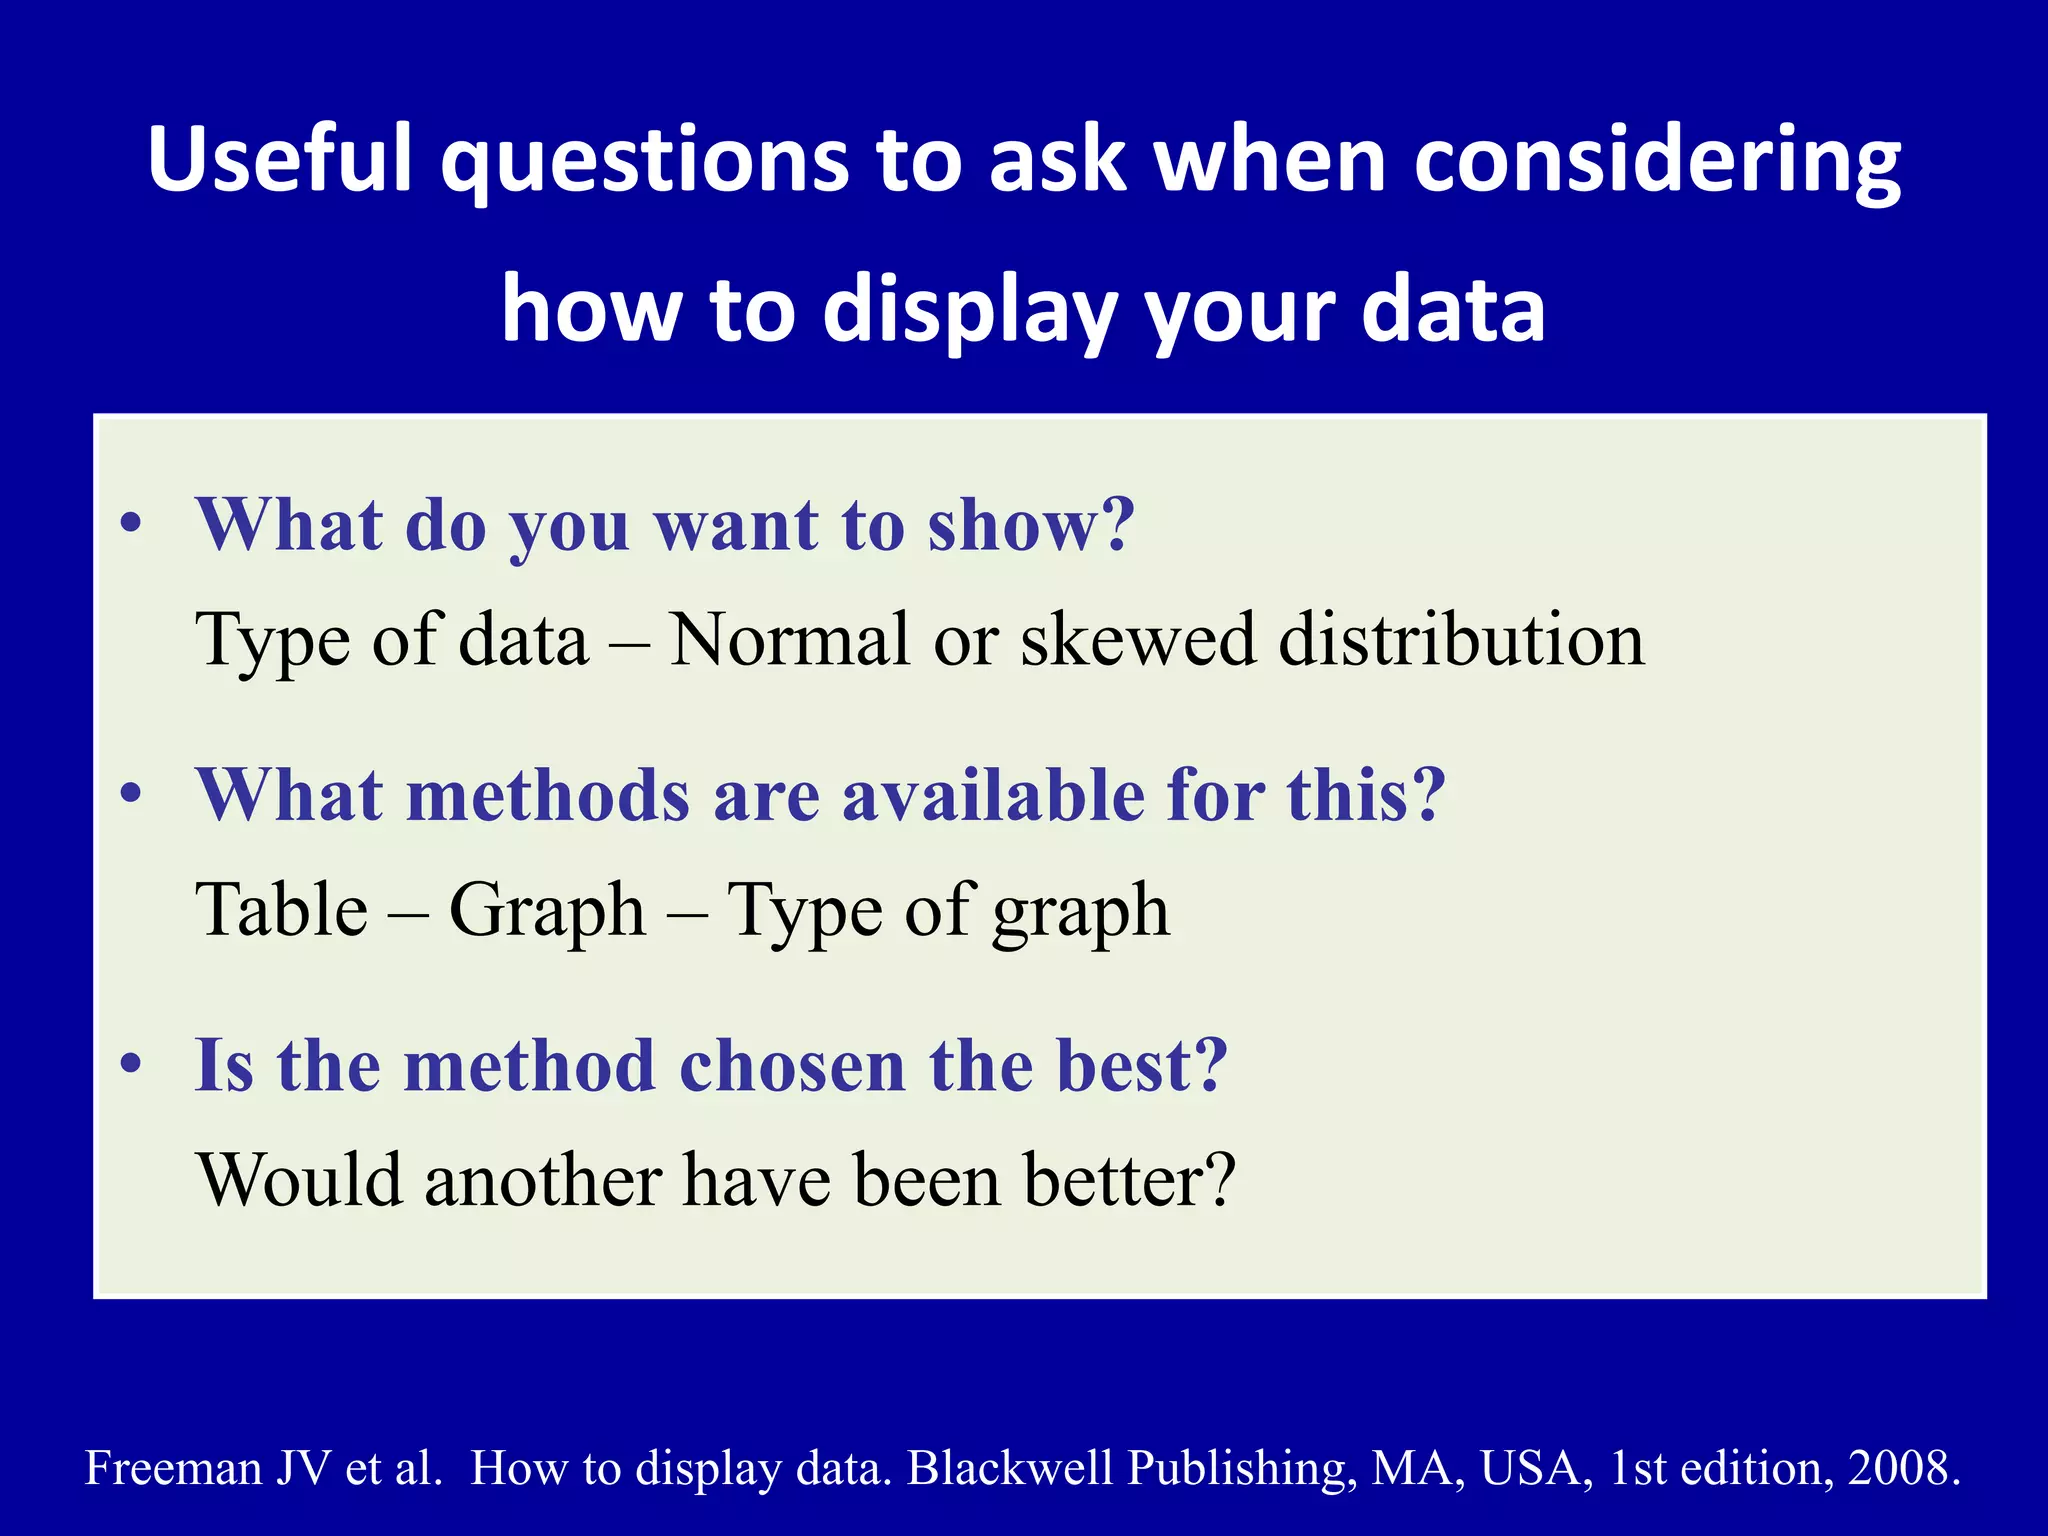
The document discusses the importance of visual data representation, emphasizing the use of graphs over tables for conveying trends more effectively in research. It categorizes various types of graphs, provides guidance on when to use them, and highlights best practices for creating effective visual displays. Additionally, it covers methodologies for displaying qualitative and quantitative data, including recommendations for software tools and construction principles for graphs.