Download free for 30 days
Sign in
Upload
Language (EN)
Support
Business
Mobile
Social Media
Marketing
Technology
Art & Photos
Career
Design
Education
Presentations & Public Speaking
Government & Nonprofit
Healthcare
Internet
Law
Leadership & Management
Automotive
Engineering
Software
Recruiting & HR
Retail
Sales
Services
Science
Small Business & Entrepreneurship
Food
Environment
Economy & Finance
Data & Analytics
Investor Relations
Sports
Spiritual
News & Politics
Travel
Self Improvement
Real Estate
Entertainment & Humor
Health & Medicine
Devices & Hardware
Lifestyle
Change Language
Language
English
Español
Português
Français
Deutsche
Cancel
Save
Submit search
EN
Uploaded by
ngolding1
26 views
TSYS Transfirst investor slide presentation
TSYS TRANS
Business
◦
Read more
0
Save
Share
Embed
Embed presentation
Download
Download to read offline
1
/ 44
2
/ 44
3
/ 44
4
/ 44
5
/ 44
6
/ 44
7
/ 44
8
/ 44
9
/ 44
10
/ 44
11
/ 44
12
/ 44
13
/ 44
14
/ 44
15
/ 44
16
/ 44
17
/ 44
18
/ 44
19
/ 44
20
/ 44
21
/ 44
22
/ 44
23
/ 44
24
/ 44
25
/ 44
26
/ 44
27
/ 44
28
/ 44
29
/ 44
30
/ 44
31
/ 44
32
/ 44
33
/ 44
34
/ 44
35
/ 44
36
/ 44
37
/ 44
38
/ 44
39
/ 44
40
/ 44
41
/ 44
42
/ 44
43
/ 44
44
/ 44
More Related Content
PDF
Trc q1-2015-earnings-slides-final v001-g61n61
by
trcsolutions
PDF
Trc q1 2015 earnings slides final
by
trcsolutions
PDF
Tcs 2 qfy2011-221010
by
Angel Broking
PDF
TCS-2019-2020 (1)-pages-175-183.pdf
by
SureshMaddi1
PPTX
TSYS World Wide Recognition
by
Shane Beardslee
PDF
Trc q2 2015 earnings slides final
by
trcsolutions
PDF
Q4 Earnings Slides 10 27 15
by
TEConnectivityltd
PDF
Tata consultancy services ltd converted
by
Nagarajchowdary2
Trc q1-2015-earnings-slides-final v001-g61n61
by
trcsolutions
Trc q1 2015 earnings slides final
by
trcsolutions
Tcs 2 qfy2011-221010
by
Angel Broking
TCS-2019-2020 (1)-pages-175-183.pdf
by
SureshMaddi1
TSYS World Wide Recognition
by
Shane Beardslee
Trc q2 2015 earnings slides final
by
trcsolutions
Q4 Earnings Slides 10 27 15
by
TEConnectivityltd
Tata consultancy services ltd converted
by
Nagarajchowdary2
Similar to TSYS Transfirst investor slide presentation
PDF
TDS Q4 2015 Earnings Presentation
by
USCellular
PDF
TDS Q4 2015 Earnings Presentation
by
TelephoneDataSystems
PDF
Q1 2015 TE Connectivity Ltd. Earnings Conference Call
by
TEConnectivityltd
PDF
Q1 2015 TE Connectivity Ltd. Earnings Conference Call
by
TEConnectivityltd
PPTX
TE Connectivity Q1 2015 Presentation
by
TEConnectivityltd
PDF
Trc q4 2015 earnings slides final
by
trcsolutions
PDF
Telecom Italia 1H 2010 Results
by
Gruppo TIM
PDF
TCS_Investor_Relations_Presentation_2Q21.pdf
by
UtkarshaRautPc
PDF
Sampark q1 2016
by
Nilesh Kanakraj
PPTX
Vendor assessment
by
Milind Kinker
PDF
TCS Fact Sheet Q1 FY15
by
Tata Consultancy Services
DOCX
Nonlinear Revenues – Key future growth driver for Tata Consultancy Services
by
Rajesh Prabhakar
PDF
Trc q4 2014 earnings slides final
by
trcsolutions
PDF
Q2 2014 Ryder System Inc Earnings Presentation
by
Ryder System, Inc.
TDS Q4 2015 Earnings Presentation
by
USCellular
TDS Q4 2015 Earnings Presentation
by
TelephoneDataSystems
Q1 2015 TE Connectivity Ltd. Earnings Conference Call
by
TEConnectivityltd
Q1 2015 TE Connectivity Ltd. Earnings Conference Call
by
TEConnectivityltd
TE Connectivity Q1 2015 Presentation
by
TEConnectivityltd
Trc q4 2015 earnings slides final
by
trcsolutions
Telecom Italia 1H 2010 Results
by
Gruppo TIM
TCS_Investor_Relations_Presentation_2Q21.pdf
by
UtkarshaRautPc
Sampark q1 2016
by
Nilesh Kanakraj
Vendor assessment
by
Milind Kinker
TCS Fact Sheet Q1 FY15
by
Tata Consultancy Services
Nonlinear Revenues – Key future growth driver for Tata Consultancy Services
by
Rajesh Prabhakar
Trc q4 2014 earnings slides final
by
trcsolutions
Q2 2014 Ryder System Inc Earnings Presentation
by
Ryder System, Inc.
Recently uploaded
PPTX
Crisis-Management-Plan-Apple-final case study.pptx
by
Budi Septiawan
PDF
5 sites To Buy Instagram Accounts Safely_ 2025 Guide..pdf
by
sy33nn1pvm0ykdle9x4r
PDF
Shipping Company in Bangalore - Easyway 2025Logistics_.pdf
by
Easyway Logistics
PDF
Capital One Bank – Best Selling Online Banking PHP Script.pdf
by
4b6fi2jol3skajahxend
PDF
MCB-Code-of-Conduct Mansehra postal service operation management
by
tanolihaseeb21
PDF
Pension Schemes Bill.pdf Have you forgotten me
by
Henry Tapper
PDF
Dimi Design Intelligence Addendum, All Parts.pdf
by
Brij Consulting, LLC
DOCX
The Ultimate Guide to Bulk Purchasing Old Gmail Accounts.docx
by
Buy Verified Cash App Accounts
PDF
David Slone Denver - President Of Lead 2 Serve
by
David Slone Denver
PDF
The Best Marketplaces to Buy and Sell Snapchat Accounts ....pdf
by
sy33nn1pvm0ykdle9x4r
DOCX
How to buy Yahoo accounts and Outlook accounts in 2026..docx
by
getsmmpro getsmmpro
PDF
Tips for Successfully Buying Old Gmail Accounts in Bulk.pdf
by
Buy Verified Cash App Accounts
PDF
Encyclopedia of Cyber Warfare by Paul J. Springer (z-lib.org).pdf
by
olongapopnp
DOCX
7 Best Place To Buy Verified PayPal Accounts in USA.docx
by
getsmmpro getsmmpro.com
PDF
How to open a checking and savings bank account with ....pdf
by
4b6fi2jol3skajahxend
PDF
10k to 5k followers Twitter Accounts for Sale.pdf
by
2oe47406ufcwa3h5xe3s
PDF
How to Monetize Websites With Recurring Income Systems
by
RandyOtterbridge1
DOCX
How to Get a Verified Wise Account_ A Complete Buying 2026.docx
by
Digital marketimg USA
PDF
Buy Google Ads Accounts_ A Conservative Guide for Everyday.pdf
by
USAALLHUB Digital Marketer in 2026
PDF
How to Buy LinkedIn Followers and Connections.pdf
by
sy33nn1pvm0ykdle9x4r
Crisis-Management-Plan-Apple-final case study.pptx
by
Budi Septiawan
5 sites To Buy Instagram Accounts Safely_ 2025 Guide..pdf
by
sy33nn1pvm0ykdle9x4r
Shipping Company in Bangalore - Easyway 2025Logistics_.pdf
by
Easyway Logistics
Capital One Bank – Best Selling Online Banking PHP Script.pdf
by
4b6fi2jol3skajahxend
MCB-Code-of-Conduct Mansehra postal service operation management
by
tanolihaseeb21
Pension Schemes Bill.pdf Have you forgotten me
by
Henry Tapper
Dimi Design Intelligence Addendum, All Parts.pdf
by
Brij Consulting, LLC
The Ultimate Guide to Bulk Purchasing Old Gmail Accounts.docx
by
Buy Verified Cash App Accounts
David Slone Denver - President Of Lead 2 Serve
by
David Slone Denver
The Best Marketplaces to Buy and Sell Snapchat Accounts ....pdf
by
sy33nn1pvm0ykdle9x4r
How to buy Yahoo accounts and Outlook accounts in 2026..docx
by
getsmmpro getsmmpro
Tips for Successfully Buying Old Gmail Accounts in Bulk.pdf
by
Buy Verified Cash App Accounts
Encyclopedia of Cyber Warfare by Paul J. Springer (z-lib.org).pdf
by
olongapopnp
7 Best Place To Buy Verified PayPal Accounts in USA.docx
by
getsmmpro getsmmpro.com
How to open a checking and savings bank account with ....pdf
by
4b6fi2jol3skajahxend
10k to 5k followers Twitter Accounts for Sale.pdf
by
2oe47406ufcwa3h5xe3s
How to Monetize Websites With Recurring Income Systems
by
RandyOtterbridge1
How to Get a Verified Wise Account_ A Complete Buying 2026.docx
by
Digital marketimg USA
Buy Google Ads Accounts_ A Conservative Guide for Everyday.pdf
by
USAALLHUB Digital Marketer in 2026
How to Buy LinkedIn Followers and Connections.pdf
by
sy33nn1pvm0ykdle9x4r
TSYS Transfirst investor slide presentation
1.
2015 Fourth Quarter
and Full Year Results Acquisition of TransFirst January 26, 2016 © 2016 Total System Services, Inc.® All rights reserved worldwide.
2.
© 2016 Total
System Services, Inc.® All rights reserved worldwide. > CAUTIONARY NOTE REGARDING FORWARD-LOOKING STATEMENTS This presentation contains statements that constitute "forward-looking statements" within the meaning of the federal securities laws. These forward-looking statements include, among others, statements about TSYS’ expected future operating results, the benefits of the proposed acquisition of TransFirst (including the expected impact of the acquisition on TSYS' revenue and earnings), the expected growth rate of the merchant acquiring market, and the expected timing for closing the acquisition. These statements are based on the current beliefs and expectations of TSYS' and TransFirst's management, as applicable, and are subject to known and unknown risks and uncertainties. We believe these forward-looking statements are reasonable; however, undue reliance should not be placed on any forward-looking statements, which are based on current expectations. Actual results may differ materially from those contemplated by these forward-looking statements. A number of important factors could cause actual results to differ materially from those contemplated by the forward-looking statements, including our ability to achieve expected synergies and successfully complete the integration of TransFirst, events that could give rise to a termination of the stock purchase agreement for the acquisition or to the failure to receive any necessary approvals or financing for the acquisition, the outcome of any litigation related to the acquisition, the level of expenses and other charges related to the acquisition and related financing transactions, and the other risks and uncertainties discussed in TSYS’ filings with the SEC, including its 2014 Annual Report on Form 10-K. There can be no assurance that the acquisition will be completed, or if it is completed, that it will be completed within the anticipated time period or that the expected benefits of the acquisition will be realized. We do not assume any obligation to update any forward-looking statements as a result of new information, future developments or otherwise. 2
3.
© 2016 Total
System Services, Inc.® All rights reserved worldwide. > NON-GAAP FINANCIAL MEASURES Throughout this presentation, we reference certain non-GAAP financial measures, including revenues before reimbursable items, operating margin excluding reimbursable items, revenues measured on a constant currency basis, free cash flow, EBITDA, adjusted EBITDA, adjusted earnings per share, adjusted segment operating income and adjusted segment operating margin. Management uses these non-GAAP financial measures to assess the performance of TSYS’ core business. TSYS believes that these non-GAAP financial measures provide meaningful additional information about TSYS to assist investors in evaluating TSYS’ operating results. These non-GAAP financial measures should not be considered as a substitute for operating results determined in accordance with GAAP and may not be comparable to other similarly titled measures of other companies. Please refer to the Appendix to this presentation for a discussion of these non-GAAP financial measures as well as a reconciliation of those measures to the most directly comparable financial measure presented in accordance with U.S. GAAP. This presentation also references certain combined financial measures which do not reflect any adjustments resulting from the proposed transaction and do not represent a “pro forma” amount determined in accordance with the SEC’s rules and regulations, including Article 11 of Regulation S-X. 3
4.
> AGENDA 4 © 2016
Total System Services, Inc.® All rights reserved worldwide. ➔ Introduction - M. Troy Woods, Chief Executive Officer, TSYS ➔ 2015 Fourth Quarter and Full Year Results; 2016 Guidance - Paul Todd, Chief Financial Officer, TSYS ➔ Transaction Overview and Strategic Rationale - M. Troy Woods, Chief Executive Officer, TSYS ➔ TransFirst Overview - John Shlonsky, President and Chief Executive Officer, TransFirst ➔ Financial Considerations - Paul Todd, Chief Financial Officer, TSYS
5.
Introduction M. Troy Woods Chief
Executive Officer, TSYS 5 © 2016 Total System Services, Inc.® All rights reserved worldwide.
6.
2015 Fourth Quarter
and Full Year Results; 2016 Guidance Paul Todd Chief Financial Officer, TSYS 6 © 2016 Total System Services, Inc.® All rights reserved worldwide.
7.
2015 Fourth Quarter
and Full Year Results © 2016 Total System Services, Inc.® All rights reserved worldwide. 7 (*) Adjusted EBITDA , Adjusted EBITDA margin and Adjusted EPS definitions are contained in Appendix > CONSOLIDATED SELECTED FINANCIAL HIGHLIGHTS $716,843 $635,104 12.9% Total Revenues $2,779,541 $2,446,877 13.6% 645,095 569,301 13.3 Revenues Before Reimbursable Items 2,499,349 2,192,978 14.0 195,031 193,738 0.7 Adjusted EBITDA* 833,920 712,267 17.1 $0.57 $0.58 (1.6) Adjusted EPS* from Continuing Operations $2.46 $1.96 25.5 (in thousands, except per share data) 4rth Qtr 2015 4th Qtr 2014 Percent Change YTD 2015 YTD 2014 Percent Change
8.
2015 Fourth Quarter
and Full Year Results © 2016 Total System Services, Inc.® All rights reserved worldwide. 8 ➔ Double digit revenue growth ➔ Strong cross segment delivery of performance ➔ Record volume gains 46% 13% 19% 22% Revenue by Segment* North America International Merchant NetSpend $113.9 $134.2 $159.8 $154.7 $154.5 $165.5 $197.3 $150.9 21.4% 24.9% 28.9% 27.2% 25.9% 26.6% 31.0% 23.4% 1Q14 2Q14 3Q14 4Q14 1Q15 2Q15 3Q15 4Q15 ($ in millions) (*) Revenues Before Reimbursable Items $532.8 $538.1 $552.9 $569.3 $595.8 $622.1 $636.4 $645.1 1Q14 2Q14 3Q14 4Q14 1Q15 2Q15 3Q15 4Q15 Consolidated Revenue* YOY Growth % ($ in millions) 37.3% Adjusted Operating Income Operating Margin* 34.2% 8.5% 8.4% 11.8% > 4Q 2015 CONSOLIDATED HIGHLIGHTS 15.6% 15.1% 13.3%
9.
2015 Fourth Quarter
and Full Year Results © 2016 Total System Services, Inc.® All rights reserved worldwide. 9 ➔ Revenue – 6th straight quarter of record-setting results and double digit growth ➔ Record level of Traditional AOF at 415.1M ➔ Transactions – 6th straight quarter of record-setting volume ➔ Record year for Revenue, Operating Income and Transactions 495.5 510.3 541.4 550.0 653.2 677.5 685.5 654.1 1Q14 2Q14 3Q14 4Q14 1Q15 2Q15 3Q15 4Q15 Accounts on File YOY Growth % (in millions) 17.2% 17.1% 18.5% 19.1% 17.4% 18.1% 14.1% 16.6% 31.8% 49.4% $74.6 $84.6 $92.7 $99.6 $102.6 $108.4 $113.9 $104.2 33.2% 36.3% 38.5% 39.0% 38.5% 37.7% 38.8% 34.7% 1Q14 2Q14 3Q14 4Q14 1Q15 2Q15 3Q15 4Q15 ($ in millions) (*) Revenues Before Reimbursable Items $224.4 $233.2 $241.0 $255.5 $266.2 $287.2 $293.6 $300.3 1Q14 2Q14 3Q14 4Q14 1Q15 2Q15 3Q15 4Q15 Segment Revenue* YOY Growth % ($ in millions) Adjusted Segment Operating Income Operating Margin* 9.1% 8.7% 10.9% 14.5% 18.7% > 4Q 2015 NORTH AMERICA SEGMENT HIGHLIGHTS () Growth Excluding Prepaid, Government Services and Single Use Accounts 32.8% 46.3% 23.1% 21.8% 26.6% 36.9% 18.9% 37.3% 17.5%
10.
2015 Fourth Quarter
and Full Year Results © 2016 Total System Services, Inc.® All rights reserved worldwide. 10 ➔ Revenue down (0.6%) constant currency − Up 6.3% excluding 4Q14 one-time item ➔ AOF increased 17.8% ➔ Transactions increased 7.0% ➔ Strong operating margin growth excluding 4Q14 one-time item ➔ Delivered annual operating margin of 18.1% 60.7 62.5 64.1 66.6 70.5 73.9 74.9 78.5 1Q14 2Q14 3Q14 4Q14 1Q15 2Q15 3Q15 4Q15 Accounts on File YOY Growth % (in millions) 8.9% 7.5% 8.1% 12.7% 16.1% Adjusted Segment Operating Income Operating Margin* $76.8 $84.7 $87.4 $92.9 $73.7 $83.9 $86.4 $87.1 1Q14 2Q14 3Q14 4Q14 1Q15 2Q15 3Q15 4Q15 Segment Revenue* YOY Growth % $4.6 $11.7 $16.0 $22.8 $7.0 $13.4 $18.4 $21.4 5.9% 13.9% 18.3% 24.6% 9.5% 15.9% 21.3% 24.5% 1Q14 2Q14 3Q14 4Q14 1Q15 2Q15 3Q15 4Q15 ($ in millions) Reported Constant Currency (*) Revenues Before Reimbursable Items ($ in millions) 0.5% (4.6%) 10.6% 1.8% 12.2% 4.4% 2.5% 5.7% (4.0%) 5.1% > 4Q 2015 INTERNATIONAL SEGMENT HIGHLIGHTS 18.5% (1.0%) 9.4% (1.1%) 7.9% 16.9% 17.8% (6.2%) (0.6%)
11.
2015 Fourth Quarter
and Full Year Results © 2016 Total System Services, Inc.® All rights reserved worldwide. 11 ➔ Revenue up 13.4% ➔ Revenue mix: 61% Direct; 39% Indirect ➔ SBS Sales Volume at $6.4B, up 11.3% YOY ➔ POS transactions increased 11.2%, excluding deconverted accounts $104.6 $108.3 $115.0 $107.7 $110.4 $117.9 $123.7 $122.1 1Q14 2Q14 3Q14 4Q14 1Q15 2Q15 3Q15 4Q15 Segment Revenue* YOY Growth % (*) Revenues Before Reimbursable Items ($ in millions) $30.2 $32.9 $40.4 $31.4 $34.1 $40.7 $42.4 $33.0 28.8% 30.4% 35.1% 29.2% 30.9% 34.5% 34.3% 27.1% 1Q14 2Q14 3Q14 4Q14 1Q15 2Q15 3Q15 4Q15 Adjusted Segment Operating Income Operating Margin* ($ in millions) (4.3%) (4.1%) 1.2% (2.4%) 5.5% > 4Q 2015 MERCHANT SEGMENT HIGHLIGHTS 8.8% 7.6% 9.9% $59 $62 $65 $64 $67 $71 $74 $74 $45 $46 $50 $44 $43 $46 $50 $48 1Q14 2Q14 3Q14 4Q14 1Q15 2Q15 3Q15 4Q15 Segment Revenue by LOB YOY Growth % ($ in millions) 4% (14%) 1% (10%) 4% (2%) (9%) 3% (4%) 13% 16% (0%) 14% (1%) Direct Indirect 13.4% 15% 10%
12.
2015 Fourth Quarter
and Full Year Results © 2016 Total System Services, Inc.® All rights reserved worldwide. 12 ➔ Gross Dollar Volume (GDV) up 21.3% ➔ Total active cards at 3.9M, up 21.1% ➔ Direct deposit active cards at 1.9M, up 17.7% ➔ Added over 7,000 distributing locations and employers $6.6 $4.6 $4.4 $4.7 $7.7 $5.5 $5.4 $5.7 1Q14 2Q14 3Q14 4Q14 1Q15 2Q15 3Q15 4Q15 22.1% 17.2% 16.6% 18.2% 16.7% ($ in billions) Gross Dollar Volume YOY Growth % $132.6 $116.8 $114.0 $119.2 $155.1 $141.6 $139.6 $144.0 1Q14 2Q14 3Q14 4Q14 1Q15 2Q15 3Q15 4Q15 13.1% 11.4% 10.0% 14.4% 16.9% 21.2% 22.4% 20.9% Adjusted Segment Operating Income Operating Margin Segment Revenue YOY Growth % ($ in millions) ($ in millions) $28.7 $30.7 $36.1 $32.7 $35.5 $36.4 $37.3 $28.6 21.7% 26.3% 31.7% 27.5% 22.9% 25.7% 26.7% 19.9% 1Q14 2Q14 3Q14 4Q14 1Q15 2Q15 3Q15 4Q15 > 4Q 2015 NETSPEND SEGMENT HIGHLIGHTS 19.5% 22.3% (1%) 21.3%
13.
2015 Fourth Quarter
and Full Year Results © 2016 Total System Services, Inc.® All rights reserved worldwide. 13 > SEGMENT OPERATING MARGIN AND CONSOLIDATED ADJUSTED OPERATING MARGIN Revenues before Reimbursable Items Adjusted Operating Margin Adjusted Segment Operating Income North America $104,162 $300,265 34.69% International 21,381 87,126 24.54% Merchant 33,033 122,053 27.06% NetSpend 28,614 144,034 19.87% Eliminations -- (8,383) Corporate administration excluding stock comp (36,285) -- Adjusted operating margin $150,905 $645,095 23.39% Amortization of acquisition intangibles (22,920) Share-based compensation (10,080) Operating income (US GAAP) $117,905 (in thousands) Three Months Ended December 31, 2015
14.
2015 Fourth Quarter
and Full Year Results © 2016 Total System Services, Inc.® All rights reserved worldwide. 14 > SEGMENT OPERATING MARGIN AND CONSOLIDATED ADJUSTED OPERATING MARGIN Revenues before Reimbursable Items Adjusted Operating Margin Adjusted Segment Operating Income North America $429,064 $1,147,254 37.40% International 60,087 331,159 18.14% Merchant 150,225 474,040 31.69% NetSpend 137,837 580,377 23.75% Eliminations -- (33,481) Corporate administration excluding stock comp (109,035) -- Adjusted operating margin $668,178 $2,499,349 26.73% Amortization of acquisition intangibles (92,522) Stock-based compensation (41,549) Operating income (US GAAP) $534,107 (in thousands) Twelve Months Ended December 31, 2015
15.
2015 Fourth Quarter
and Full Year Results © 2016 Total System Services, Inc.® All rights reserved worldwide. 15 > ROLLFORWARD OF QUARTERLY CASH BALANCE $200 $500 $100 $0 $300 Operating Activities $140 Cap Ex ($67) Debt Pmts ($13) Dividends ($18) Ending Balance $389 (in millions) 9/30/2015 12/31/2015 $400 Beginning Balance $448 Share Repurchase ($159) $700 $600 Other $58
16.
2015 Fourth Quarter
and Full Year Results © 2016 Total System Services, Inc.® All rights reserved worldwide. > CASH FLOW STRENGTH: 2015 Consolidated Financial Highlights (in millions) $834 $600 $397 $369 $389 $0 $75 $150 $225 $300 $375 $450 $525 $600 $675 $750 $825 $900 Adjusted EBITDA Cash flow from operations Free cash flow Net income Ending cash (TTM = Trailing Twelve Months) 16
17.
2015 Fourth Quarter
and Full Year Results © 2016 Total System Services, Inc.® All rights reserved worldwide. Range Range Percent Change Total Revenues $2,900 to $2,946 4% to 6% Revenues Before Reimbursable Items $2,624 to $2,674 5% to 7% Adjusted EPS attributable to TSYS common shareholders from continuing operations $2.56 to $2.62 4% to 7% Average Basic Weighted Shares 184.5 (in millions, except per share data) (*) See Appendix for guidance assumptions > 2016 GUIDANCE* 17
18.
Transaction Overview and
Strategic Rationale M. Troy Woods Chief Executive Officer, TSYS 18 © 2016 Total System Services, Inc.® All rights reserved worldwide.
19.
© 2016 Total
System Services, Inc.® All rights reserved worldwide. 19 Winning Combination of Technology, Scale and Partner-Centric Distribution
20.
© 2016 Total
System Services, Inc.® All rights reserved worldwide. 20 > TRANSACTION OVERVIEW ➔ Creates winning combination of technology, scale and distribution ➔ Accelerates growth in integrated payments ➔ Strengthens sales and distribution through expanded partnership network ➔ Enhances access to high-growth markets and attractive verticals Compelling Combination & Strategic Fit ➔ Immediately accretive transaction ➔ Delivers revenue growth and adjusted EPS growth ➔ Valuation and synergies combine to drive significant shareholder value Highly Attractive Financial Benefits Key Metrics & Timeline ➔ $2.35 billion all-cash consideration ➔ ~3.9x debt / 2015 TTM PF adjusted EBITDA ➔ Expected to close in Q2 2016
21.
21 > HIGHLY ATTRACTIVE
GROWTH MARKET Merchant acquiring: large and fast-growing Integrated Payments 12% Large SMB © 2016 Total System Services, Inc.® All rights reserved worldwide. $13 BILLION* 2014 eCommerce Acquiring Industry U.S. GDP 10% 5% 2-3% *Total Addressable Market by net revenue. SMB estimated to be $10 billion. Notes: Market growth forecast based on 2014-2019 CAGRs Source: First Annapolis Consulting, Economist Intelligence Unit
22.
$54 billion in
sales volume 410,000 merchant outlets 683 million transactions 22 > OUR MERCHANT TRANSFORMATION TSYS TSYS + TRANSFIRST © 2016 Total System Services, Inc.® All rights reserved worldwide. Emerging presence in integrated payments, e-commerce and omni- commerce #3 in U.S. in integrated payments* with enhanced e-commerce and omni-commerce capabilities PRIORITIES Business 60% Direct / 40% Indirect 81% Direct / 19% Indirect Reliance on self-sourced lead generation Partner-centric distribution focused on high-growth verticals Scale Growth Profile Mid-single digit High-single digit Positioned in High-Growth Areas Distribution $117 billion in sales volume 645,000 merchant outlets 1.2 billion transactions *Pro forma ranking per First Annapolis Consulting and based on 2014 net revenue (gross revenue less interchange, assessments and card brand pass-throughs)
23.
23 > ESTABLISHES TSYS’
LEADERSHIP POSITION IN ACQUIRING ➔ 1,300 distribution partners ➔ Rich ecosystem of independent software vendors (ISVs), value added resellers (VARs) and financial institutions ➔ Expertise in partner-centric distribution ➔ Specialized capabilities and expertise ➔ Innovative products focused on high-growth verticals ➔ Proprietary platform with single point of access ➔ Improved e-commerce and omni-commerce offering ➔ Increased opportunity for merchant retention, partner satisfaction and cross-sell © 2016 Total System Services, Inc.® All rights reserved worldwide. U.S. Merchant Provider based on Net Revenue* EXPANDED SALES AND DISTRIBUTION NETWORK STRONGER INTEGRATED TECHNOLOGY PARTNER ENHANCED MULTI-CHANNEL PAYMENT SOLUTIONS #6 *Pro forma ranking per First Annapolis Consulting and based on 2014 net revenue (gross revenue less interchange, assessments and card brand pass-throughs)
24.
24 > CREATES STRONG
& BALANCED PORTFOLIO ISSUER PROCESSING ➔ #1 in U.S. third-party credit ➔ #2 in Europe ➔ Blue chip relationships and 400+ global clients MERCHANT SERVICES ➔ #6 U.S. merchant solutions provider based on net revenue ➔ 645,000 merchant outlets ➔ ~$117 billion annual transaction volume ➔ #1 program manager based on GDV ➔ 96,000 distributing employers and locations ➔ ~4 million cardholders ISSUER PROCESSING MERCHANT SERVICES PREPAID PROGRAM MANAGEMENT PREPAID PROGRAM MANAGEMENT © 2016 Total System Services, Inc.® All rights reserved worldwide.
25.
TransFirst Overview John Shlonsky President
and Chief Executive Officer, TransFirst 25 © 2016 Total System Services, Inc.® All rights reserved worldwide.
26.
> VALUE PROPOSITION ©
2016 Total System Services, Inc.® All rights reserved worldwide. 26 Unique value proposition drives strong revenue growth and merchant retention Expertise In Partner- centric Distributions Proprietary Integrated Technology Partner Multi-channel Payment Solutions ➔ Economic alignment ➔ Collaborative approach ➔ Merchant stickiness + Culture of Service and Operating Excellence ➔ One partner ➔ Single access point ➔ Seamless integration ➔ Customized solutions ➔ Grow with merchants ➔ Value-added functions +
27.
Proprietary Product Delivery System Clearing &
Settlement Reporting & Analytics Portal Boarding Front-end Back-end Reporting © 2016 Total System Services, Inc.® All rights reserved worldwide. 27 > TRANSFIRST ECOSYSTEM Single touch point across multiple channels provides differentiated service model Software Integration Virtual Terminal Proprietary iPOS / Register Mobile Hosted Payment Terminal Shopping Cart Health VAR Not-for- Profit Government Bank ISO Agent ecommerce .org Association INTEGRATED TECHNOLOGY PARTNERS REFERRAL PARTNERS MULTI-CHANNEL PROCESSING CAPABILITIES Electronic Merchant/Partner Boarding Tool TRANSFIRST ENGINE
28.
> GREAT FIT
ACROSS THE BOARD © 2016 Total System Services, Inc.® All rights reserved worldwide. 28 Strong cultural fit with shared vision and values Seamless integration transition Enhanced offerings for merchants and partners Fosters a holistic approach to payments
29.
Financial Considerations Paul Todd Chief
Financial Officer, TSYS 29 © 2016 Total System Services, Inc.® All rights reserved worldwide.
30.
CLOSING 30 > FINANCIAL CONSIDERATIONS ➔
$2.35 billion enterprise value ➔ Implied multiple of 13.8x 2016E adjusted EBITDA before synergies ➔ All cash offer ➔ Pro forma debt of $3.8 billion ➔ Expected leverage of ~3.9x debt / 2015 TTM PF adjusted EBITDA ➔ Strong cash flow generation supports de-levering ➔ Fully committed financing FINANCING ➔ Expect low double-digit accretion to adjusted EPS* ➔ Projected $25 million in annualized cost synergies in 2018, driving significant shareholder value ➔ Transaction expected to close in Q2 2016 ➔ Completion subject to regulatory approvals and other customary closing conditions © 2016 Total System Services, Inc.® All rights reserved worldwide. VALUATION NETSPEND NORTH AMERICA INTERNATIONAL TSYS MERCHANT + TRANSFIRST **Represents net revenue, which excludes reimbursables and interchange & assessments; and is based on unaudited financial information. PRO FORMA *For the first 12-month period following closing, excluding one-time acquisition-related fees and expenses. ~1/3 Pro Forma Combined Revenues 2015 Pro Forma Combined Revenues**
31.
> COMPELLING STRATEGIC
RATIONALE © 2016 Total System Services, Inc.® All rights reserved worldwide. 31 Highly attractive growth market Establishes leadership position in merchant solutions Accelerates growth in integrated payments and strengthens partnership distribution capabilities Significant value creation Proven management team and track record
32.
Q&A © 2016 Total
System Services, Inc.® All rights reserved worldwide.
33.
Appendix 33 © 2016 Total
System Services, Inc.® All rights reserved worldwide.
34.
2015 Fourth Quarter
and Full Year Results © 2016 Total System Services, Inc.® All rights reserved worldwide. 34 ➔ Adjusted EBITDA is net income excluding equity in income of equity investments, nonoperating income/(expense), taxes, depreciation, amortization and stock-based compensation expenses and NetSpend merger & acquisition expenses. ➔ Adjusted EPS is adjusted earnings divided by weighted average shares outstanding used for basic EPS calculations. Adjusted earnings is net income excluding the after-tax impact of stock-based compensation expenses, amortization of acquisition intangibles, and NetSpend merger & acquisition expenses. ➔ Adjusted segment operating income is operating income at the segment level adjusted for amortization of acquisition intangibles. ➔ Adjusted segment operating margin is adjusted segment operating income divided by segment revenues before reimbursable items. ➔ The Company believes that these non-GAAP financial measures it presents are useful to investors in evaluating the Company’s operating performance for the following reasons: – adjusted EBITDA and adjusted EPS are widely used by investors to measure a company’s operating performance without regard to items, such as interest expense, income tax expense, depreciation and amortization, merger and acquisition expenses and employee stock-based compensation expense that can vary substantially from company to company depending upon their respective financing structures and accounting policies, the book values of their assets, their capital structures and the methods by which their assets were acquired; and – securities analysts use adjusted EBITDA and adjusted EPS as supplemental measures to evaluate the overall operating performance of companies. ➔ By comparing the Company’s adjusted EBITDA and adjusted EPS in different historical periods, investors can evaluate the Company’s operating results without the additional variations caused by employee stock-based compensation expense, which may not be comparable from period to period due to changes in the fair market value of the Company’s common stock (which is influenced by external factors like the volatility of public markets and the financial performance of the Company’s peers) and is not a key measure of the Company’s operations. ➔ The Company’s management uses the non-GAAP financial measures: – as measures of operating performance, because they exclude the impact of items not directly resulting from the Company’s core operations; – for planning purposes, including the preparation of the Company’s annual operating budget; – to allocate resources to enhance the financial performance of the Company’s business; – to evaluate the effectiveness of the Company’s business strategies; and – in communications with the Company’s board of directors concerning the Company’s financial performance. > APPENDIX: Non-GAAP Items – Adjusted EBITDA and Adjusted EPS
35.
2015 Fourth Quarter
and Full Year Results © 2016 Total System Services, Inc.® All rights reserved worldwide. Consumer Credit 382.1 270.0 41.5 382.1 373.6 2.3 Retail 26.1 28.4 (7.9) 26.1 25.4 2.8 Total Consumer 408.2 298.4 36.8 408.2 399.0 2.3 Commercial 45.4 41.6 9.2 45.4 44.1 3.1 Other 26.6 22.4 18.8 26.6 24.8 6.9 Subtotal 480.2 362.4 32.5 480.2 467.9 2.6 Prepaid*/ Stored Value 97.2 127.3 (23.7) 97.2 133.8 (27.3) Government Services 79.3 67.4 17.8 79.3 78.7 0.9 Commercial Card Single Use 75.8 59.6 27.1 75.8 80.0 (5.2) Total AOF 732.5 616.7 18.8 732.5 760.4 (3.7) (in millions) Dec 2015 Dec 2014 % Change Dec 2015 Sep 2015 % Change (* - Prepaid does not include NetSpend accounts) > APPENDIX: Accounts on File Portfolio Summary 35
36.
2015 Fourth Quarter
and Full Year Results © 2016 Total System Services, Inc.® All rights reserved worldwide. > APPENDIX: Non-GAAP Reconciliation – Revenues Before Reimbursable Items Three Months Ended Twelve Months Ended 12/31/15 12/31/14 12/31/15 12/31/14 Total Revenues $716,843 $635,104 $2,779,541 $2,446,877 Reimbursable Items 71,748 65,803 280,192 253,899 Revenues Before Reimbursable Items $645,095 $569,301 $2,499,349 $2,192,978 (in thousands) 36
37.
2015 Fourth Quarter
and Full Year Results © 2016 Total System Services, Inc.® All rights reserved worldwide. > APPENDIX: Non-GAAP Reconciliation – Adjusted Segment Operating Income and Operating Margin Three Months Ended Twelve Months Ended 12/31/15 12/31/14 12/31/15 12/31/14 Operating income $117,905 $122,773 $534,107 $431,640 Add: Acquisition intangible amort 22,920 24,166 92,522 96,971 Add: Corporate admin and other 46,365 39,671 150,584 141,181 Total segment adjusted operating income $187,190 $186,610 $777,213 $669,792 By segment: North America services (a) $104,162 $99,620 $429,064 $351,512 International services (b) $21,381 $22,849 $60,087 $55,123 Merchant services (c) $33,033 $31,399 $150,225 $134,872 NetSpend (d) $28,614 $32,742 $137,837 $128,285 Total revenues $716,843 $635,104 $2,779,541 $2,446,877 Reimbursable items (71,748) (65,803) (280,192) (253,899) Total segment revenues before reimbursable items $645,095 $569,301 $2,499,349 $2,192,978 Intersegment revenues 8,383 5,975 33,481 21,224 By segment: North America services (e) $300,265 $255,539 $1,147,254 $954,082 International services (f) $87,126 $92,895 $331,159 $341,785 Merchant services (g) $122,053 $107,677 $474,040 $435,649 NetSpend (h) $144,034 $119,165 $580,377 $482,686 Adjusted segment operating margin: North America services (a) / (e) 34.69% 38.98% 37.40% 36.84% International services (b) / (f) 24.54% 24.60% 18.14% 16.13% Merchant services (c) / (g) 27.06% 29.16% 31.69% 30.96% NetSpend (d) / (h) 19.87% 27.48% 23.75% 26.58% (in thousands) 37
38.
2015 Fourth Quarter
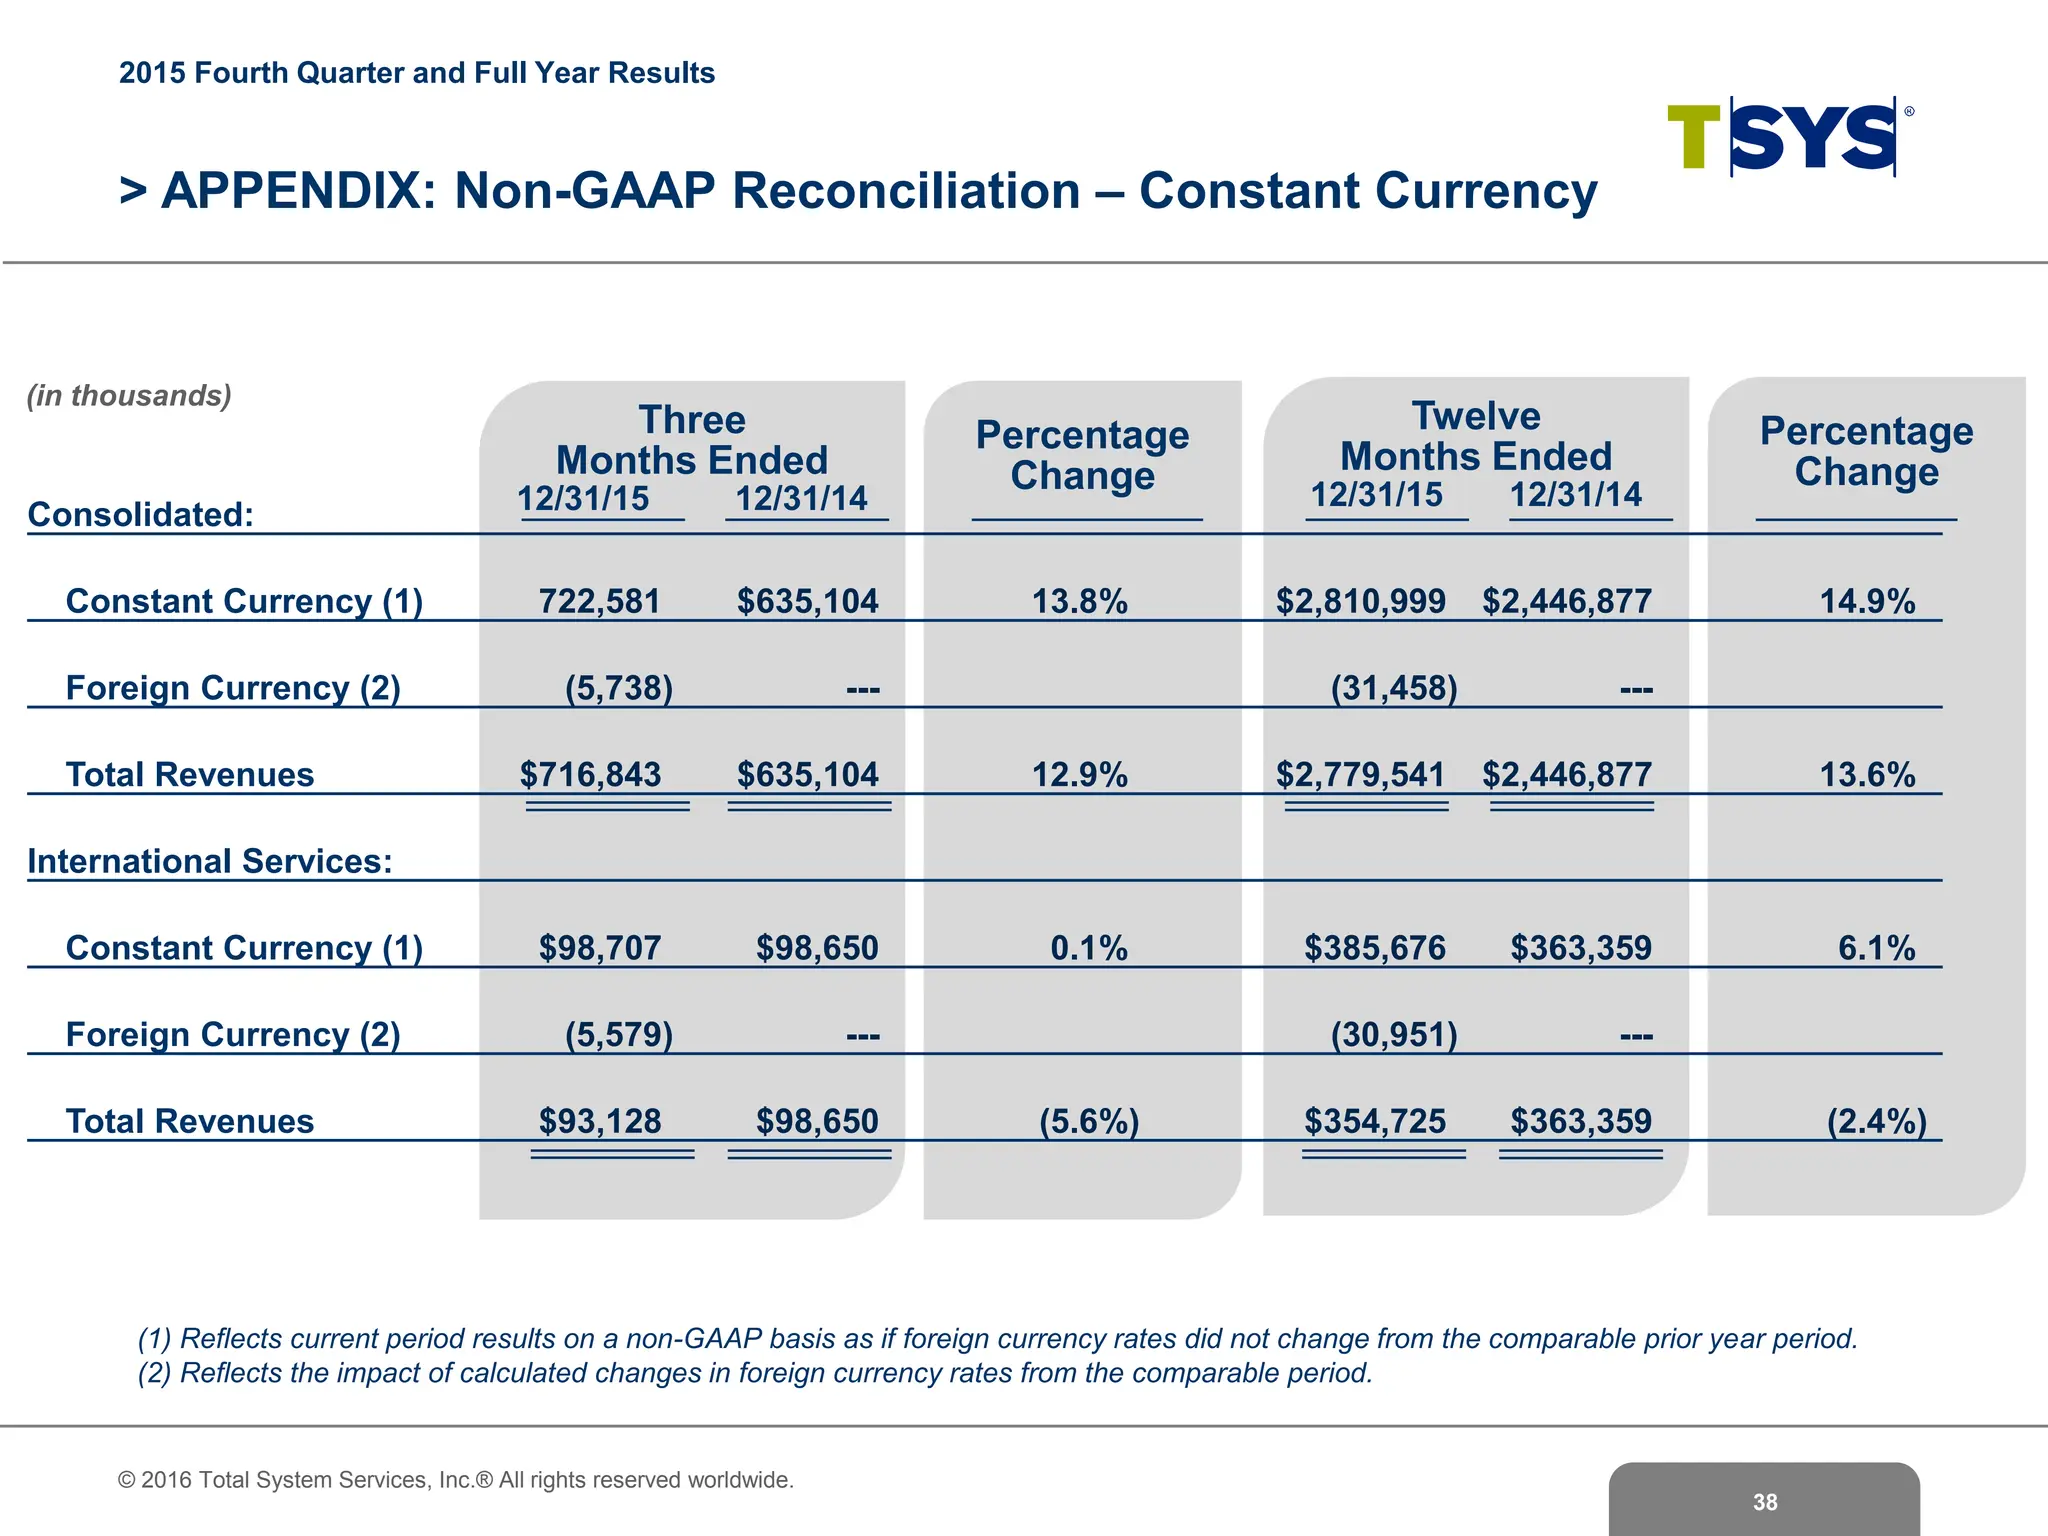
and Full Year Results © 2016 Total System Services, Inc.® All rights reserved worldwide. (1) Reflects current period results on a non-GAAP basis as if foreign currency rates did not change from the comparable prior year period. (2) Reflects the impact of calculated changes in foreign currency rates from the comparable period. > APPENDIX: Non-GAAP Reconciliation – Constant Currency Twelve Months Ended 12/31/15 12/31/14 Percentage Change Three Months Ended 12/31/15 12/31/14 Percentage Change (in thousands) Consolidated: Constant Currency (1) 722,581 $635,104 13.8% $2,810,999 $2,446,877 14.9% Foreign Currency (2) (5,738) --- (31,458) --- Total Revenues $716,843 $635,104 12.9% $2,779,541 $2,446,877 13.6% International Services: Constant Currency (1) $98,707 $98,650 0.1% $385,676 $363,359 6.1% Foreign Currency (2) (5,579) --- (30,951) --- Total Revenues $93,128 $98,650 (5.6%) $354,725 $363,359 (2.4%) 38
39.
2015 Fourth Quarter
and Full Year Results © 2016 Total System Services, Inc.® All rights reserved worldwide. 39 (1) Reflects current period results on a non-GAAP basis as if foreign currency rates did not change from the comparable prior year period. (2) Reflects the impact of calculated changes in foreign currency rates from the comparable period. > APPENDIX: Non-GAAP Reconciliation – Constant Currency Twelve Months Ended 12/31/15 12/31/14 Percentage Change Three Months Ended 12/31/15 12/31/14 Percentage Change (in thousands) Consolidated: Constant Currency (1) $650,484 $569,301 14.3% $2,528,775 $2,192,978 15.3% Foreign Currency (2) (5,389) --- (29,426) --- Revenues before reimbursable items $645,095 $569,301 13.3% $2,499,349 $2,192,978 14.0% International Services: Constant Currency (1) $87,126 $92,895 (6.2%) $331,159 $341,785 (3.1%) Foreign Currency (2) (5,231) --- (28,918) --- Revenues before Reimbursable Items $92,357 $92,895 (0.6%) 360,077 $341,785 5.4%
40.
> APPENDIX: Non-GAAP
Reconciliation – EBITDA and Adjusted EBITDA 2015 Fourth Quarter and Full Year Results © 2016 Total System Services, Inc.® All rights reserved worldwide. 40 (in thousands) Three Months Ended Twelve Months Ended Dec 2015 Dec 2014 Dec 2015 Dec 2014 Net income : As reported (GAAP) (a) $84,716 $81,242 $369,041 $329,406 Adjusted for: Deduct: Income from discontinued operations (1,411) 3,338 (1,411) (48,655) Deduct: Equity in Income of Equity Investments (6,797) (5,751) (22,106) (17,583) Add: Income Taxes 32,160 35,428 151,364 129,761 Add: Nonoperating expenses 9,237 8,516 37,219 38,711 Add: Depreciation and amortization 67,046 63,191 258,264 246,620 EBITDA $184,951 $185,964 $792,371 $678,260 Adjust for: Add: Share-based compensation 10,080 7,771 41,549 30,790 Add: NetSpend M&A expenses -- 3 -- 3,217 Adjusted EBITDA $195,031 $193,738 $833,920 $712,267 Add/deduct: State tax credits and related expenses 181 -- (14,903) -- Adj. EBITDA without impact of state tax credits and related expenses $195,212 $193,738 $819,017 $712,267
41.
2015 Fourth Quarter
and Full Year Results © 2016 Total System Services, Inc.® All rights reserved worldwide. > APPENDIX: Non-GAAP Reconciliation – Adjusted EPS (in thousands) Three Months Ended Twelve Months Ended Dec 2015 Dec 2014 Dec 2015 Dec 2014 Income from continuing operations available to TSYS Common Shareholders: As reported (GAAP) (a) $81,417 $83,198 $362,633 $275,216 Adjusted for amounts attributable to TSYS common shareholders (net of taxes): Acquisition intangible amortization 15,580 17,747 61,525 65,127 Share-based compensation 6,933 5,777 27,954 20,944 NetSpend M&A expenses -- 3 -- 3,115 Adjusted earnings (b) $103,930 $106,725 $452,112 $364,402 Federal and state tax credits and related expenses, net of tax 118 -- (23,440) -- Adjusted EPS without impact of state tax credits and related expenses (c) $104,048 $106,725 $428,672 $364,402 Average common shares outstanding and participating securities (d) 183,376 185,221 184,082 186,222 Basic EPS Available to TSYS Common Shareholders (a) / (d) $0.44 $0.45 $1.97 $1.48 Adjusted EPS Available to TSYS Common Shareholders (b) / (d) $0.57 $0.58 $2.46 $1.96 Adjusted EPS without impact of tax credits Available to TSYS Common Shareholders (c) / (d) $0.57 $0.58 $2.33 $1.96 41
42.
2015 Fourth Quarter
and Full Year Results © 2016 Total System Services, Inc.® All rights reserved worldwide. Twelve Months Ended 12/31/2015 Cash flows from operating activities $600,194 Less: Purchases of property and equipment (54,640) Additions to licensed computer software from vendors (50,728) Additions to internally developed computer software (39,219) Additions to contract acquisition costs (58,728) Free cash flow $396,879 (in thousands) > APPENDIX: Non-GAAP Reconciliation – Free Cash Flow 42
43.
> APPENDIX: Non-GAAP
Reconciliation – EBITDA and Adjusted EBITDA 2015 Fourth Quarter and Full Year Results © 2016 Total System Services, Inc.® All rights reserved worldwide. Twelve Months Ended 12/31/2015 Net Income $369,041 Adjusted for: Add: Discontinued operations (1,411) Deduct: Equity in Income of Equity Investments (22,106) Add: Income Taxes 151,364 Add: Nonoperating expense 37,219 Add: Depreciation and Amortization 258,264 EBITDA $792,371 Adjust for: Share-based compensation 41,549 Adjusted EBITDA $833,920 (in thousands) * Excludes share-based compensation 43
44.
> APPENDIX: 2016
Guidance Assumptions © 2016 Total System Services, Inc.® All rights reserved worldwide. The guidance assumes: ➔ There will be no significant movements in the London Interbank Offered Rate and TSYS will not make any significant draws on the remaining balance of its credit facility; ➔ There will be no significant movement in foreign currency exchange rates related to TSYS’ business; ➔ TSYS will not incur significant expenses associated with the conversion of new large clients, additional acquisitions, or any significant impairment of goodwill or other intangibles; ➔ There will be no deconversions of large clients during the year other than as previously disclosed; and ➔ The economy will not worsen. ➔ Additionally, the impact of any future share repurchases is not included. 2015 Fourth Quarter and Full Year Results 44
Download