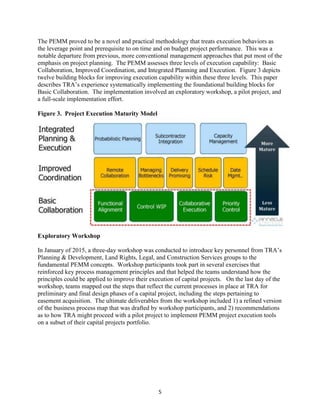
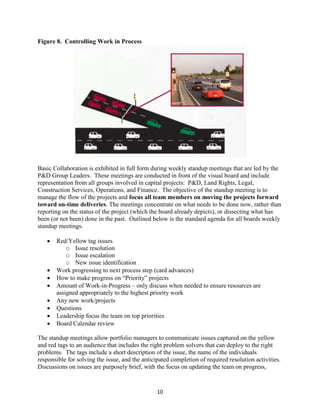
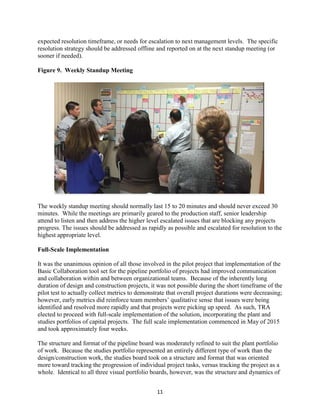
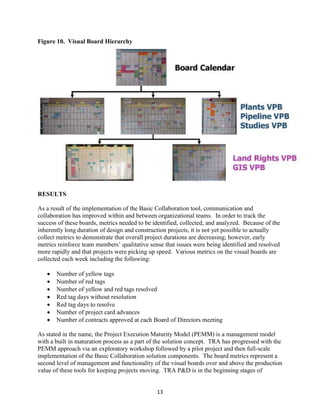
TEXAS WATER 2016
MANAGING A BILLION-PLUS DOLLAR CIP PROGRAM
FOR A WHOLESALE TEXAS WATER UTILITY
Marco A. Ramirez, P.E.
Co-Author Ronald K. Tamada, P.E.
Co-Author Kenneth G. Lawrence, P.E., IT Nexus, Inc.
Trinity River Authority of Texas
P.O. Box 240
Arlington, Texas 76004-0240
BACKGROUND
The Trinity River Authority of Texas (TRA) was created by the Texas legislature in 1955 and is
responsible for maintaining a master plan for basin-wide development, serves as local sponsor
for federal water projects, and provide services authorized by the Texas Legislature within
TRA’s territory. TRA’s mission is to promote conservation, reclamation, protection and
development of the natural resources in the Trinity River basin for the benefit of the public.
Management teams, divided into a Northern Region and a Southern Region, are responsible for
operating TRA's existing facilities and for developing new ones as appropriate. The general
manager serves as the chief executive officer of TRA and the management levels listed below
support the board of directors, the general manager, and the Northern and Southern Region
offices in pursuit of their responsibilities.
Northern Region – Responsible for the development of revenue-oriented projects in the
northern portion of TRA’s service area, the operation and maintenance of existing facilities, the
sale of water from existing reservoirs, and acting as liaison between TRA and its customers
and/or the federal government.
Southern Region – Responsible for the development of revenue-oriented projects in the
southern portion of TRA’s service area, the operation and maintenance of existing facilities, the
sale of water from existing reservoirs, and acting as liaison between TRA and its customers
and/or the federal government.
Financial Services – Responsible for the performance of financial services to all components of
TRA's management organization.
Legal Services – Responsible for providing legal support within the management organization,
including land rights issues.
General Services – Responsible for managing personnel, information technology, risk
management, safety and office administration.
2
Planning and Environmental Services – PES provides technical assistance to the Authority
through the implementation/management of geographic information systems (GIS) and
environmental services. Through GIS, PES provides enterprise-wide support allowing Authority
staff to view spatially-referenced assets and information with integrated databases.
Environmental Services staff provide support through model development, studies, sampling
efforts, research, representation with state and local officials, and by administering the Trinity
Basin Clean Rivers Program.
Construction Services – Responsible for construction-related support activities including
review of plans and specifications, bids, contract administration and acting as liaison with land
rights staff and regional offices.
Figure 1. TRA Management Structure
PROBLEM STATEMENT
This paper focuses on the planning and execution of water and wastewater capital improvement
projects for the Northern Region, which is the responsibility of the Planning and Development
Group (P&D). TRA currently provides wholesale drinking water and wastewater services to
customer cities through multi-contracting party agreements. TRA owns and operates in the
Northern Region service area five regional wastewater treatment systems and one regional water
3
Service
Area
Trinity River Basin
treatment and supply facility. The capital infrastructures of the Northern Region operating
systems are depicted in Figure 2. P&D manages the design and construction phase engineering
for pipeline and plant projects, including services related to regulatory compliance. P&D is also
responsible for the development and maintenance of a five-year Capital Improvements Program
(CIP), which is updated semi-annually in response to the changing needs of the six wholesale
water and wastewater systems operating in the Northern Region.
Figure 2. TRA Northern Region Operating Systems
TRA has seen its capital infrastructure grow significantly over the years, and with this growth
has come an ever increasing number of new capital improvement projects and increasing
frequency of capital bond sales to fund them. In 2002 the Northern Region was managing design
and construction contracts totaling $61 million. In 2005 this amount had grown to $142 million.
Currently, Northern Region has $396 million in design and construction projects under contract.
Projected capital expenditures for design and construction in the current five-year CIP is just
under one billion dollars.
With the rapid growth of TRA’s capital program came an increased complexity of management.
TRA began experiencing extended durations of design and construction projects as it became
more challenging to manage all the moving parts of a large and highly dynamic portfolio of
work. Recognizing that there was a schedule management problem, TRA identified several
causative factors including: resolving issues in a timely manner; communication and handoffs
4
between internal groups; priorities not well defined for focus of team resources; extended
internal reviews of interim design documents; missed deadlines in the projects resulting in
rework; closing out projects; assessing team workload capacity for introduction of new work;
and the effect that schedule overruns on active projects had on funding schedules for new work.
SOLUTION DEVELOPMENT
The challenges that had been identified with delivering capital projects on budget and on
schedule were taken into consideration when TRA developed its five-year strategic plan in 2013.
The Strategic Plan reflected TRA’s core values, which include the integrity in all things,
excellence in service and performance, accountability to the public, customers and to each other,
and teamwork and professionalism. The TRA leadership outlined seven goals and objectives for
the organization in the Strategic Plan:
1. Engage Board of Directors involvement, facilitate Board understanding of the operations,
and improve Board information and support.
2. Maintain Customer Service Excellence by promoting financial transparency, maintain
technical leadership, partner with customer cities, and accelerate project completion.
3. New Business Growth; ensure continuous service quality, expand and diversify services,
and optimize real estate income opportunities.
4. Robust Community Partnerships by raising positive public awareness, support water
conversation and education programs, and solidify key stakeholder partnerships.
5. Efficient and Effective Operations; Strengthen Human Resources support, upgrade
financial processes, leverage information technology, improve procurement processes,
and faster, better, cost-effective service delivery.
6. Human Capital Development; Competent, adaptable workforce, orderly management
succession, and attract, recruit and retain talent.
7. Effective Corporate Communication by promoting an identifiable brand, building internal
awareness, and proactively engaging the media.
Among the detailed operating objectives and strategies that were defined to accomplish the
above goals was the following strategy for maintaining customer service excellence (Strategic
Goal No. 2):
Develop and document a standardized set of project planning and management
processes and tools to drive accuracy, consistency, and timeliness and provide
associated training.
This organizational strategy was the driver for the TRA Northern Region P&D group to
undertake efforts to strengthen the data, tools, and practices related to the capital program. One
such effort, which is the primary focus of this paper, involved retaining the services of a project
execution expert to assist the organization in maturing processes and behaviors necessary for
accelerating project delivery. P&D set out to explore the adoption of a Project Execution
Maturity Model (PEMM) as the fundamental framework for improving capital project planning
and execution.
5
The PEMM proved to be a novel and practical methodology that treats execution behaviors as
the leverage point and prerequisite to on time and on budget project performance. This was a
notable departure from previous, more conventional management approaches that put most of the
emphasis on project planning. The PEMM assesses three levels of execution capability: Basic
Collaboration, Improved Coordination, and Integrated Planning and Execution. Figure 3 depicts
twelve building blocks for improving execution capability within these three levels. This paper
describes TRA’s experience systematically implementing the foundational building blocks for
Basic Collaboration. The implementation involved an exploratory workshop, a pilot project, and
a full-scale implementation effort.
Figure 3. Project Execution Maturity Model
Exploratory Workshop
In January of 2015, a three-day workshop was conducted to introduce key personnel from TRA’s
Planning & Development, Land Rights, Legal, and Construction Services groups to the
fundamental PEMM concepts. Workshop participants took part in several exercises that
reinforced key process management principles and that helped the teams understand how the
principles could be applied to improve their execution of capital projects. On the last day of the
workshop, teams mapped out the steps that reflect the current processes in place at TRA for
preliminary and final design phases of a capital project, including the steps pertaining to
easement acquisition. The ultimate deliverables from the workshop included 1) a refined version
of the business process map that was drafted by workshop participants, and 2) recommendations
as to how TRA might proceed with a pilot project to implement PEMM project execution tools
on a subset of their capital projects portfolio.
6
Figure 4. Draft Process Maps
Figure 5. Final Process Map
Pilot Project
TRA P&D organizes its capital program into three portfolios of projects: pipeline, plant, and
studies. Based upon the success of the three-day workshop, TRA elected to proceed with
implementation of the Basic Collaboration tools for the portfolio of pipeline projects. The goal
of Basic Collaboration is project velocity, or flow, where the focus is upon completion of tasks
and shortening project durations. The pipeline portfolio was selected for the pilot project for two
7
reasons. First, pipeline projects tend to exhibit less process variability than plant projects,
making them a slightly easier test case. Second, pipeline projects, unlike plant projects, require
extensive coordination between P&D and the Land Rights and Legal group. And, it was
important that the pilot test confirm that the Basic Collaboration tools did indeed provide
solutions for the challenges that had been previously identified regarding coordination between
internal groups.
The pilot project was initiated in March of 2015 and took three weeks to complete. Week 1
involved validating and refining the process map to fully represent projects in the pipeline
portfolio. Based on the validated process map, a determination was made regarding the
appropriate structure and format for implementation of a “Visual Portfolio Board.” The visual
board was a solution concept that was introduced in the three-day workshop. Various structures
and formats of visual boards were presented during the workshop to demonstrate the concepts
involved in achieving the best application of the Project Execution Maturity Model to a
particular organization and process. It was determined that the structure and format that is most
applicable for TRA’s capital program is essentially that of a large-scale, interactive swim lane
diagram. Figure 6 illustrates the prototype visual board for TRA’s pipeline portfolio. One
horizontal swim lane is designated for each portfolio manager where, ultimately, all of that
manager’s projects will be represented within their respective lanes. The vertical columns
generally match the steps listed horizontally across the top of the process map shown in Figure 5.
Part of the piloting effort involved how to translate and consolidate the horizontal elements from
the process map to vertical columns on the visual board to reflect the logical sequence between
key decision points for project progress.
Figure 6. Initial Visual Portfolio Board Structure and Format
Figure 7 illustrates the initial version of the Pipeline Board that was in place by the end of the
first week of the pilot. Each 3x5 index card on the board represents an active project in each
manager’s portfolio. At this stage of development, there are approximately 57 projects
represented on the Pipeline Board. Written on each card is some fundamental project
identification information, and the color of each card indicates the regional operating system to
8
which the project pertains. One of the most fundamental objectives of the visual board is to
rapidly communicate where the work is in the system. With little more than a glance at the
Pipeline Board, one is apprised of the status of a project (via the card’s position from left to right
on the Board), to which operating system the project pertains (via the color), and who is
managing the project (via the swim lane in which it is located).
Figure 7. Early Version of Pipeline Visual Board
While the information cited above may sound elementary, the fact that all groups involved agree
on this objective representation of where a project is in the system sets the stage for the first
PEMM building block referred to as “Functional Alignment.” For starters, the board column
headings themselves signify that these process steps have been officially adopted by the
organization. Rather than the official process being documented and buried somewhere in a
guidance or procedures manual, its persistent visibility on the visual board helps maintain
alignment among all parties as to the proper sequence of process steps to be executed. The left-
to-right position of a project card on the board self-reports the project status. Other groups in the
organization that either receive a hand-off from P&D or become engaged in the project at a
particular milestone are able to anticipate their involvement stage as individual project cards
progress from left to right on the board over a period of time.
This simple depiction of the portfolio of work was surprisingly informative to those not directly
involved in the day-to-day aspects of these projects. For purposes of this paper, the
organizational hierarchy of P&D may be thought of as P&D Manager (a.k.a. Portfolio Manager)
→ P&D Group Leader → P&D Sr. Manager → Northern Region (NR) Manager. The visual
boards allow all management levels, as well as other groups peripheral to P&D, to quickly assess
the fundamental status of all projects in the capital program. This includes, as the next section
will explain, the status of any issues that may be impacting project progress.
9
Collaborative Execution is the second of the four building blocks that was addressed in the
Basic Collaboration level of the PEMM. Collaboration is required during project execution to
address issues that arise that may impact project velocity. Issues that cause the velocity to
decrease, or that cause the project to stop altogether, must be rapidly identified and resolved for
the project to stay on schedule. Yellow tags are affixed to project cards to signify that a minor
issue has arisen that may threaten project velocity. Red tags are affixed to signify major issues
that have caused the project to stop, or that require escalation above the portfolio manager’s level
to resolve expediently. A log is kept of red tag issues to document owners of, and actions on, the
issues and to track time to resolve. Additional discussion on the use of these tags is provided in
subsequent paragraphs that describe the weekly standup meetings.
Priority Control is the third PEMM building block and refers to the means by which
management clearly defines the priorities for focus of team resources. By physically placing
priority buttons on project cards, the P&D Sr. Manager indicates the top three most important
projects out of all projects in the pipeline portfolio of work. Additionally, the NR Manager may
place one priority button on the board. These buttons, once placed, typically remain set for
weeks at a time; however, under highly dynamic conditions they may be moved to different
projects on a weekly basis to keep the team informed of shifting demands. The priority buttons
direct the teams’ efforts to get the most important work done first, and help reduce multi-tasking.
And, having only four priority buttons for the entire board protects portfolio managers from
getting the blanket message from next management levels that “everything is a priority,” which
of course is impractical.
Controlling Work in Process (WIP) was the final building block implemented at the PEMM
Basic Collaboration level. The P&D group, like every production team, has a finite production
capacity. Various board metrics are tracked that indicate the rate at which work is progressing as
well as the number of active issues and rate of issue resolution. These metrics provide another
tool for the P&D Sr. Manager’s use in determining the timing and quantity of new work to
release into the system. The project cards in each manager’s portfolio, or on the entire board,
may be thought of as cars on the highway (Figure 8), travelling at some velocity from start to
finish. Due to the limited capacity of the highway, there comes a point at which adding more
cars to the highway slows down all cars on the highway. For a work portfolio that is already
overloaded, proper WIP control will almost always result in freeing up capacity and increased
speed. A well-managed WIP also reduces multi-tasking, which results in smoother flow and
shorter project durations.
10
Figure 8. Controlling Work in Process
Basic Collaboration is exhibited in full form during weekly standup meetings that are led by the
P&D Group Leaders. These meetings are conducted in front of the visual board and include
representation from all groups involved in capital projects: P&D, Land Rights, Legal,
Construction Services, Operations, and Finance. The objective of the standup meeting is to
manage the flow of the projects and focus all team members on moving the projects forward
toward on-time deliveries. The meetings concentrate on what needs to be done now, rather than
reporting on the status of the project (which the board already depicts), or dissecting what has
been (or not been) done in the past. Outlined below is the standard agenda for all boards weekly
standup meetings.
 Red/Yellow tag issues
o Issue resolution
o Issue escalation
o New issue identification
 Work progressing to next process step (card advances)
 How to make progress on “Priority” projects
 Amount of Work-in-Progress – only discuss when needed to ensure resources are
assigned appropriately to the highest priority work
 Any new work/projects
 Questions
 Leadership focus the team on top priorities
 Board Calendar review
The standup meetings allow portfolio managers to communicate issues captured on the yellow
and red tags to an audience that includes the right problem solvers that can deploy to the right
problems. The tags include a short description of the issue, the name of the individuals
responsible for solving the issue, and the anticipated completion of required resolution activities.
Discussions on issues are purposely brief, with the focus on updating the team on progress,
11
expected resolution timeframe, or needs for escalation to next management levels. The specific
resolution strategy should be addressed offline and reported on at the next standup meeting (or
sooner if needed).
Figure 9. Weekly Standup Meeting
The weekly standup meeting should normally last 15 to 20 minutes and should never exceed 30
minutes. While the meetings are primarily geared to the production staff, senior leadership
attend to listen and then address the higher level escalated issues that are blocking any projects
progress. The issues should be addressed as rapidly as possible and escalated for resolution to the
highest appropriate level.
Full-Scale Implementation
It was the unanimous opinion of all those involved in the pilot project that implementation of the
Basic Collaboration tool set for the pipeline portfolio of projects had improved communication
and collaboration within and between organizational teams. Because of the inherently long
duration of design and construction projects, it was not possible during the short timeframe of the
pilot test to actually collect metrics to demonstrate that overall project durations were decreasing;
however, early metrics did reinforce team members’ qualitative sense that issues were being
identified and resolved more rapidly and that projects were picking up speed. As such, TRA
elected to proceed with full-scale implementation of the solution, incorporating the plant and
studies portfolios of capital projects. The full scale implementation commenced in May of 2015
and took approximately four weeks.
The structure and format of the pipeline board was moderately refined to suit the plant portfolio
of work. Because the studies portfolio represented an entirely different type of work than the
design/construction work, the studies board took on a structure and format that was oriented
more toward tracking the progression of individual project tasks, versus tracking the project as a
whole. Identical to all three visual portfolio boards, however, was the structure and dynamics of
12
the weekly standup meeting. The target meeting durations for the weekly meetings are 15
minutes for the pipeline portfolio, 15 minutes for the plant portfolio, and 5 minutes for the
studies portfolio. As some proof that these weekly meetings are a sustainable management
structure, and beneficial to the participants, is the fact that TRA has been conducting these
meetings continuously since March 2015. This successful sustainment is due in part to the
discipline that is exercised to keep meeting lengths under the target durations, which compels
meeting participants to maintain involvement. The feedback received is that these meetings offer
a high value for time invested, as a result of the information exchanged and decisive actions
taken.
A new and critical solution component – a master visual board – was added during the full-scale
implementation. While the individual portfolio boards deal with the execution of active work
under contract (or work that is in the contract development stage), the master board aids in
managing the flow of planned work that is approaching the active stage. With the exception of
very small contracts that may be authorized by executive approval, all new contracts for pipeline,
plant, and study projects must be approved by the TRA Board of Directors (BOD). The structure
and format of the master board was designed as a process representation of the BOD calendar. It
includes six vertical columns, one for each of the regularly scheduled bimonthly BOD meetings
in the upcoming 12 month period. The cards queued up on each column represent the projects
scheduled for approval on each BOD agenda.
This master board, referred to as the “Board Calendar,” maintains a hierarchical relationship to
the other portfolio boards as depicted in Figure 10. The top board in this figure is the Board
Calendar. The middle layer depicts the pipeline, plant, and study visual portfolio boards
discussed in this paper. The bottom layer depicts more detailed visual boards pertaining to Land
Rights and GIS groups that were not discussed in this paper. Since all new work requires BOD
approval, a project card must first enter and exit the Board Calendar before it may enter onto one
of the project portfolio boards shown in the middle layer. The Board Calendar acts as a macro
instrument for both Functional Alignment and WIP Control. For example, a project represented
on the pipeline portfolio board that is nearing completion of final design will have a related card
queued up on the Board Calendar for when the construction contract (and related construction
phase engineering services contract) is schedule for BOD approval. P&D managers may adjust
the queue location for the construction contact in response to a changing completion schedule of
the active final design project. Maintaining this synchronization keeps both the Construction
Services and the Finance groups functionally aligned with P&D. Additionally, managers may
use the Board Calendar to exercise WIP control. For example, managers could defer the
construction contract to a later BOD date if the Construction Services group needed to close out
some active work in order to free up some capacity for new work.
13
Figure 10. Visual Board Hierarchy
RESULTS
As a result of the implementation of the Basic Collaboration tool, communication and
collaboration has improved within and between organizational teams. In order to track the
success of these boards, metrics needed to be identified, collected, and analyzed. Because of the
inherently long duration of design and construction projects, it is not yet possible to actually
collect metrics to demonstrate that overall project durations are decreasing; however, early
metrics reinforce team members’ qualitative sense that issues were being identified and resolved
more rapidly and that projects were picking up speed. Various metrics on the visual boards are
collected each week including the following:
 Number of yellow tags
 Number of red tags
 Number of yellow and red tags resolved
 Red tag days without resolution
 Red tag days to resolve
 Number of project card advances
 Number of contracts approved at each Board of Directors meeting
As stated in the name, the Project Execution Maturity Model (PEMM) is a management model
with a built in maturation process as a part of the solution concept. TRA has progressed with the
PEMM approach via an exploratory workshop followed by a pilot project and then full-scale
implementation of the Basic Collaboration solution components. The board metrics represent a
second level of management and functionality of the visual boards over and above the production
value of these tools for keeping projects moving. TRA P&D is in the beginning stages of
14
learning how to gain full value of these metrics for such things as signaling slowing project
velocity or for exposing areas for process improvement. Following are examples of the types of
metrics collected and how they are used.
Figure 11 illustrates the number of project card advances per week for the plant project portfolio,
which is an indication of project velocity. This metric is monitored for early detection of a
decrease in slope which indicates a slower rate of projects advancing to the next process steps.
The curve in this figure indicates projects were stalling during June, but then began moving
again and have be steadily moving ever since. P&D plans to implement solution components at
the Improved Coordination level of the PEMM that are expected to result in a sustained slope
increase of this curve.
Figure 11. Project Velocity – Card Advances per Week, Plant Portfolio
Figure 12 illustrates the number of active issues each week and the number that are resolved each
week. The chart indicates that the team is consistently finding and resolving problems quickly.
During the first four weeks after the visual board was implemented, only 1 problem was
resolved. In January, six were resolved. Note the curves for the number of red and yellow tags
has stayed relatively flat. This is a process diagnostic metric that says team members are
attending to the issues and not letting them fester. It is healthy to see a fair number of yellow
15
tags as long as the red tag count remains low. This indicates that portfolio managers see
potential problems coming and address them before they turn into major (red) problems. A high
red tag count with a low yellow tag count indicates that teams are being surprised by problems.
Figure 12. Issue Tracking, Plant Portfolio
Figure 13 charts the number of new contacts approved at each bimonthly Board of Directors
meeting, which is a direct measure of completion rate of final design projects. Approval of new
construction contracts has increased 19% over the past year, from an average of 2.1 new
contracts per Board of Directors meeting to 2.5 contracts per meeting. According to all
quantitative and qualitative evidence to date, the implemented tools are achieving the
organizational strategic objectives toward excellent customer service and accelerated project
delivery.
16
Figure 13. Number of Construction Contracts Approved at Each Board of Directors
Meeting
NEXT STEPS
TRA is continuously strengthening the data, tools, and practices related to management of the
capital program. A Capital Program Management System (CPMS) software implementation
project is currently underway that will integrate with the solution components presented in this
paper. The visual boards provide a framework for project execution by institutionalizing the
processes and behaviors for completing tasks and moving projects forward. While this is
extremely valuable, a higher resolution, and more comprehensive operating infrastructure is
required to provide the functionality for managing the more detailed and complex elements of
planning and executing capital projects and for advancing to higher levels of the Project
Execution Maturity Model. Figure 14 depicts how the visual boards fit into the overall solution
scheme for capital program management at TRA.
17
Figure 14. Capital Program Management System
Integrating the CPMS with the visual boards is one means by which TRA plans to mature up to
the Improved Coordination level of the PEMM (Figure 15). Conventional scheduling tools in
the CPMS will be utilized to track project milestones and deliverables, which address both the
Date Management and Delivery Promising building blocks of the PEMM.
Figure 16 illustrate another concept for Date Management and Delivery Promising maturation.
With regard to schedule, the visual boards do indeed depict the proper sequence of work and
they do aid in removing constraints to insure that work is progressing towards completion. The
CPMS will be configured to utilize the same process framework, and will enhance the visual
boards by tracking the duration of time project cards spend in each process step (i.e., each board
column) against the target duration per the planned schedule. So while the boards provide
signals regarding project card movement, the CPMS adds the ability to know whether movement
is at the proper pace. Additionally, Figure 16 also illustrates that the CPMS will house the detail
checklist of requirements for advancing from column to column on the visual board. Since card
moves are only made publicly in the weekly standup meetings, it will be easy to capture when
moves are attempted that are not in compliance with the checklists. This control protects against
a project advancing to latter stages of the process without satisfying all requirements of prior
steps, which almost always results in costly rework.
18
Figure 15. Project Execution Maturity Model and CPMS
Figure 16. Process Step Durations and Checklists
Another Improved Coordination measure that is planned is Remote Collaboration. PEMM
solution implementation efforts to date have almost entirely involved staff that reside at the same
geographic office location. It will be necessary to introduce some new technology to allow
remote parties to utilize the visual boards and participate in the weekly standup meetings. One
Remote Collaboration solution is to maintain the physical boards at their current location and
19
utilize video conferencing for remote parties to see the boards and for meeting participants to see
one another. A more sophisticated solution is to migrate the physical boards to electronic
format, utilizing either off-the-shelf Kanban software or specialized software that has been
designed around the PEMM. The migration to an electronic solution affords the organization
some additional management capability. For one, the electronic visual board solution does not
have the same capacity constraints as the physical boards in terms of total projects in the
portfolio. At some point, adding more projects to the physical boards triggers either an increase
in the physical board space, or a redesign of either the structure or format of the board.
Secondly, the electronic solutions may be programmed to perform operations on the board
contents, such as tracking the yellow/red issues or calculating schedule metrics, etc.
Finally, TRA is evaluating the implementation of a new visual board focused entirely on the
construction phase of work. Currently, the construction phase is accommodated by a single,
extra wide column on the pipeline and plant visual boards. Constructing a board dedicated solely
to construction would provide increased resolution into the process steps involved in that phase,
allow for a more tailored structure and format for tracking completion of construction tasks, and
increase communication and collaboration by extending this solution to the construction
inspection layer of the organization.
SUMMARY AND CONCLUSIONS
The TRA Northern Region Planning & Development (P&D) group is involved in an ongoing
effort to strengthen the data, tools, and practices related to managing the capital program. One
such effort involved maturing the processes and behaviors necessary for accelerating project
delivery. P&D systematically implemented a Basic Collaboration tool set as the foundational
element of a Project Execution Maturity Model (PEMM). The implementation involved an
exploratory workshop, a pilot project, and a full-scale implementation effort for the entire
Northern Region capital project portfolio.
The PEMM proved to be a novel and practical methodology that treats execution behaviors as
the leverage point and prerequisite to on time and on budget project performance. A central
component of the PEMM solution was the Visual Portfolio Board, which is a simple, rapidly
deployed, low-tech tool that enables all involved parties to easily “see” the entire portfolio of
work and to better understand current relationships and issues impacting project velocity. The
visual board is being utilized effectively by the P&D engineering staff to rapidly identify and
resolve issues as they occur, with rapid escalation of issues to higher levels of the organization
when required. Weekly 15-minute standup meetings in front of the visual boards have
effectively ingrained new execution behaviors that positively impact schedule success. These
meetings are attended by all TRA departments involved in the capital projects and provide
timely, actionable information that draws attention and collaborative resources to the issues at
hand.
The visual board is organized to depict the entire workload of the Capital Improvement Program
(CIP) as well as individual project progress, including the collection and reporting of metrics for
tracking overall project execution performance. The boards also aid upper management in
20
communicating project priorities, funding schedules and managing the work in progress. The
following are some of the benefits that have been realized thus far from use of the visual boards:
 accomplished immediate changes in processes and behaviors for executing work
 improved team flow by providing a consistent format for depicting reality
 provided a pathway to rapidly escalate issues impacting project velocity
 provided a persistently visible structure onto which rules, policies and actions could be
implemented
The early visual board metrics indicate that issues threatening project velocity are being
identified and resolved more rapidly and that projects are picking up speed. Approval of new
construction contracts has increased 19% over the past year, from an average of 2.1 new
contracts per Board of Directors meeting to 2.5 contracts per meeting. The feedback from all
those involved is that implementation of the Basic Collaboration tool set has improved
communication and collaboration within and between organizational teams. According to all
quantitative and qualitative evidence to date, the implemented tools are achieving the
organizational strategic objectives toward excellent customer service and accelerated project
delivery.
TRA is proceeding with efforts to implement Improved Coordination solution components,
which are at the next maturity level of the PEMM. Scheduling and project milestone tools will
be configured as a part of a Capital Program Management System (CPMS) software
implementation and will integrate with the Basic Collaboration tool sets already in place. It is
anticipated that additional future enhancements to the capital management solution set will
include remote collaboration and an expanded visual board for construction.
ACKNOWLEDGEMENT
TRA would like to acknowledge Pinnacle Strategies, Inc. for their contribution to this
project. Their professional insights and guidance to TRA staff have been invaluable in making
major progress toward our goal of excellent customer service through accelerated project
delivery.
TRA staff would like to acknowledge Patricia M. Cleveland, Assistant Regional
Manager/Planning and Development, Northern Region, for her leadership in building a stronger
capital management program. Her vision for developing in staff the strong foundation of healthy
collaboration and communication provided excellent preparation for taking full advantage of
external expertise and new approaches for successful project execution.

Trinity_Case-Study

  • 1.
    TEXAS WATER 2016 MANAGINGA BILLION-PLUS DOLLAR CIP PROGRAM FOR A WHOLESALE TEXAS WATER UTILITY Marco A. Ramirez, P.E. Co-Author Ronald K. Tamada, P.E. Co-Author Kenneth G. Lawrence, P.E., IT Nexus, Inc. Trinity River Authority of Texas P.O. Box 240 Arlington, Texas 76004-0240 BACKGROUND The Trinity River Authority of Texas (TRA) was created by the Texas legislature in 1955 and is responsible for maintaining a master plan for basin-wide development, serves as local sponsor for federal water projects, and provide services authorized by the Texas Legislature within TRA’s territory. TRA’s mission is to promote conservation, reclamation, protection and development of the natural resources in the Trinity River basin for the benefit of the public. Management teams, divided into a Northern Region and a Southern Region, are responsible for operating TRA's existing facilities and for developing new ones as appropriate. The general manager serves as the chief executive officer of TRA and the management levels listed below support the board of directors, the general manager, and the Northern and Southern Region offices in pursuit of their responsibilities. Northern Region – Responsible for the development of revenue-oriented projects in the northern portion of TRA’s service area, the operation and maintenance of existing facilities, the sale of water from existing reservoirs, and acting as liaison between TRA and its customers and/or the federal government. Southern Region – Responsible for the development of revenue-oriented projects in the southern portion of TRA’s service area, the operation and maintenance of existing facilities, the sale of water from existing reservoirs, and acting as liaison between TRA and its customers and/or the federal government. Financial Services – Responsible for the performance of financial services to all components of TRA's management organization. Legal Services – Responsible for providing legal support within the management organization, including land rights issues. General Services – Responsible for managing personnel, information technology, risk management, safety and office administration.
  • 2.
    2 Planning and EnvironmentalServices – PES provides technical assistance to the Authority through the implementation/management of geographic information systems (GIS) and environmental services. Through GIS, PES provides enterprise-wide support allowing Authority staff to view spatially-referenced assets and information with integrated databases. Environmental Services staff provide support through model development, studies, sampling efforts, research, representation with state and local officials, and by administering the Trinity Basin Clean Rivers Program. Construction Services – Responsible for construction-related support activities including review of plans and specifications, bids, contract administration and acting as liaison with land rights staff and regional offices. Figure 1. TRA Management Structure PROBLEM STATEMENT This paper focuses on the planning and execution of water and wastewater capital improvement projects for the Northern Region, which is the responsibility of the Planning and Development Group (P&D). TRA currently provides wholesale drinking water and wastewater services to customer cities through multi-contracting party agreements. TRA owns and operates in the Northern Region service area five regional wastewater treatment systems and one regional water
  • 3.
    3 Service Area Trinity River Basin treatmentand supply facility. The capital infrastructures of the Northern Region operating systems are depicted in Figure 2. P&D manages the design and construction phase engineering for pipeline and plant projects, including services related to regulatory compliance. P&D is also responsible for the development and maintenance of a five-year Capital Improvements Program (CIP), which is updated semi-annually in response to the changing needs of the six wholesale water and wastewater systems operating in the Northern Region. Figure 2. TRA Northern Region Operating Systems TRA has seen its capital infrastructure grow significantly over the years, and with this growth has come an ever increasing number of new capital improvement projects and increasing frequency of capital bond sales to fund them. In 2002 the Northern Region was managing design and construction contracts totaling $61 million. In 2005 this amount had grown to $142 million. Currently, Northern Region has $396 million in design and construction projects under contract. Projected capital expenditures for design and construction in the current five-year CIP is just under one billion dollars. With the rapid growth of TRA’s capital program came an increased complexity of management. TRA began experiencing extended durations of design and construction projects as it became more challenging to manage all the moving parts of a large and highly dynamic portfolio of work. Recognizing that there was a schedule management problem, TRA identified several causative factors including: resolving issues in a timely manner; communication and handoffs
  • 4.
    4 between internal groups;priorities not well defined for focus of team resources; extended internal reviews of interim design documents; missed deadlines in the projects resulting in rework; closing out projects; assessing team workload capacity for introduction of new work; and the effect that schedule overruns on active projects had on funding schedules for new work. SOLUTION DEVELOPMENT The challenges that had been identified with delivering capital projects on budget and on schedule were taken into consideration when TRA developed its five-year strategic plan in 2013. The Strategic Plan reflected TRA’s core values, which include the integrity in all things, excellence in service and performance, accountability to the public, customers and to each other, and teamwork and professionalism. The TRA leadership outlined seven goals and objectives for the organization in the Strategic Plan: 1. Engage Board of Directors involvement, facilitate Board understanding of the operations, and improve Board information and support. 2. Maintain Customer Service Excellence by promoting financial transparency, maintain technical leadership, partner with customer cities, and accelerate project completion. 3. New Business Growth; ensure continuous service quality, expand and diversify services, and optimize real estate income opportunities. 4. Robust Community Partnerships by raising positive public awareness, support water conversation and education programs, and solidify key stakeholder partnerships. 5. Efficient and Effective Operations; Strengthen Human Resources support, upgrade financial processes, leverage information technology, improve procurement processes, and faster, better, cost-effective service delivery. 6. Human Capital Development; Competent, adaptable workforce, orderly management succession, and attract, recruit and retain talent. 7. Effective Corporate Communication by promoting an identifiable brand, building internal awareness, and proactively engaging the media. Among the detailed operating objectives and strategies that were defined to accomplish the above goals was the following strategy for maintaining customer service excellence (Strategic Goal No. 2): Develop and document a standardized set of project planning and management processes and tools to drive accuracy, consistency, and timeliness and provide associated training. This organizational strategy was the driver for the TRA Northern Region P&D group to undertake efforts to strengthen the data, tools, and practices related to the capital program. One such effort, which is the primary focus of this paper, involved retaining the services of a project execution expert to assist the organization in maturing processes and behaviors necessary for accelerating project delivery. P&D set out to explore the adoption of a Project Execution Maturity Model (PEMM) as the fundamental framework for improving capital project planning and execution.
  • 5.
    5 The PEMM provedto be a novel and practical methodology that treats execution behaviors as the leverage point and prerequisite to on time and on budget project performance. This was a notable departure from previous, more conventional management approaches that put most of the emphasis on project planning. The PEMM assesses three levels of execution capability: Basic Collaboration, Improved Coordination, and Integrated Planning and Execution. Figure 3 depicts twelve building blocks for improving execution capability within these three levels. This paper describes TRA’s experience systematically implementing the foundational building blocks for Basic Collaboration. The implementation involved an exploratory workshop, a pilot project, and a full-scale implementation effort. Figure 3. Project Execution Maturity Model Exploratory Workshop In January of 2015, a three-day workshop was conducted to introduce key personnel from TRA’s Planning & Development, Land Rights, Legal, and Construction Services groups to the fundamental PEMM concepts. Workshop participants took part in several exercises that reinforced key process management principles and that helped the teams understand how the principles could be applied to improve their execution of capital projects. On the last day of the workshop, teams mapped out the steps that reflect the current processes in place at TRA for preliminary and final design phases of a capital project, including the steps pertaining to easement acquisition. The ultimate deliverables from the workshop included 1) a refined version of the business process map that was drafted by workshop participants, and 2) recommendations as to how TRA might proceed with a pilot project to implement PEMM project execution tools on a subset of their capital projects portfolio.
  • 6.
    6 Figure 4. DraftProcess Maps Figure 5. Final Process Map Pilot Project TRA P&D organizes its capital program into three portfolios of projects: pipeline, plant, and studies. Based upon the success of the three-day workshop, TRA elected to proceed with implementation of the Basic Collaboration tools for the portfolio of pipeline projects. The goal of Basic Collaboration is project velocity, or flow, where the focus is upon completion of tasks and shortening project durations. The pipeline portfolio was selected for the pilot project for two
  • 7.
    7 reasons. First, pipelineprojects tend to exhibit less process variability than plant projects, making them a slightly easier test case. Second, pipeline projects, unlike plant projects, require extensive coordination between P&D and the Land Rights and Legal group. And, it was important that the pilot test confirm that the Basic Collaboration tools did indeed provide solutions for the challenges that had been previously identified regarding coordination between internal groups. The pilot project was initiated in March of 2015 and took three weeks to complete. Week 1 involved validating and refining the process map to fully represent projects in the pipeline portfolio. Based on the validated process map, a determination was made regarding the appropriate structure and format for implementation of a “Visual Portfolio Board.” The visual board was a solution concept that was introduced in the three-day workshop. Various structures and formats of visual boards were presented during the workshop to demonstrate the concepts involved in achieving the best application of the Project Execution Maturity Model to a particular organization and process. It was determined that the structure and format that is most applicable for TRA’s capital program is essentially that of a large-scale, interactive swim lane diagram. Figure 6 illustrates the prototype visual board for TRA’s pipeline portfolio. One horizontal swim lane is designated for each portfolio manager where, ultimately, all of that manager’s projects will be represented within their respective lanes. The vertical columns generally match the steps listed horizontally across the top of the process map shown in Figure 5. Part of the piloting effort involved how to translate and consolidate the horizontal elements from the process map to vertical columns on the visual board to reflect the logical sequence between key decision points for project progress. Figure 6. Initial Visual Portfolio Board Structure and Format Figure 7 illustrates the initial version of the Pipeline Board that was in place by the end of the first week of the pilot. Each 3x5 index card on the board represents an active project in each manager’s portfolio. At this stage of development, there are approximately 57 projects represented on the Pipeline Board. Written on each card is some fundamental project identification information, and the color of each card indicates the regional operating system to
  • 8.
    8 which the projectpertains. One of the most fundamental objectives of the visual board is to rapidly communicate where the work is in the system. With little more than a glance at the Pipeline Board, one is apprised of the status of a project (via the card’s position from left to right on the Board), to which operating system the project pertains (via the color), and who is managing the project (via the swim lane in which it is located). Figure 7. Early Version of Pipeline Visual Board While the information cited above may sound elementary, the fact that all groups involved agree on this objective representation of where a project is in the system sets the stage for the first PEMM building block referred to as “Functional Alignment.” For starters, the board column headings themselves signify that these process steps have been officially adopted by the organization. Rather than the official process being documented and buried somewhere in a guidance or procedures manual, its persistent visibility on the visual board helps maintain alignment among all parties as to the proper sequence of process steps to be executed. The left- to-right position of a project card on the board self-reports the project status. Other groups in the organization that either receive a hand-off from P&D or become engaged in the project at a particular milestone are able to anticipate their involvement stage as individual project cards progress from left to right on the board over a period of time. This simple depiction of the portfolio of work was surprisingly informative to those not directly involved in the day-to-day aspects of these projects. For purposes of this paper, the organizational hierarchy of P&D may be thought of as P&D Manager (a.k.a. Portfolio Manager) → P&D Group Leader → P&D Sr. Manager → Northern Region (NR) Manager. The visual boards allow all management levels, as well as other groups peripheral to P&D, to quickly assess the fundamental status of all projects in the capital program. This includes, as the next section will explain, the status of any issues that may be impacting project progress.
  • 9.
    9 Collaborative Execution isthe second of the four building blocks that was addressed in the Basic Collaboration level of the PEMM. Collaboration is required during project execution to address issues that arise that may impact project velocity. Issues that cause the velocity to decrease, or that cause the project to stop altogether, must be rapidly identified and resolved for the project to stay on schedule. Yellow tags are affixed to project cards to signify that a minor issue has arisen that may threaten project velocity. Red tags are affixed to signify major issues that have caused the project to stop, or that require escalation above the portfolio manager’s level to resolve expediently. A log is kept of red tag issues to document owners of, and actions on, the issues and to track time to resolve. Additional discussion on the use of these tags is provided in subsequent paragraphs that describe the weekly standup meetings. Priority Control is the third PEMM building block and refers to the means by which management clearly defines the priorities for focus of team resources. By physically placing priority buttons on project cards, the P&D Sr. Manager indicates the top three most important projects out of all projects in the pipeline portfolio of work. Additionally, the NR Manager may place one priority button on the board. These buttons, once placed, typically remain set for weeks at a time; however, under highly dynamic conditions they may be moved to different projects on a weekly basis to keep the team informed of shifting demands. The priority buttons direct the teams’ efforts to get the most important work done first, and help reduce multi-tasking. And, having only four priority buttons for the entire board protects portfolio managers from getting the blanket message from next management levels that “everything is a priority,” which of course is impractical. Controlling Work in Process (WIP) was the final building block implemented at the PEMM Basic Collaboration level. The P&D group, like every production team, has a finite production capacity. Various board metrics are tracked that indicate the rate at which work is progressing as well as the number of active issues and rate of issue resolution. These metrics provide another tool for the P&D Sr. Manager’s use in determining the timing and quantity of new work to release into the system. The project cards in each manager’s portfolio, or on the entire board, may be thought of as cars on the highway (Figure 8), travelling at some velocity from start to finish. Due to the limited capacity of the highway, there comes a point at which adding more cars to the highway slows down all cars on the highway. For a work portfolio that is already overloaded, proper WIP control will almost always result in freeing up capacity and increased speed. A well-managed WIP also reduces multi-tasking, which results in smoother flow and shorter project durations.
  • 10.
    10 Figure 8. ControllingWork in Process Basic Collaboration is exhibited in full form during weekly standup meetings that are led by the P&D Group Leaders. These meetings are conducted in front of the visual board and include representation from all groups involved in capital projects: P&D, Land Rights, Legal, Construction Services, Operations, and Finance. The objective of the standup meeting is to manage the flow of the projects and focus all team members on moving the projects forward toward on-time deliveries. The meetings concentrate on what needs to be done now, rather than reporting on the status of the project (which the board already depicts), or dissecting what has been (or not been) done in the past. Outlined below is the standard agenda for all boards weekly standup meetings.  Red/Yellow tag issues o Issue resolution o Issue escalation o New issue identification  Work progressing to next process step (card advances)  How to make progress on “Priority” projects  Amount of Work-in-Progress – only discuss when needed to ensure resources are assigned appropriately to the highest priority work  Any new work/projects  Questions  Leadership focus the team on top priorities  Board Calendar review The standup meetings allow portfolio managers to communicate issues captured on the yellow and red tags to an audience that includes the right problem solvers that can deploy to the right problems. The tags include a short description of the issue, the name of the individuals responsible for solving the issue, and the anticipated completion of required resolution activities. Discussions on issues are purposely brief, with the focus on updating the team on progress,
  • 11.
    11 expected resolution timeframe,or needs for escalation to next management levels. The specific resolution strategy should be addressed offline and reported on at the next standup meeting (or sooner if needed). Figure 9. Weekly Standup Meeting The weekly standup meeting should normally last 15 to 20 minutes and should never exceed 30 minutes. While the meetings are primarily geared to the production staff, senior leadership attend to listen and then address the higher level escalated issues that are blocking any projects progress. The issues should be addressed as rapidly as possible and escalated for resolution to the highest appropriate level. Full-Scale Implementation It was the unanimous opinion of all those involved in the pilot project that implementation of the Basic Collaboration tool set for the pipeline portfolio of projects had improved communication and collaboration within and between organizational teams. Because of the inherently long duration of design and construction projects, it was not possible during the short timeframe of the pilot test to actually collect metrics to demonstrate that overall project durations were decreasing; however, early metrics did reinforce team members’ qualitative sense that issues were being identified and resolved more rapidly and that projects were picking up speed. As such, TRA elected to proceed with full-scale implementation of the solution, incorporating the plant and studies portfolios of capital projects. The full scale implementation commenced in May of 2015 and took approximately four weeks. The structure and format of the pipeline board was moderately refined to suit the plant portfolio of work. Because the studies portfolio represented an entirely different type of work than the design/construction work, the studies board took on a structure and format that was oriented more toward tracking the progression of individual project tasks, versus tracking the project as a whole. Identical to all three visual portfolio boards, however, was the structure and dynamics of
  • 12.
    12 the weekly standupmeeting. The target meeting durations for the weekly meetings are 15 minutes for the pipeline portfolio, 15 minutes for the plant portfolio, and 5 minutes for the studies portfolio. As some proof that these weekly meetings are a sustainable management structure, and beneficial to the participants, is the fact that TRA has been conducting these meetings continuously since March 2015. This successful sustainment is due in part to the discipline that is exercised to keep meeting lengths under the target durations, which compels meeting participants to maintain involvement. The feedback received is that these meetings offer a high value for time invested, as a result of the information exchanged and decisive actions taken. A new and critical solution component – a master visual board – was added during the full-scale implementation. While the individual portfolio boards deal with the execution of active work under contract (or work that is in the contract development stage), the master board aids in managing the flow of planned work that is approaching the active stage. With the exception of very small contracts that may be authorized by executive approval, all new contracts for pipeline, plant, and study projects must be approved by the TRA Board of Directors (BOD). The structure and format of the master board was designed as a process representation of the BOD calendar. It includes six vertical columns, one for each of the regularly scheduled bimonthly BOD meetings in the upcoming 12 month period. The cards queued up on each column represent the projects scheduled for approval on each BOD agenda. This master board, referred to as the “Board Calendar,” maintains a hierarchical relationship to the other portfolio boards as depicted in Figure 10. The top board in this figure is the Board Calendar. The middle layer depicts the pipeline, plant, and study visual portfolio boards discussed in this paper. The bottom layer depicts more detailed visual boards pertaining to Land Rights and GIS groups that were not discussed in this paper. Since all new work requires BOD approval, a project card must first enter and exit the Board Calendar before it may enter onto one of the project portfolio boards shown in the middle layer. The Board Calendar acts as a macro instrument for both Functional Alignment and WIP Control. For example, a project represented on the pipeline portfolio board that is nearing completion of final design will have a related card queued up on the Board Calendar for when the construction contract (and related construction phase engineering services contract) is schedule for BOD approval. P&D managers may adjust the queue location for the construction contact in response to a changing completion schedule of the active final design project. Maintaining this synchronization keeps both the Construction Services and the Finance groups functionally aligned with P&D. Additionally, managers may use the Board Calendar to exercise WIP control. For example, managers could defer the construction contract to a later BOD date if the Construction Services group needed to close out some active work in order to free up some capacity for new work.
  • 13.
    13 Figure 10. VisualBoard Hierarchy RESULTS As a result of the implementation of the Basic Collaboration tool, communication and collaboration has improved within and between organizational teams. In order to track the success of these boards, metrics needed to be identified, collected, and analyzed. Because of the inherently long duration of design and construction projects, it is not yet possible to actually collect metrics to demonstrate that overall project durations are decreasing; however, early metrics reinforce team members’ qualitative sense that issues were being identified and resolved more rapidly and that projects were picking up speed. Various metrics on the visual boards are collected each week including the following:  Number of yellow tags  Number of red tags  Number of yellow and red tags resolved  Red tag days without resolution  Red tag days to resolve  Number of project card advances  Number of contracts approved at each Board of Directors meeting As stated in the name, the Project Execution Maturity Model (PEMM) is a management model with a built in maturation process as a part of the solution concept. TRA has progressed with the PEMM approach via an exploratory workshop followed by a pilot project and then full-scale implementation of the Basic Collaboration solution components. The board metrics represent a second level of management and functionality of the visual boards over and above the production value of these tools for keeping projects moving. TRA P&D is in the beginning stages of
  • 14.
    14 learning how togain full value of these metrics for such things as signaling slowing project velocity or for exposing areas for process improvement. Following are examples of the types of metrics collected and how they are used. Figure 11 illustrates the number of project card advances per week for the plant project portfolio, which is an indication of project velocity. This metric is monitored for early detection of a decrease in slope which indicates a slower rate of projects advancing to the next process steps. The curve in this figure indicates projects were stalling during June, but then began moving again and have be steadily moving ever since. P&D plans to implement solution components at the Improved Coordination level of the PEMM that are expected to result in a sustained slope increase of this curve. Figure 11. Project Velocity – Card Advances per Week, Plant Portfolio Figure 12 illustrates the number of active issues each week and the number that are resolved each week. The chart indicates that the team is consistently finding and resolving problems quickly. During the first four weeks after the visual board was implemented, only 1 problem was resolved. In January, six were resolved. Note the curves for the number of red and yellow tags has stayed relatively flat. This is a process diagnostic metric that says team members are attending to the issues and not letting them fester. It is healthy to see a fair number of yellow
  • 15.
    15 tags as longas the red tag count remains low. This indicates that portfolio managers see potential problems coming and address them before they turn into major (red) problems. A high red tag count with a low yellow tag count indicates that teams are being surprised by problems. Figure 12. Issue Tracking, Plant Portfolio Figure 13 charts the number of new contacts approved at each bimonthly Board of Directors meeting, which is a direct measure of completion rate of final design projects. Approval of new construction contracts has increased 19% over the past year, from an average of 2.1 new contracts per Board of Directors meeting to 2.5 contracts per meeting. According to all quantitative and qualitative evidence to date, the implemented tools are achieving the organizational strategic objectives toward excellent customer service and accelerated project delivery.
  • 16.
    16 Figure 13. Numberof Construction Contracts Approved at Each Board of Directors Meeting NEXT STEPS TRA is continuously strengthening the data, tools, and practices related to management of the capital program. A Capital Program Management System (CPMS) software implementation project is currently underway that will integrate with the solution components presented in this paper. The visual boards provide a framework for project execution by institutionalizing the processes and behaviors for completing tasks and moving projects forward. While this is extremely valuable, a higher resolution, and more comprehensive operating infrastructure is required to provide the functionality for managing the more detailed and complex elements of planning and executing capital projects and for advancing to higher levels of the Project Execution Maturity Model. Figure 14 depicts how the visual boards fit into the overall solution scheme for capital program management at TRA.
  • 17.
    17 Figure 14. CapitalProgram Management System Integrating the CPMS with the visual boards is one means by which TRA plans to mature up to the Improved Coordination level of the PEMM (Figure 15). Conventional scheduling tools in the CPMS will be utilized to track project milestones and deliverables, which address both the Date Management and Delivery Promising building blocks of the PEMM. Figure 16 illustrate another concept for Date Management and Delivery Promising maturation. With regard to schedule, the visual boards do indeed depict the proper sequence of work and they do aid in removing constraints to insure that work is progressing towards completion. The CPMS will be configured to utilize the same process framework, and will enhance the visual boards by tracking the duration of time project cards spend in each process step (i.e., each board column) against the target duration per the planned schedule. So while the boards provide signals regarding project card movement, the CPMS adds the ability to know whether movement is at the proper pace. Additionally, Figure 16 also illustrates that the CPMS will house the detail checklist of requirements for advancing from column to column on the visual board. Since card moves are only made publicly in the weekly standup meetings, it will be easy to capture when moves are attempted that are not in compliance with the checklists. This control protects against a project advancing to latter stages of the process without satisfying all requirements of prior steps, which almost always results in costly rework.
  • 18.
    18 Figure 15. ProjectExecution Maturity Model and CPMS Figure 16. Process Step Durations and Checklists Another Improved Coordination measure that is planned is Remote Collaboration. PEMM solution implementation efforts to date have almost entirely involved staff that reside at the same geographic office location. It will be necessary to introduce some new technology to allow remote parties to utilize the visual boards and participate in the weekly standup meetings. One Remote Collaboration solution is to maintain the physical boards at their current location and
  • 19.
    19 utilize video conferencingfor remote parties to see the boards and for meeting participants to see one another. A more sophisticated solution is to migrate the physical boards to electronic format, utilizing either off-the-shelf Kanban software or specialized software that has been designed around the PEMM. The migration to an electronic solution affords the organization some additional management capability. For one, the electronic visual board solution does not have the same capacity constraints as the physical boards in terms of total projects in the portfolio. At some point, adding more projects to the physical boards triggers either an increase in the physical board space, or a redesign of either the structure or format of the board. Secondly, the electronic solutions may be programmed to perform operations on the board contents, such as tracking the yellow/red issues or calculating schedule metrics, etc. Finally, TRA is evaluating the implementation of a new visual board focused entirely on the construction phase of work. Currently, the construction phase is accommodated by a single, extra wide column on the pipeline and plant visual boards. Constructing a board dedicated solely to construction would provide increased resolution into the process steps involved in that phase, allow for a more tailored structure and format for tracking completion of construction tasks, and increase communication and collaboration by extending this solution to the construction inspection layer of the organization. SUMMARY AND CONCLUSIONS The TRA Northern Region Planning & Development (P&D) group is involved in an ongoing effort to strengthen the data, tools, and practices related to managing the capital program. One such effort involved maturing the processes and behaviors necessary for accelerating project delivery. P&D systematically implemented a Basic Collaboration tool set as the foundational element of a Project Execution Maturity Model (PEMM). The implementation involved an exploratory workshop, a pilot project, and a full-scale implementation effort for the entire Northern Region capital project portfolio. The PEMM proved to be a novel and practical methodology that treats execution behaviors as the leverage point and prerequisite to on time and on budget project performance. A central component of the PEMM solution was the Visual Portfolio Board, which is a simple, rapidly deployed, low-tech tool that enables all involved parties to easily “see” the entire portfolio of work and to better understand current relationships and issues impacting project velocity. The visual board is being utilized effectively by the P&D engineering staff to rapidly identify and resolve issues as they occur, with rapid escalation of issues to higher levels of the organization when required. Weekly 15-minute standup meetings in front of the visual boards have effectively ingrained new execution behaviors that positively impact schedule success. These meetings are attended by all TRA departments involved in the capital projects and provide timely, actionable information that draws attention and collaborative resources to the issues at hand. The visual board is organized to depict the entire workload of the Capital Improvement Program (CIP) as well as individual project progress, including the collection and reporting of metrics for tracking overall project execution performance. The boards also aid upper management in
  • 20.
    20 communicating project priorities,funding schedules and managing the work in progress. The following are some of the benefits that have been realized thus far from use of the visual boards:  accomplished immediate changes in processes and behaviors for executing work  improved team flow by providing a consistent format for depicting reality  provided a pathway to rapidly escalate issues impacting project velocity  provided a persistently visible structure onto which rules, policies and actions could be implemented The early visual board metrics indicate that issues threatening project velocity are being identified and resolved more rapidly and that projects are picking up speed. Approval of new construction contracts has increased 19% over the past year, from an average of 2.1 new contracts per Board of Directors meeting to 2.5 contracts per meeting. The feedback from all those involved is that implementation of the Basic Collaboration tool set has improved communication and collaboration within and between organizational teams. According to all quantitative and qualitative evidence to date, the implemented tools are achieving the organizational strategic objectives toward excellent customer service and accelerated project delivery. TRA is proceeding with efforts to implement Improved Coordination solution components, which are at the next maturity level of the PEMM. Scheduling and project milestone tools will be configured as a part of a Capital Program Management System (CPMS) software implementation and will integrate with the Basic Collaboration tool sets already in place. It is anticipated that additional future enhancements to the capital management solution set will include remote collaboration and an expanded visual board for construction. ACKNOWLEDGEMENT TRA would like to acknowledge Pinnacle Strategies, Inc. for their contribution to this project. Their professional insights and guidance to TRA staff have been invaluable in making major progress toward our goal of excellent customer service through accelerated project delivery. TRA staff would like to acknowledge Patricia M. Cleveland, Assistant Regional Manager/Planning and Development, Northern Region, for her leadership in building a stronger capital management program. Her vision for developing in staff the strong foundation of healthy collaboration and communication provided excellent preparation for taking full advantage of external expertise and new approaches for successful project execution.