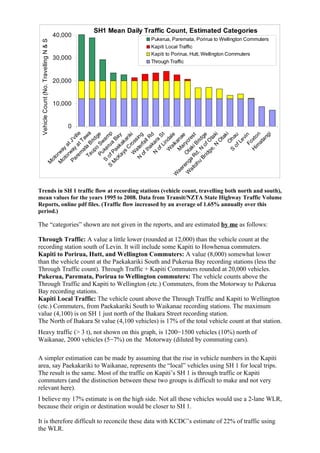
SH1 Mean Daily Traffic Count, Estimated Categories
                                        40,000
                                                                  Pukerua, Paremata, Porirua to Wellington Commuters
 Vehicle Count (No. Travelling N & S)                             Kapiti Local Traffic
                                                                  Kapiti to Porirua, Hutt, Wellington Commuters
                                        30,000
                                                                  Through Traffic


                                        20,000


                                        10,000


                                            0
                               Ta ta B wa
                               re at ille


                         S of rua p


                                                 gi
                                           O i


                                          at n
                                                   i
                                Pu Sw e


                                                  t
                              N ate ing

                                                 d


                                       a i le


                                 id o f O e
                                  W ros i


                                         Fo in
                                       of u
                                ay kak y


                          hu d, Bri t


                                      , N tak
                                       ar e


                                                 k
                                      C arik


                                     of a S
                                    ke am


                      ai a R k es


                                     H xto
                                                g


                                     N dg
                                    Ih ll R


                                    S ha
                             cK e Ba


                                              ta


                                             an
                                    M ana
                                    W nda


                                               v
                                    a Ta
                            Pa way J'v


                                   up rid


                                             s


                                            Le
                    W ng Ota ycr


                                            O
                                  N kar
                                 of rfa


                                          k
                                          t


                                        Li


                                      im
                               or y a


                                       i
                                      a
                                      o


                                   ge
                           M Pa
                           M rwa


                                    s
                                  m
                               o


                              Br
                             ot
                             ot


                            S
                           M


                        to
                       re
                     ae
                    W


Trends in SH 1 traffic flow at recording stations (vehicle count, travelling both north and south),
mean values for the years 1995 to 2008. Data from Transit/NZTA State Highway Traffic Volume
Reports, online pdf files. (Traffic flow increased by an average of 1.65% annually over this
period.)

The “categories” shown are not given in the reports, and are estimated by me as follows:

Through Traffic: A value a little lower (rounded at 12,000) than the vehicle count at the
recording station south of Levin. It will include some Kapiti to Howhenua commuters.
Kapiti to Porirua, Hutt, and Wellington Commuters: A value (8,000) somewhat lower
than the vehicle count at the Paekakariki South and Pukerua Bay recording stations (less the
Through Traffic count). Through Traffic + Kapiti Commuters rounded at 20,000 vehicles.
Pukerua, Paremata, Porirua to Wellington commuters: The vehicle counts above the
Through Traffic and Kapiti to Wellington (etc.) Commuters, from the Motorway to Pukerua
Bay recording stations.
Kapiti Local Traffic: The vehicle count above the Through Traffic and Kapiti to Wellington
(etc.) Commuters, from Paekakariki South to Waikanae recording stations. The maximum
value (4,100) is on SH 1 just north of the Ihakara Street recording station.
The North of Ihakara St value (4,100 vehicles) is 17% of the total vehicle count at that station.
Heavy traffic (> 3 t), not shown on this graph, is 1200−1500 vehicles (10%) north of
Waikanae, 2000 vehicles (5−7%) on the Motorway (diluted by commuting cars).

A simpler estimation can be made by assuming that the rise in vehicle numbers in the Kapiti
area, say Paekakariki to Waikanae, represents the “local” vehicles using SH 1 for local trips.
The result is the same. Most of the traffic on Kapiti’s SH 1 is through traffic or Kapiti
commuters (and the distinction between these two groups is difficult to make and not very
relevant here).
I believe my 17% estimate is on the high side. Not all these vehicles would use a 2-lane WLR,
because their origin or destination would be closer to SH 1.

It is therefore difficult to reconcile these data with KCDC’s estimate of 22% of traffic using
the WLR.

Trend In Sh 1 Traffic Flow3rd Option

  • 1.
    SH1 Mean DailyTraffic Count, Estimated Categories 40,000 Pukerua, Paremata, Porirua to Wellington Commuters Vehicle Count (No. Travelling N & S) Kapiti Local Traffic Kapiti to Porirua, Hutt, Wellington Commuters 30,000 Through Traffic 20,000 10,000 0 Ta ta B wa re at ille S of rua p gi O i at n i Pu Sw e t N ate ing d a i le id o f O e W ros i Fo in of u ay kak y hu d, Bri t , N tak ar e k C arik of a S ke am ai a R k es H xto g N dg Ih ll R S ha cK e Ba ta an M ana W nda v a Ta Pa way J'v up rid s Le W ng Ota ycr O N kar of rfa k t Li im or y a i a o ge M Pa M rwa s m o Br ot ot S M to re ae W Trends in SH 1 traffic flow at recording stations (vehicle count, travelling both north and south), mean values for the years 1995 to 2008. Data from Transit/NZTA State Highway Traffic Volume Reports, online pdf files. (Traffic flow increased by an average of 1.65% annually over this period.) The “categories” shown are not given in the reports, and are estimated by me as follows: Through Traffic: A value a little lower (rounded at 12,000) than the vehicle count at the recording station south of Levin. It will include some Kapiti to Howhenua commuters. Kapiti to Porirua, Hutt, and Wellington Commuters: A value (8,000) somewhat lower than the vehicle count at the Paekakariki South and Pukerua Bay recording stations (less the Through Traffic count). Through Traffic + Kapiti Commuters rounded at 20,000 vehicles. Pukerua, Paremata, Porirua to Wellington commuters: The vehicle counts above the Through Traffic and Kapiti to Wellington (etc.) Commuters, from the Motorway to Pukerua Bay recording stations. Kapiti Local Traffic: The vehicle count above the Through Traffic and Kapiti to Wellington (etc.) Commuters, from Paekakariki South to Waikanae recording stations. The maximum value (4,100) is on SH 1 just north of the Ihakara Street recording station. The North of Ihakara St value (4,100 vehicles) is 17% of the total vehicle count at that station. Heavy traffic (> 3 t), not shown on this graph, is 1200−1500 vehicles (10%) north of Waikanae, 2000 vehicles (5−7%) on the Motorway (diluted by commuting cars). A simpler estimation can be made by assuming that the rise in vehicle numbers in the Kapiti area, say Paekakariki to Waikanae, represents the “local” vehicles using SH 1 for local trips. The result is the same. Most of the traffic on Kapiti’s SH 1 is through traffic or Kapiti commuters (and the distinction between these two groups is difficult to make and not very relevant here). I believe my 17% estimate is on the high side. Not all these vehicles would use a 2-lane WLR, because their origin or destination would be closer to SH 1. It is therefore difficult to reconcile these data with KCDC’s estimate of 22% of traffic using the WLR.