Download to read offline

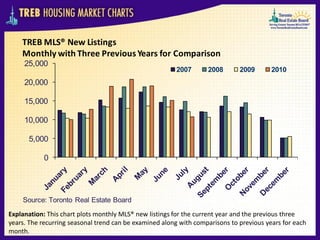


The document contains charts analyzing the Toronto housing market from 2007-2010. It shows trends in MLS sales, new listings, average prices, and sales-to-listing ratios. The ratios indicate that when they increase, average annual price growth increases, and vice versa. The affordability chart shows the percentage of average household income needed for a mortgage, taxes and utilities on an average-priced home, which peaked near 50% in 2010.


