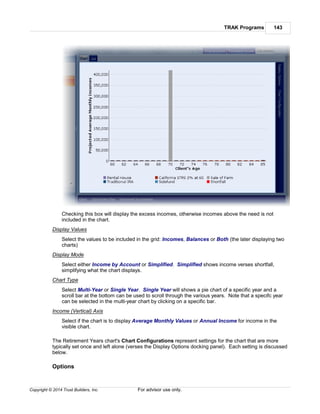
Download to read offline


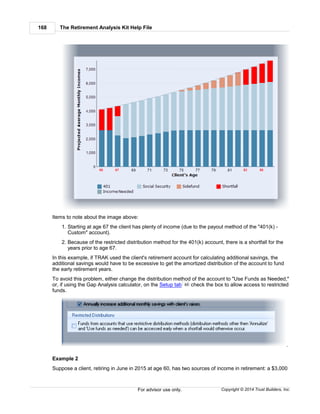
![TRAK Programs 135
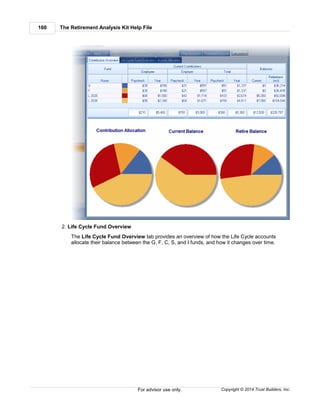
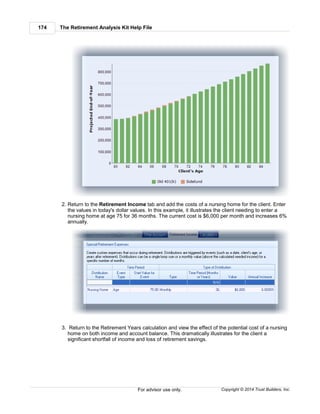
Copyright © 2014 Trust Builders, Inc. For advisor use only.
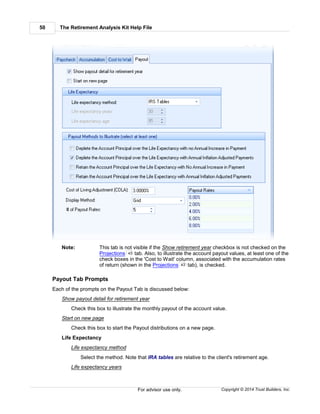
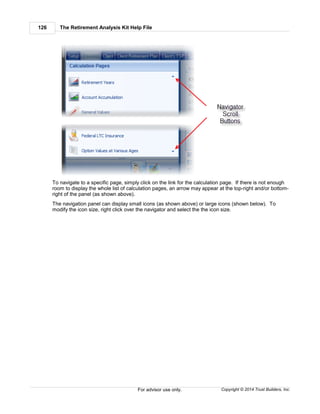
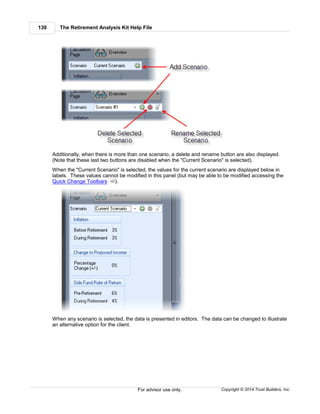
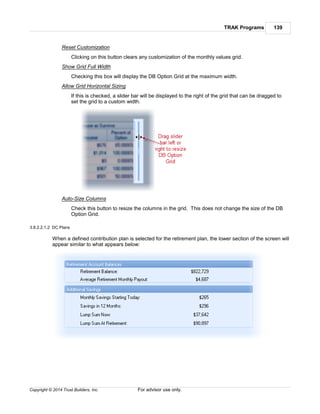
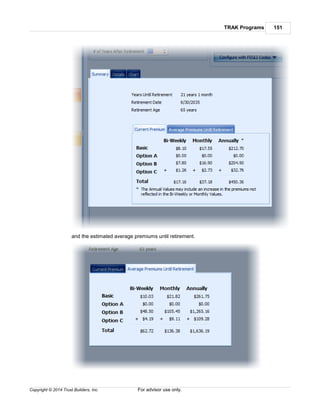
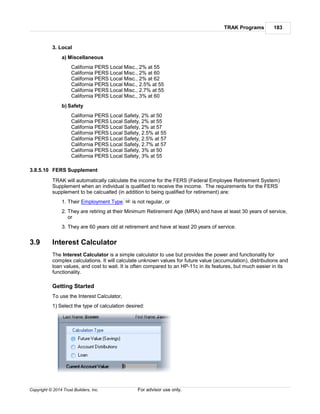
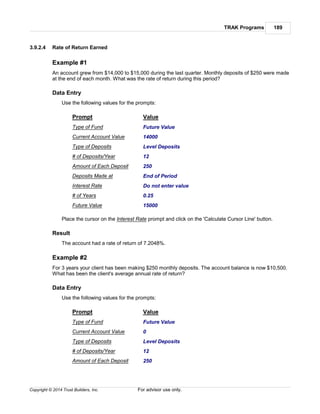
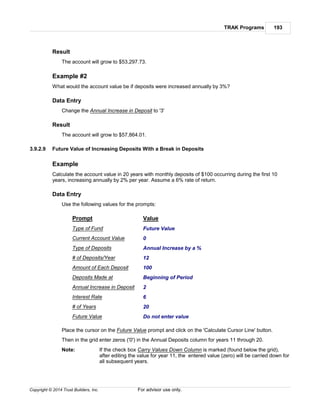
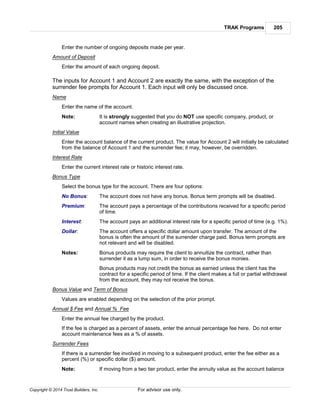
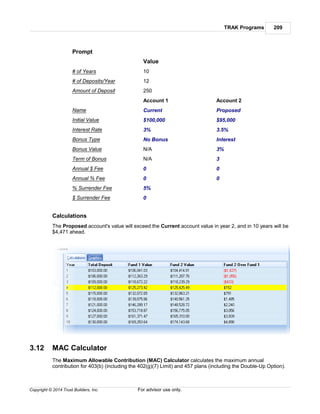
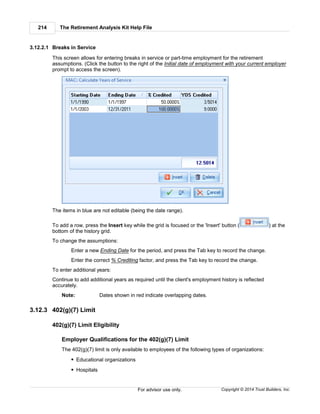
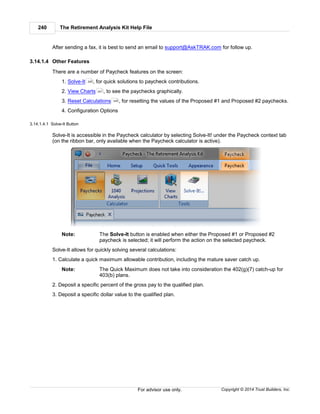
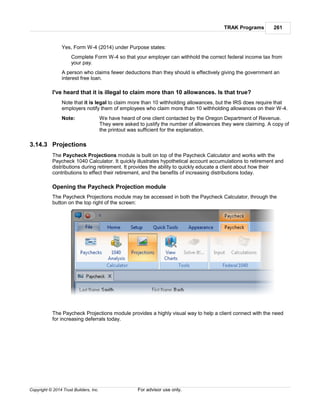
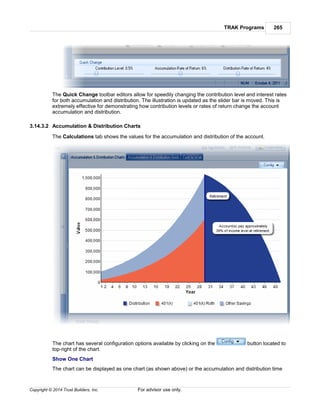
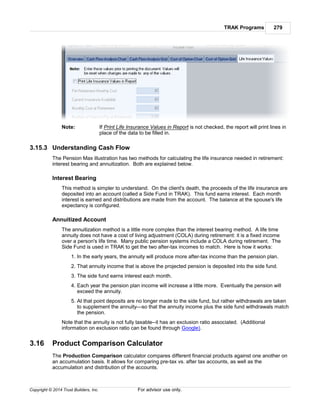
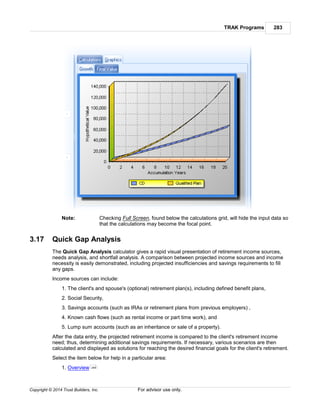
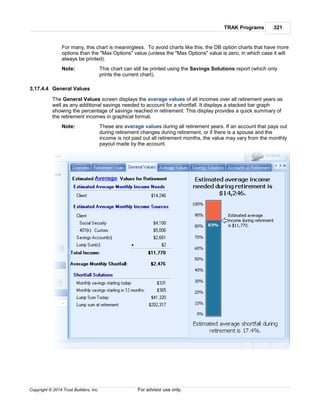
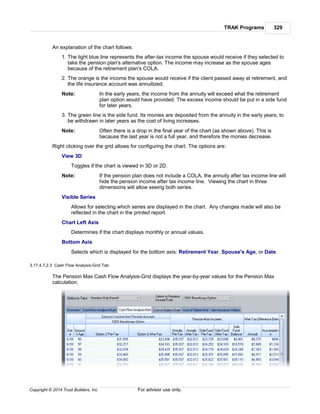
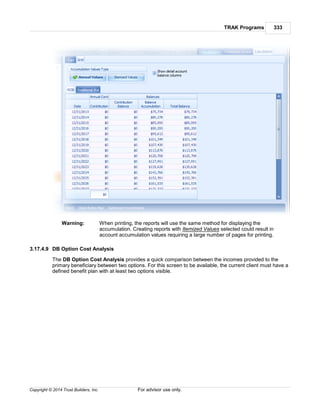
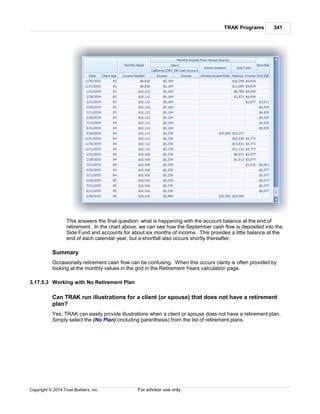
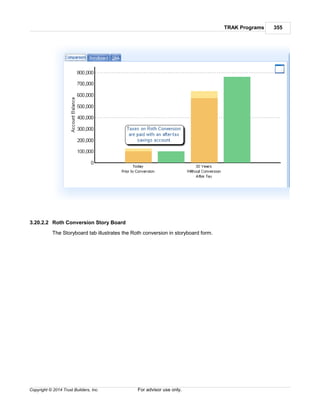
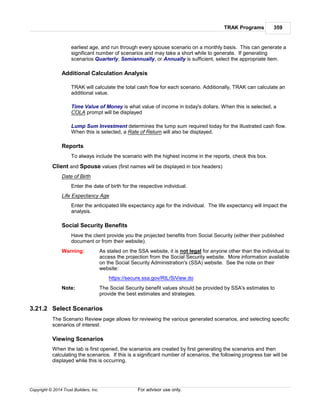
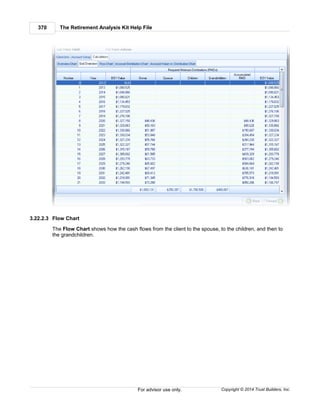
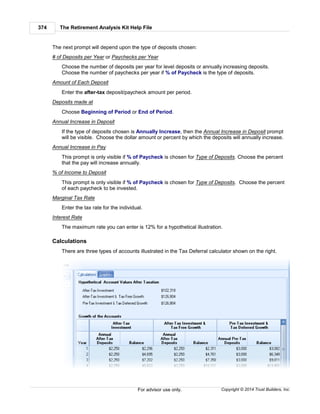
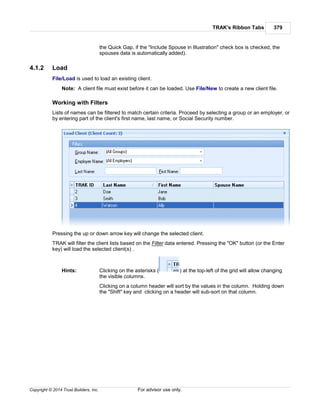
Lower Section of the Overview Calculation Screen
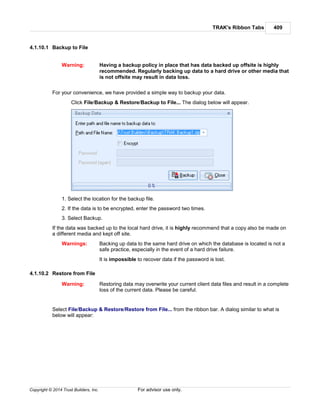
The lower part of the calculation tab changes based on the type of retirement plan that is selected.
Click on the links below for help with each item:
Defined Benefit
Defined Contribution
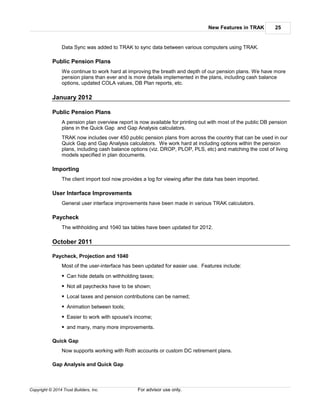
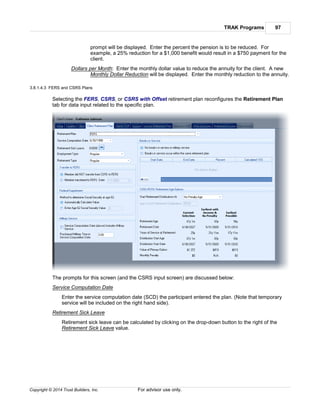
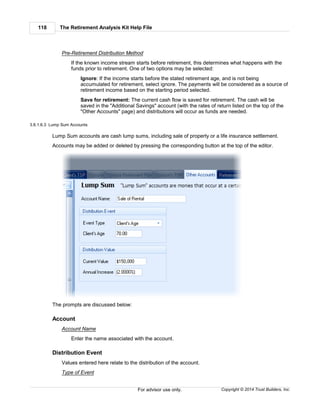
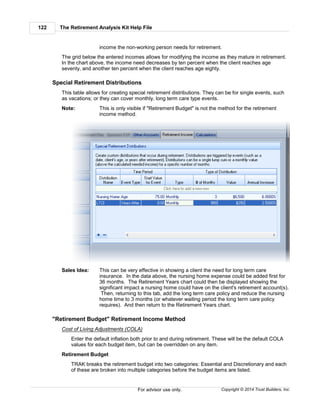
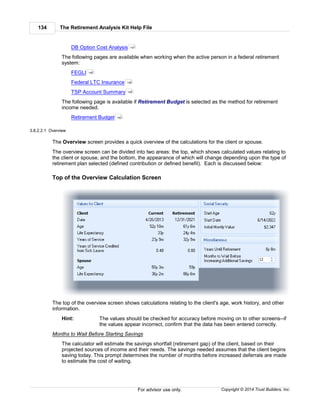
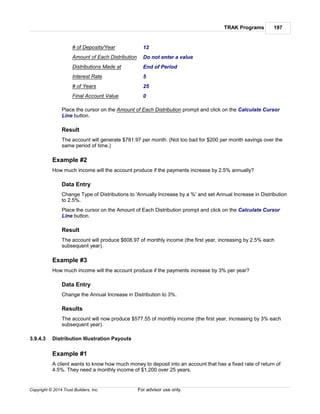
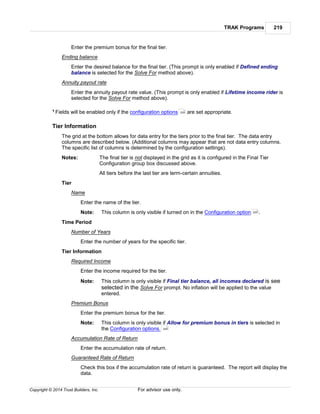
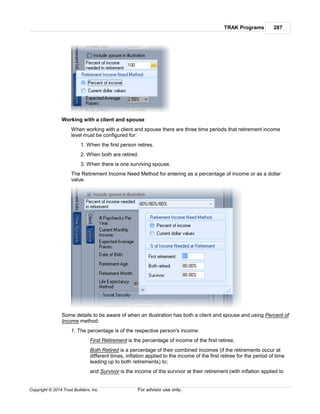
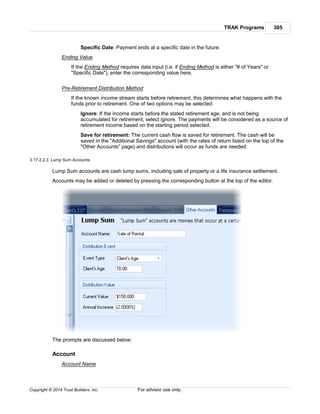
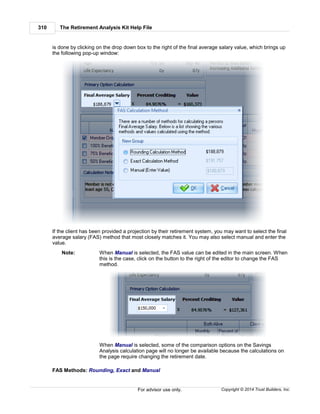
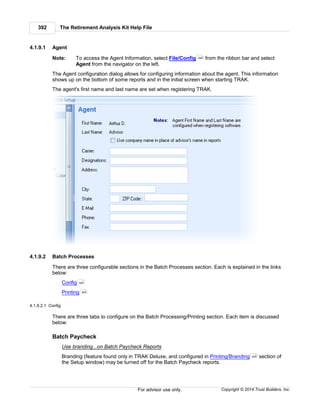
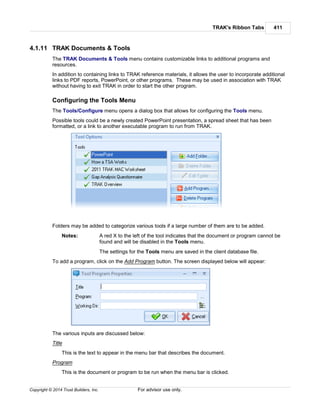
3.8.2.2.1.1 DB Plans
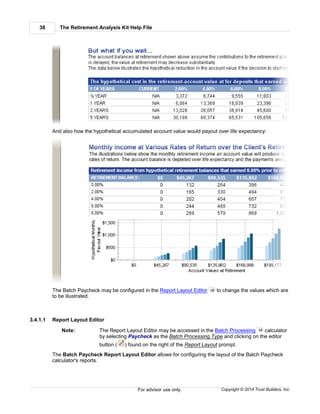
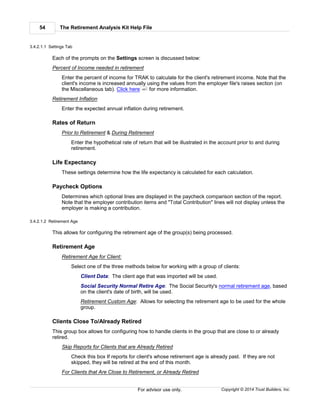
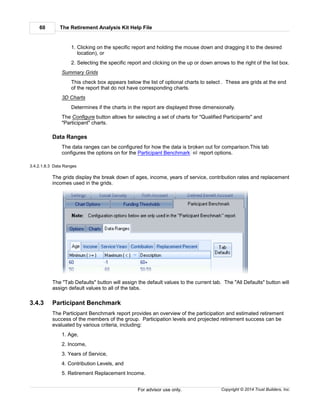
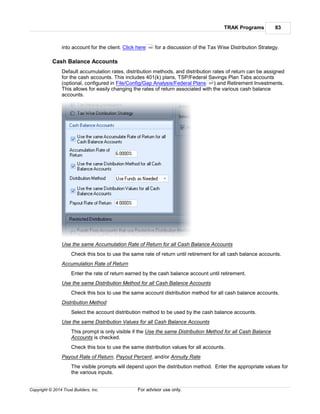
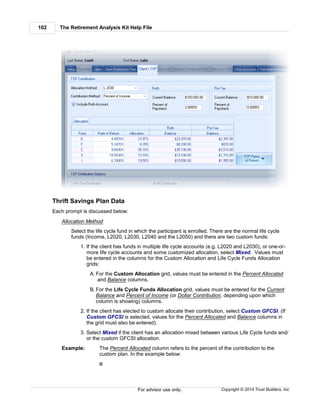
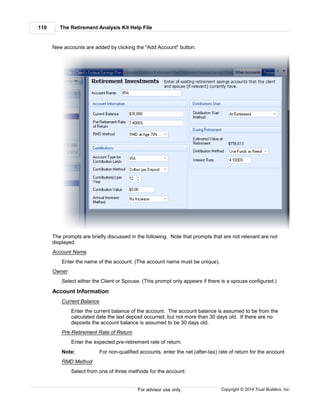
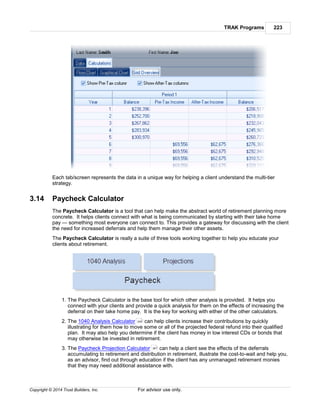
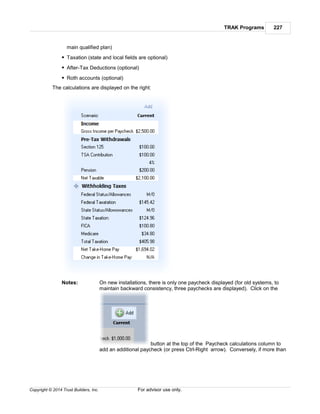
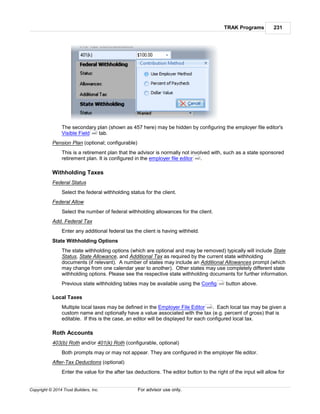
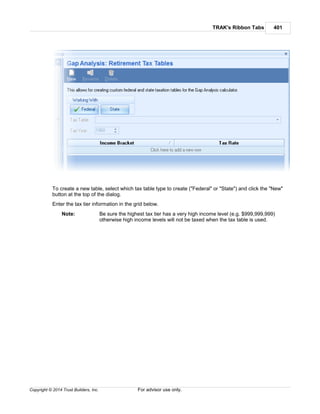
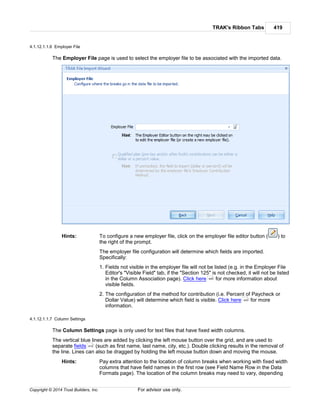
When a defined benefit plan is selected for the retirement plan, the lower section of the screen will
appear similar to what appears below:
Note: When working with defined benefit plans that integrate with Social Security, the
Primary Option Calculation group box will appear differently; illustrating how the
integration with the Social Security calculation was performed.
The areas on this screen are discussed below:
Primary Option Calculation
This illustrates how the retirement plan's primary option is calculated showing:
1. the Final Average Salary,
2. the Percent Crediting,
3. possibly the Years of Service (shown if the same crediting rate is used for all years of service,
and
4. the Primary Option Value.
TRAK allows for three different methods for arriving at the Final Average Salary (Exact [default],
Rounding, and Manual). Additionally, it allows for the calculation to be offset by a year either way. This
is done by clicking on the drop down box to the right of the final average salary value, which brings up
the following pop-up window:
135
139](https://image.slidesharecdn.com/trakusersmanual-150831205857-lva1-app6891/85/TRAK-The-Retirement-Analysis-Kit-Users-Manual-135-320.jpg)


![The Retirement Analysis Kit Help File238
Copyright © 2014 Trust Builders, Inc.For advisor use only.
thresholds, but not enforce annual limits.
What's next?
What illustrations should be run after the Paycheck illustration? Trust Builders recommends several
approaches, depending upon the client's needs:
1. If the client needs to find additional savings, use the 1040 Analysis calculator.
2. To evaluate the client's current contribution levels and its value at retirement (in terms of
percentage of income it will produce), click on the Projections button found at the top of the
screen.
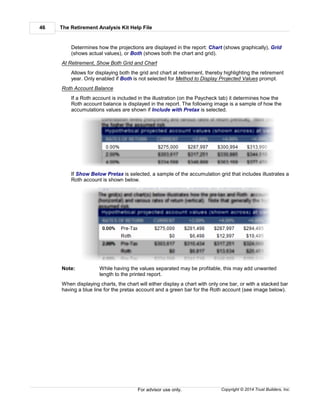
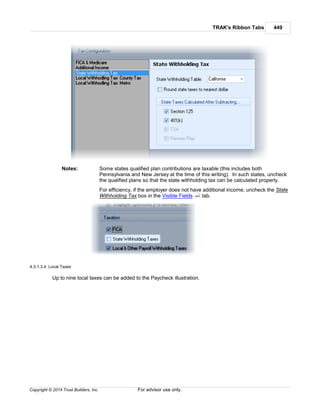
3.14.1.3 Solving for Withholding Taxes
Occasionally, TRAK's Paycheck Calculator tax withholding calculations may not match a client's
paycheck stub. Trust Builders, Inc. receives support calls about issues such as these. However, due to
the nature of the business, we are usually quick to recognize and correct any inconsistencies in federal
or state tax calculations.
If calculations do not match, use the following steps to check the withholding calculations:
FICA and/or Medicare are Incorrect:
The only deduction before calculating FICA and Medicare is Section 125 (Cafeteria ) contributions.
Be sure these match. Otherwise, check that the FICA and Medicare rates were entered correctly in
the employer file .
Federal and/or State withholdings are incorrect
Note: If both federal and state calculations are incorrect, it is very likely that the problem
exists due to one of the items listed below:
1. Check the tax year.
There are times when the withholding calculations are from a previous year, either because the
paycheck stub is from last year or an employer has not updated their withholding tax tables. Click
on the 'State' button below the employer (if state withholding taxes are visible, as set in the
Employer File ), or right click over the Paycheck calculator and select the tax year for the federal
and/or state withholding table.
2. Check that TRAK is up to date.
Tax tables are updated as changes occur. Updates are posted to the website.
3. Confirm that the right status and allowances are selected.
4. Check the withholding tax table in the Employer File Editor .
If the employee is not paid using a standard withholding table (specifically weekly [52], bi-weekly
[26], semi-monthly [24], quad-weekly [13], monthly [12], or annually [1]), the employer may elect
one of two options
a) Annualize the current income by multiplying it by the number of pay periods (selected in the
Employer File Withholding Tax Table as Payroll Periods).
b) Select the closest withholding table.
An example of this would be when employees are paid 11 times per year. The employer may elect
248
261
445
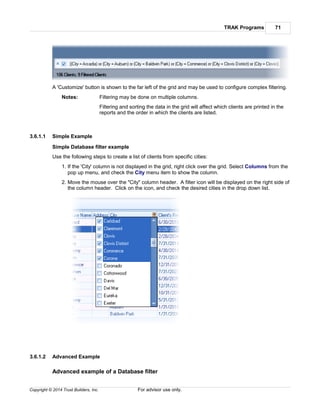
440
445](https://image.slidesharecdn.com/trakusersmanual-150831205857-lva1-app6891/85/TRAK-The-Retirement-Analysis-Kit-Users-Manual-238-320.jpg)


![The Retirement Analysis Kit Help File274
Copyright © 2014 Trust Builders, Inc.For advisor use only.
Select the payout method (either Annuitize or Interest) for handling the insurance proceeds.
Note: This prompt is only available when not using term policies.
Annuity Rate at Age [X]
Enter the annuity rate for the life insurance proceeds at the specified age.
Insurance Rate on Side Fund
Enter the interest rate received on the side fund.
Whole/Universal Life Policy Name
Enter the name of the life insurance policy.
Account Balance at Spouse's Life Expectancy
Enter the desired account balance at the spouse's life expectancy on the side account.
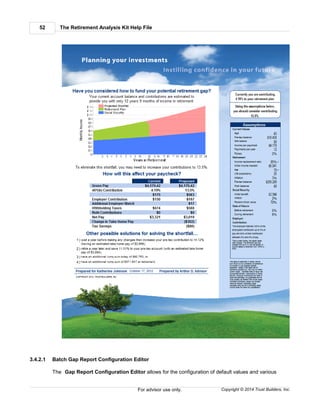
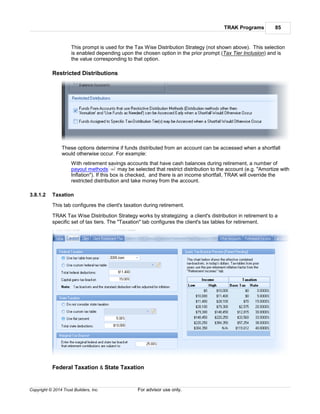
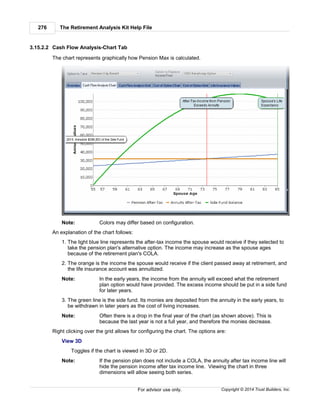
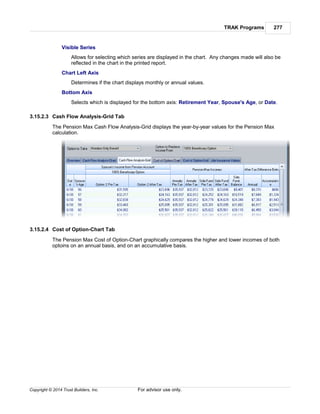
3.15.2 Calculations
The calculation tab provides the ability to select which primary and alternative option the client wishes
to select, and various ways of viewing the calculated data. The input and calculation tabs are each
discussed below.
Data Input
Option to Take
Select the option the client will select. Typically this is the primary option for the plan. For
some pension plans that provide other benefits (e.g. medical insurance) a client may want to
select an option that provides their spouse with the least amount of income and provide the
other benefits.
Option to Replace Income From
Select the option to replace the income from. If the option previously selected provides an
income, TRAK will calculate the insurance needed to replace the difference in income.
Calculation Tabs
There are five different calculation tabs, and a data-entry tab, that can be selected from:
1. Overview
2. Cash Flow Analysis-Chart
3. Cash Flow Analysis-Grid
4. Cost of Option-Chart
5. Cost of Option-Grid
6. Life Insurance Values (data entry)
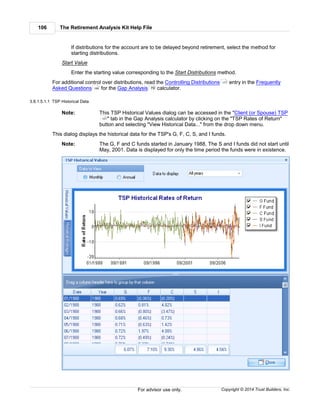
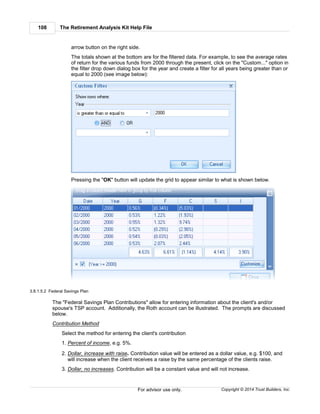
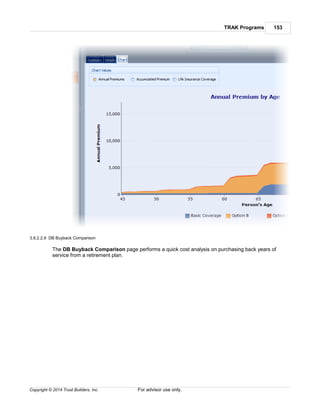
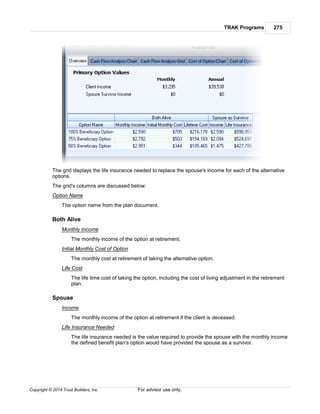
3.15.2.1 Overivew Tab
The Overview tab displays the income both monthly and annual from the selected option at the top
(for both the client and the spouse) and also displays the options that provide lower client income
levels below.
274
276
277
277
278
278](https://image.slidesharecdn.com/trakusersmanual-150831205857-lva1-app6891/85/TRAK-The-Retirement-Analysis-Kit-Users-Manual-274-320.jpg)


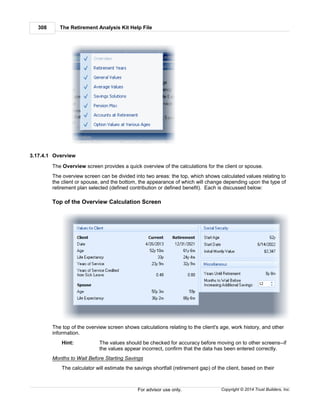
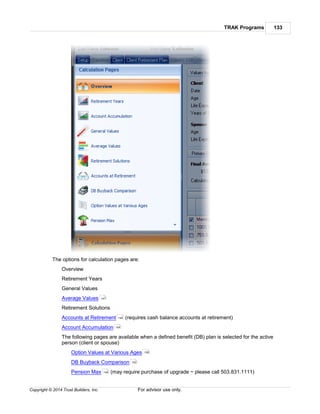
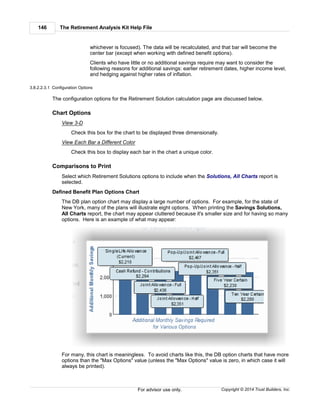
![TRAK Programs 309
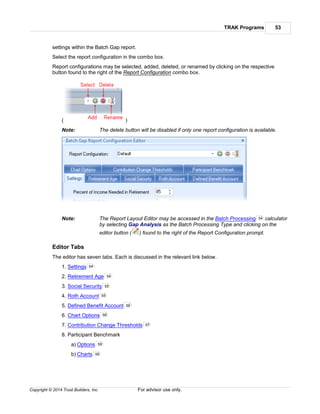
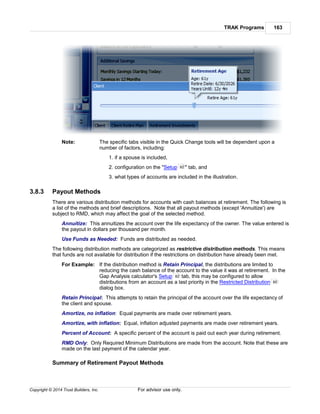
Copyright © 2014 Trust Builders, Inc. For advisor use only.
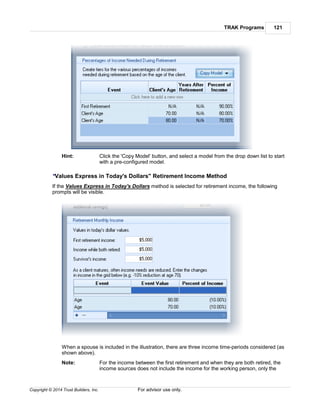
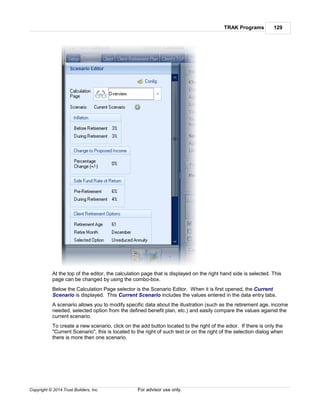
projected sources of income and their needs. The savings needed assumes that the client begins
saving today. This prompt determines the number of months before increased deferrals are made
to estimate the cost of waiting.
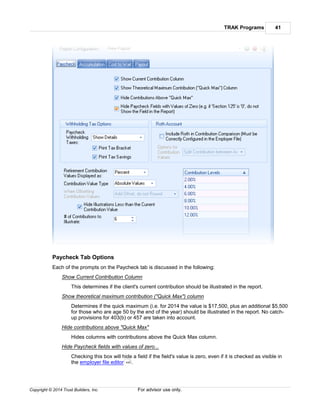
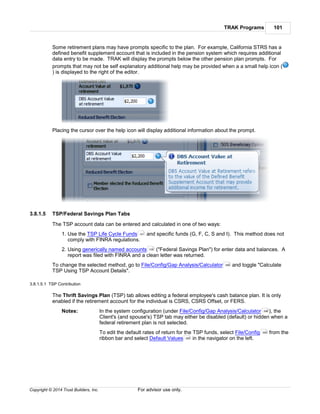
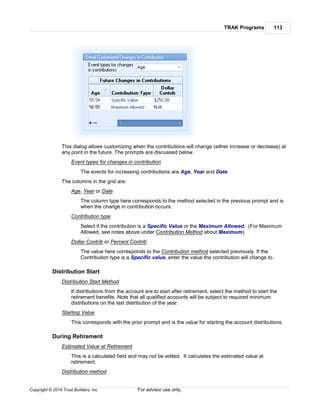
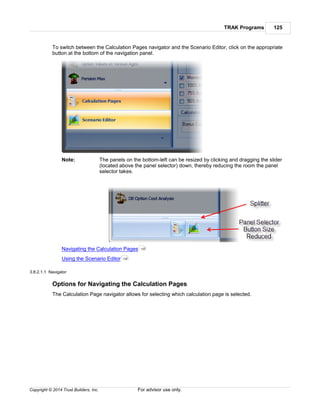
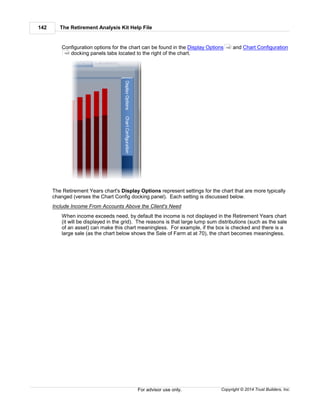
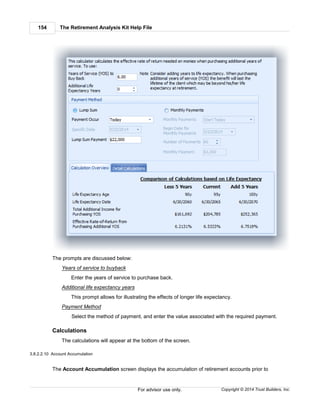
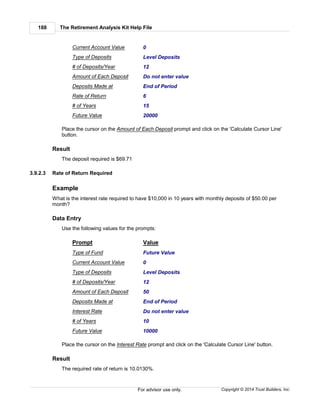
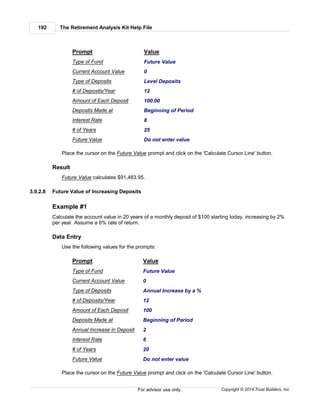
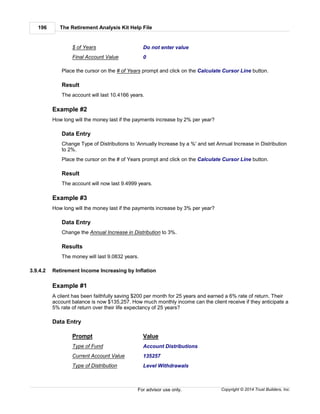
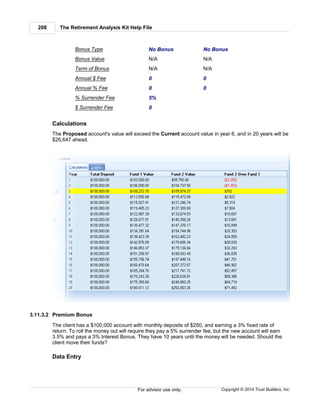
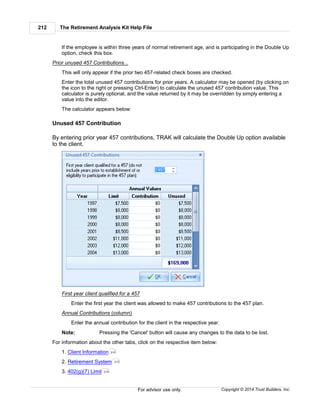
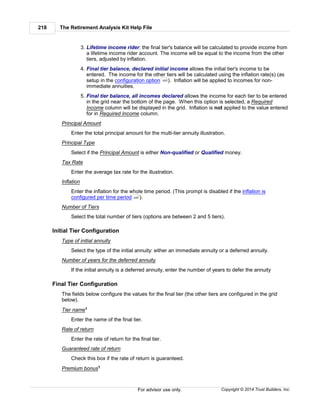
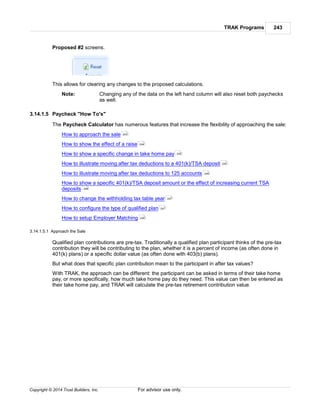
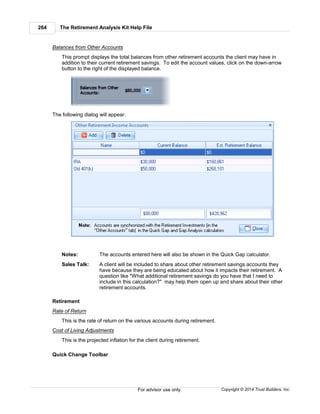
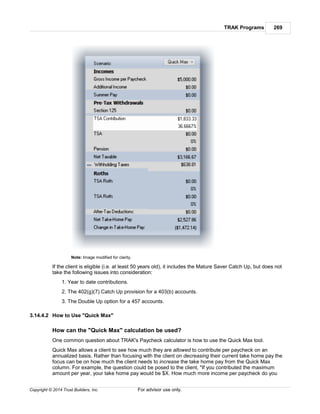
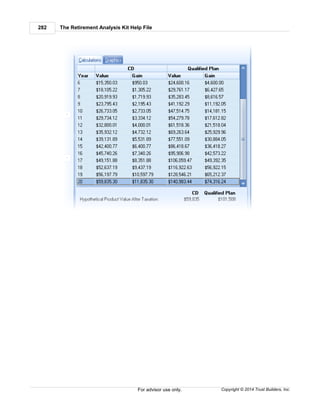
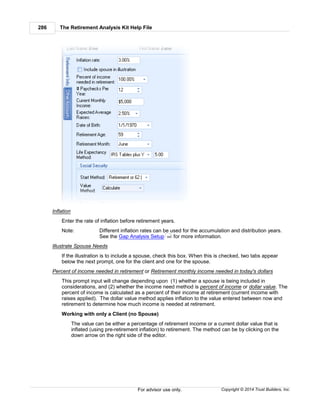
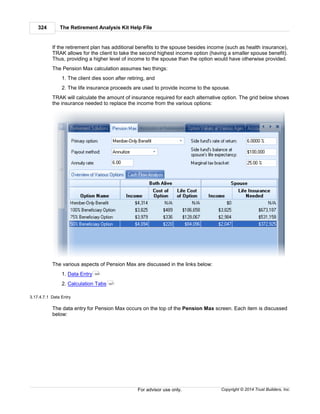
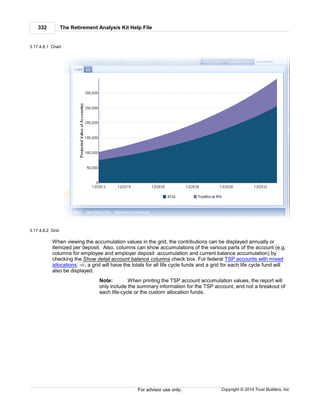
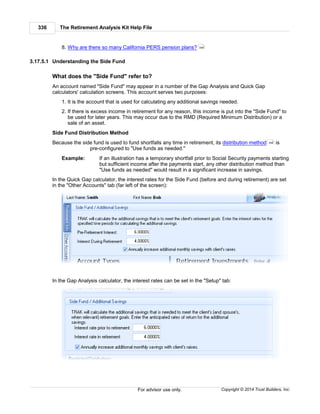
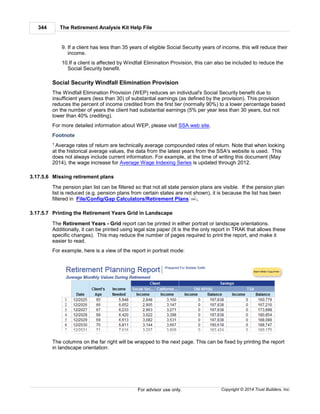
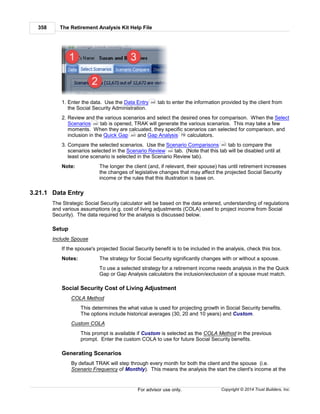
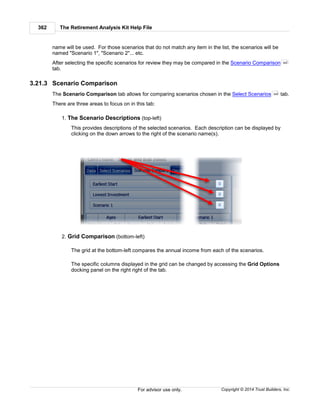
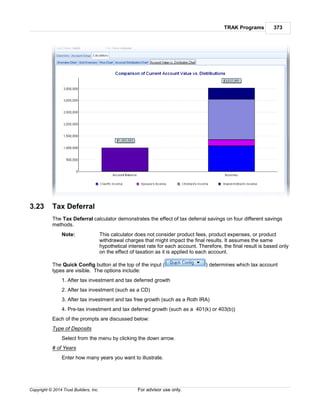
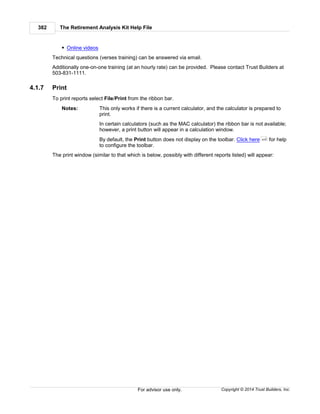
Lower Section of the Overview Calculation Screen
The lower part of the calculation tab changes based on the type of retirement plan that is selected.
Click on the links below for help with each item:
Defined Benefit
Defined Contribution
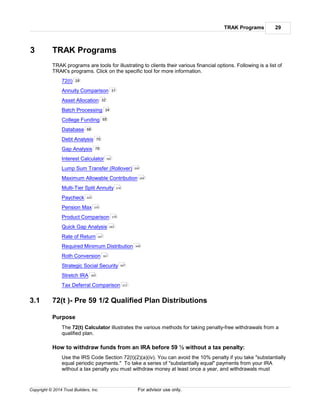
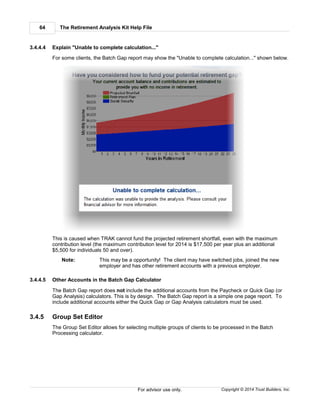
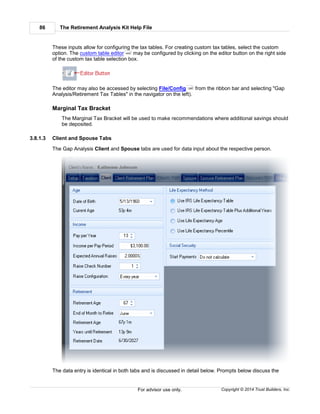
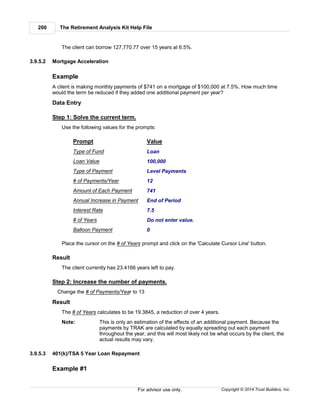
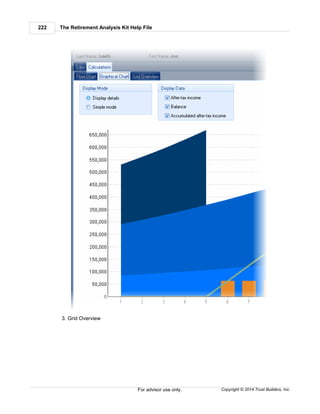
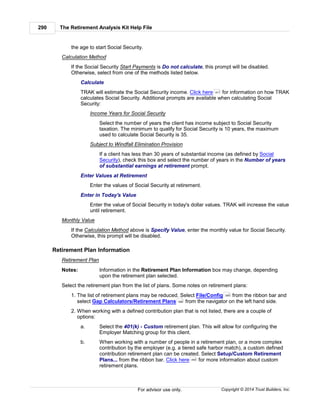
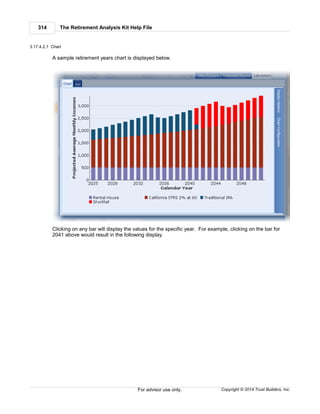
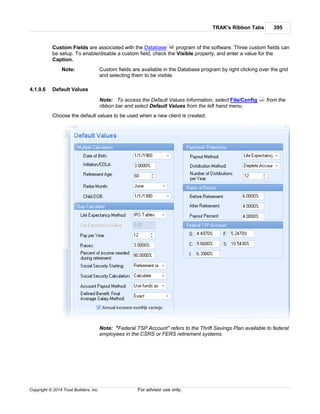
3.17.4.1.1 DB Plans
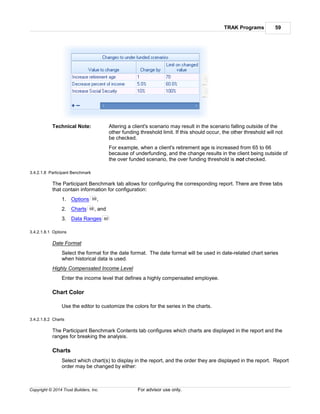
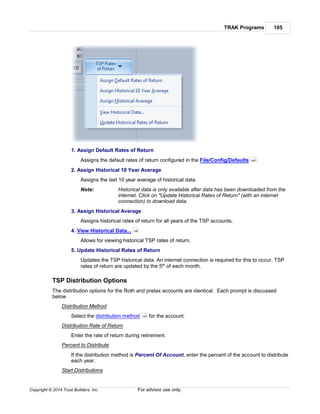
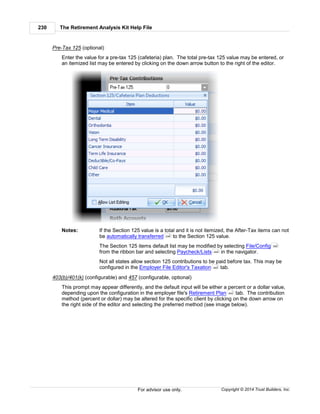
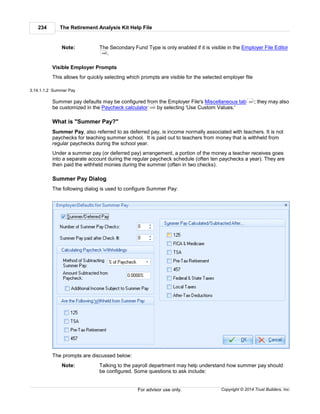
When a defined benefit plan is selected for the retirement plan, the lower section of the screen will
appear similar to what appears below:
Note: When working with defined benefit plans that integrate with Social Security, the
Primary Option Calculation group box will appear differently; illustrating how the
integration with the Social Security calculation was performed.
The areas on this screen are discussed below:
Primary Option Calculation
This illustrates how the retirement plan's primary option is calculated showing:
1. the Final Average Salary,
2. the Percent Crediting,
3. possibly the Years of Service (shown if the same crediting rate is used for all years of service,
and
4. the Primary Option Value.
TRAK allows for three different methods for arriving at the Final Average Salary (Exact [default],
Rounding, and Manual). Additionally, it allows for the calculation to be offset by a year either way. This
309
313](https://image.slidesharecdn.com/trakusersmanual-150831205857-lva1-app6891/85/TRAK-The-Retirement-Analysis-Kit-Users-Manual-309-320.jpg)


![The Retirement Analysis Kit Help File350
Copyright © 2014 Trust Builders, Inc.For advisor use only.
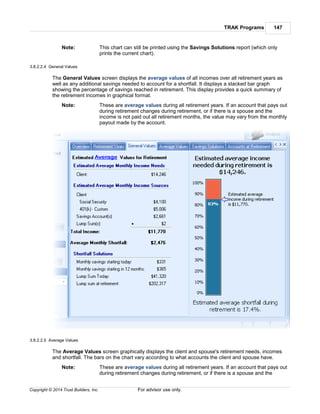
Has Beneficiary
Used for illustrating the hypothetical cash flow analysis to the beneficiary.
Beneficiary's DOB
Enter the date of birth of the named beneficiary.
Beneficiary is Spouse
Check if the beneficiary is the spouse.
Show Bene's RMD Values
Determines if the beneficiary is included in the illustration.
Beneficiary's Life Expectancy (years)
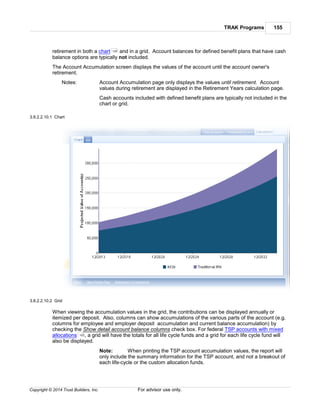
Similar to the client's life expectancy prompt: the default value is from the IRS life expectancy
tables. If a 'Reset' button ( ) appears on the right of the editor, a manual value was entered.
To reset it to the IRS tables, click on the 'Reset' button.
Account Information
Account is a 403(b) Qualified Plan
Check if the account is a 403(b) account, and then the 12/31/1986 balance can be
documented.
Account Balance as of 12/31/1986
Enabled if the prior input Account is a 403(b) Qualified Plan is checked.
Balances as of 12/31/[Last Year]
Enter the balance on the last day of the previous year.
Total Year to Date Distributions
Enter the total year to date distributions.
# of Deposits per Year (until the year turning 70½)
If deposits are ongoing, enter the ongoing deposits.
Deposit Value
Enter the value of the ongoing deposits, if any.
Pre-Retirement Interest Rate
Enter the pre-retirement interest rate.
Post-Retirement Interest Rate
Enter the interest rate after retirement.
Deposit Increase Method
Enter the method for increasing deposits. The options are None, Annually by %, and
Annually by $.
Deposit Increase
Enter the value corresponding to the Deposit Increase Method selected.](https://image.slidesharecdn.com/trakusersmanual-150831205857-lva1-app6891/85/TRAK-The-Retirement-Analysis-Kit-Users-Manual-350-320.jpg)


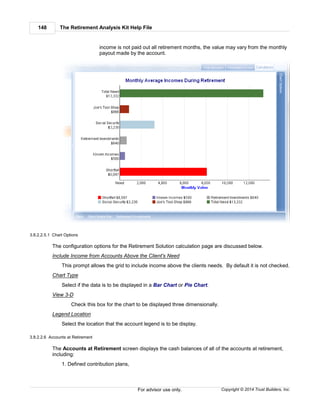
![TRAK's Ribbon Tabs 421
Copyright © 2014 Trust Builders, Inc. For advisor use only.
Calculation, and Information.
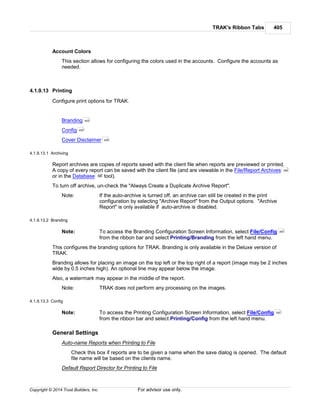
List of fields
Below is a categorized list of fields that may be imported from the client data file:
Note: The maximum size for each field is shown only when relevant.
Field Name Description Max
size
Required Fields
The following two fields are required for importing client data.
First Name First name of the client. 25
Last Name Last name of the client 25
Calculation Fields
The following fields are used for paycheck calculations. Depending upon the configuration of the
Employer File, fields may not be listed (e.g. second qualified plan contributions).
Income Per paycheck income for the client. If the income from the
data file represents more then one paycheck, it may be
manipulated on the next page.
Add Income Any additional income that the client receives. See the
Paycheck help for information regarding this field.
Federal Status The client's federal filing status. Should be either
'Married' ('M') or 'Single' ('S').
Federal Allow Number of federal allowances the client is filing.
Add Federal Tax Any additional federal tax that the client is paying per
paycheck.
State Status The client's state filing status. Should correspond to the
filing status in the Paycheck calculator (either the full name
selected on the left of the Paycheck Calculator abbreviation
or the right).
State Allow Number of state allowances the client is claiming.
Add State Tax Any additional state tax paid by the client per paycheck.
Local Tax Local tax values can be imported if, in the employer file, the
local tax is configured to prompt for the value . If local
taxes are to be imported, the field name will be the name of
the local tax entered in the employer file editor with
"[LOCAL TAX]" added as a suffix.
Sec 125 Value for the client's total Section 125 contributions.
QualifiedPlan_1_Dollar or
QualifiedPlan_1_Percent
Contributions to the primary qualified plan as a dollar or
percent value. Only one field will be visible, depending upon
449](https://image.slidesharecdn.com/trakusersmanual-150831205857-lva1-app6891/85/TRAK-The-Retirement-Analysis-Kit-Users-Manual-421-320.jpg)


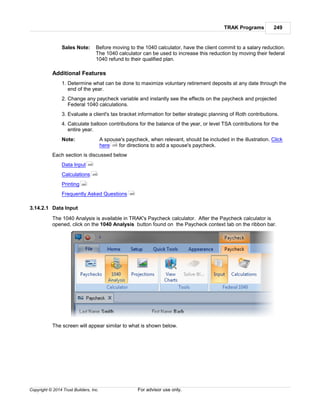
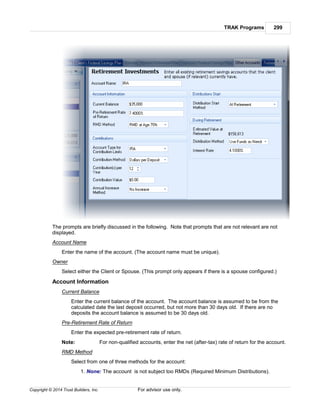
The Retirement Analysis Kit by Trust Builders, Inc. is designed to educate participants on their retirement planning scenarios, enhancing their understanding and trust in advisors. It features a variety of tools for financial calculations, data management, and reporting, aimed at helping clients achieve healthier retirements. The document includes a comprehensive help file with instructions, features, and support for users to maximize the effectiveness of the kit.


![Quran [eng] MD Muhsin khan & Sahih International](https://cdn.slidesharecdn.com/ss_thumbnails/quranengmuhsinkhansahihinternational-160919205115-thumbnail.jpg?width=640&height=640&fit=bounds)


