Training report on Budget Analysis
•
2 likes•1,333 views

This document provides details of a 3-day training on budget analysis conducted by the Centre for Budget and Governance Accountability and YUVA. Day 1 focused on introducing basic budget concepts through an exercise comparing a hypothetical NGO budget to a government budget. It also covered understanding the Union budget structure and documents. Day 2 involved analyzing key sectors in the Union budget and understanding information that can be derived. Day 3 discussed the political process of budget making and the role of civil society in influencing budgets. The training aimed to build awareness of budgeting and its importance for development work.

Recommended
Recommended
More Related Content
What's hot
What's hot (20)
Similar to Training report on Budget Analysis
Similar to Training report on Budget Analysis (20)
Training report on Budget Analysis
- 1. Conducted by Centre for Budget and Governance Accountability, Delhi and YUVA, Mumbai April 14TH to 16th , 2007 at YUVA Centre, Kharghar, Navi Mumbai INTRODUCTION The training aims at building awareness and capacity on the complex procedure of budgeting and developing understanding about the importance and relevance of Union and State budgets with work related to development sector. The training also aims to develop the skills on budget analysis. Over the past years it was realized by all of us working in the development sector that the sectors we are involved in has strong relationship with different budgetary allocations of the Union and State Government. The direction/nature of our intervention is determined by finances allocated to sectors we are involved in. Thus it is very important for us to understand the process of budgeting and hence be able to analyse budgets. This would help in working for our own area budgets and hence determine strategies to influence budgets. OBJECTIVES: • To develop a basic understanding on Budget Analysis • To understand the relevance of budget work • To understand the link between union budget and organizational work/targets • To be able to use the data, generated by budget work, in efforts for advocacy • To have a critical view of Union budget 2007 with special reference to the social sector - children, health and gender TRAINING ON BUDGET ANALYSIS
- 2. Training Design Session / Time Focus Content Day 1 10.00 AM-10.30 AM Welcome Note Day 1 10.30 AM- 11.15 AM Ice Breaking (Some appropriate exercise) 11:15-11:30 AM Tea Day 1 11:30 - 1.00 PM Drawing an Analogy between the Budget of a Hypothetical NGO and the Budget of a Government (Group Work) Annual Budget of a hypothetical NGO List of Objectives of the hypothetical NGO The task for each Group would be to match the Objectives with funds allocated in the Budget. Such an exercise is intended to convey the meaning of Budget. Though narrow in scope, it would convey a comprehensible meaning which is that “Budget is nothing but a series of goals with price- tags attached”. Day 1 2.00 PM- 2.45 PM Findings of “Budget Analysis” by the Participants Answers to a few Questions: • How much money is going for which Objective? • What is the Pattern in allocations over three years? • Is this Pattern of allocations justified? Day 1 2.45 PM- 3.15 PM What Lessons are we drawing about the impact of Budget from the above exercise? Budget is central to Governance Allocations reflect priorities Scrutiny of the Budget reveals important information for policy advocacy 3:15-3:30 PM Tea Day 1 4.00 PM- 5.00 PM Similarities and Differences between Budget of a private entity/ household Explaining the terms/ concepts like: Receipts & Expenditure - distinction between Revenue and
- 3. and the Government Budget Capital Tax - distinction between Direct and Indirect Taxes Deficit & Debt Day 2 9.30 AM-10.00 AM Recap of Day 1 Day 2 10.00 AM- 11.30 AM Introducing the Participants to Union Budget Structure of the Union Budget Consolidated Fund Contingency Fund Public Account Revenue and Capital Budgets Plan and Non Plan Expenditures General, Economic and Social Services Demands for Grants and Appropriations Revenue, Fiscal and Primary Deficits GDP Day 2 11.45 AM- 1.15 PM Union Budget documents How do we read and use them? “Budget Highlights”- the most simple document Quick reading of “Budget at a Glance” to identify the terms explained earlier Annual Financial Statement Expenditure Budget Roadmap to reading the technical documents through Major heads, Minor heads, and Demand Nos. Day 2 2.15 PM- 3.45 PM Analysing the budget Understanding Information derived through budget analysis Group work on 4 important sectors / themes involving use of Union Budget documents Supplementary information on those Sectors/ themes Generated by budget work Other relevant data
- 4. 3:45-4:00 PM Tea Day 2 4:00-4:30 Presentations from the Group Work Day 2 4.30 PM- 5.30 PM Importance of sectoral analysis of budgets Budgeting for children, women, dalits and adivasis – the marginalised Day 3 9.30 AM-10.00 AM Recap of Day 2 Day 3 10.00 AM-11.00 AM Budget making as a Political Process Brief discussion of Budget processes Influence of Institutional and Individual Actors in shaping up a Budget Day 3 11.15 AM-1.00 PM Role and relevance of Civil Society Budget work in the contemporary policy regime Importance of assessing Government’s priorities from its Budgets (Brief) Success Stories of Civil Society Budget work Day 3 2.00 PM- 4.00 PM How can we influence the political process of Budget making Strategizing the use of budget analysis Day 3 4.30 PM- 5.30 PM Evaluation Clarifications Way forward
- 5. DAY I ICE-BREAKING To begin with the workshop ice breaking exercise was conducted in which all the participants were divided in pair and were asked to take interviews of their partners. Then each participant will introduce their partners to the entire group with their expectations from the workshop. SESSION I Drawing an Analogy between the Budget of a Hypothetical Household and the Budget of a Government All the participants were divided in 4 groups and were asked to prepare a budget of a hypothetical household Group Work Exercise Assumptions: • You are a resident of Mumbai City (includes Mumbai Suburbs, BMC Area, Navi Mumbai, etc) • No gender discrimination here, you can either be a woman or a man, as you wish • You are the only earning member in your family • Size of your family - husband (40), wife (37), daughter (15), son (12) and mother-in-law (65) • You are residing in a rented accommodation • Monthly household income from your salary – Rs. 18, 283 (includes 40% of basic salary as house rent allowance and Rs. 1, 000 as travel allowance) • Provident Fund (PF) facility is available at a maximum of 12% of your basic salary. • No other staff welfare benefits like medical insurance, gratuity, etc. Task: • You have to prepare the monthly budget (April 2007) of your family and make a presentation of it in the larger group • Please give account (in detail) for every rupee that you pretend to spend • Explanations, such as why, what & how will help the larger group to understand the purpose/objective of such spending better (for e.g. hospital expenses of your mother-in-law who is suffering from diabetes)
- 6. The exercise builds up the session objectives of understanding difference and similarities between Public and Private budget: Expectations on income are more clear in case of private budgets and the same is less certain in case of public budget. In case of private budgets a clear idea about income is made and then the items of expenditure are included. On the other hand, in case of public budgets a clear idea about expenditure is made first and then the revenue sources are identified. In case of both the budgets, deficit leads to debt. Formulation of private budget depends upon present income, wealth stock and other limitations. For public budgets such limitations are flexible. Sources of borrowing include both institutional as well as private channels in case of private budgets. In case of public budgets all borrowings are made through institutional channels. Private budgets cannot run on deficit for a long time. Public budgets can take resort to deficit financing for a long time. Motive for private budgeting is maximum private benefit. So, the aim is at attaining a surplus or maintaining a balance. In case of public budgets, the motive is to maximise social welfare. Therefore, many times deficit is preferred to a surplus or balance. Private budget is a household management tool. Public budget is a statement of policy priorities. . Union budget is not a technical document that only persons with specialized skills can handle. It is very similar to the budget that we prepare in our houses. Session II Introduction to the Union Budget and the Basic Concepts of Budgets The session’s objective was to introduce the basic concepts of Union Budget, explaining the budget terminology. Union Budget is the most comprehensive platform for the Central Govt. to give shape to its policy priorities. All State Budgets dependent on ‘untied’ resources coming to them from the Union Budget: - Share in Gross Tax Revenue - Non Plan Grants - Central Assistance for State & UT Plans
- 7. Union Budget is the largest platform for policy changes in India, whether progressive policies/ market driven reforms/ tax reforms. Expenditure priorities of Union Budget 2007-08 Let’s suppose that total Expenditure from Union Budget 2007-08 is Rs. 100/- The Central Govt. spend this Rs. 100/- in 2007-08 as: 1. Interest Payments: Rs. 25 2. Defence: Rs. 15 3. Economic Services: Rs. 15 4. Social Services: Rs. 14 5. General Services: Rs. 8 6. Subsidies: Rs. 9 7. Non Plan Grants to States and UTs: Rs. 6 8. Central Assistance for State & UT Plans: Rs. 8 Functional Classification of the Budget • General Services: Government expenditures for the maintenance of law and order, defence of the country, and running of the general organs of the Government, interest payments, etc. • Social Services: Expenditures on education, health, water supply and sanitation, social security and welfare, welfare of SCs, STs and OBCs, housing and urban development, etc. • Economic Services: Expenditures on various kinds of services usually leading to income generating activities, such as foreign trade and export promotion, economic development programmes under various ministries, agriculture and allied services, industry and minerals, rural development, transport and communications, etc. • Others: Statutory Grants-in-aid, ways and means advances, and other loans.
- 8. Major components of spending in the Union Budget The major components of expenditure from the Union Budget are: 1. Interest Payments: - interest payments & - debt servicing (expenditure made by Finance Ministry) 2. Defence: - total outlay on Defence Services (excluding civil estimates for Defence such as Pensions) (entire expenditure to be made by Ministry of Defence) 3. General Services: - pensions, - police, - organs of state 4. Economic Services: - agriculture & allied activities - rural development - irrigation and flood control - industry and minerals - transport and communications - energy 5. Social Services: - education - youth affairs & sports - art and culture - health and family welfare - water supply and sanitation - housing and urban development - information and broadcasting - social welfare & nutrition 6. Subsidies: -food subsidy - fertilizer subsidy - subsidy on petroleum - Funds for most of the important Line Ministries come through these three components. - This is the most important pitch for Advocacy on the Union Budget.
- 9. Plan and Non Plan expenditure Plan Expenditure Non-Plan Expenditure • Plan Expenditure is meant for financing the schemes and programmes especially framed under the given Plan (the Five Year Plan) or the unfinished tasks of the previous Plans. • Once a programme or scheme pursued under a specific Plan completes its duration, the maintenance cost and future running expenditures on the assets created or staff recruited is not regarded as Plan Expenditure. • Any expenditure of the government that does not fall under the Plan Expenditure is Non-Plan Expenditure. Composition of Plan & Non Plan expenditure in Union Budget 2007-08 32% 68% Plan Expenditure Non PlanExpenditure
- 10. Difference between Plan and Non Plan S.N. Major Component Total (Rs.) Plan (Rs.) Non Plan (Rs.) 1 Interest Payments 25 Nil 25 2 Defence 15 Nil 15 3 Economic Services* 15 11.35 3.65 4 Social Services* 14 12.5 3.65 5 General Services* 8 0.15 7.85 6 Subsidies 9 Nil 9 7 Non Plan Grants to States & UTs 6 Nil 6 8 Central Asst. to States & UT Plans 8 8 Nil Total Union Budget 2007-08 100 32 68 *Figures for 3, 4, and 5 above are approximations Revenue and Capital Expenditure The entire Union Budget (i.e. total expenditure by the Central Govt.) can also be divided into two distinct categories called Revenue Expenditure and Capital Expenditure Revenue Expenditure Capital Expenditure • Capital Expenditure is usually meant for increasing Govt.’s assets or reducing its liabilities. - It is, however, not necessary that the assets created should be productive or they should even be revenue generating. - Once the Govt. decides to spend for the creation of an asset, Capital Expenditure bears all charges for the first construction of the project, while Revenue Expenditure bears all subsequent charges for maintenance and all working expenses. • Revenue Expenditure usually does not have any impact on creation of assets or reduction of liabilities of the Govt.
- 11. Difference between Revenue and Capital Expenditure S.N. Major Component Total (Rs.) Revenue (Rs.) Capital (Rs.) 1 Interest Payments 25 25 Nil 2 Defence 15 8.50 6.50 3 Economic Services* 15 11 4 4 Social Services* 14 13.50 0.50 5 General Services* 8 6 2 6 Subsidies 9 9 Nil 7 Non Plan Grants to States & UTs 6 6 Nil 8 Central Asst. to State & UT Plans 8 8 Nil Total Union Budget 2007-08 100 87 13 *Fig. For 3, 4 an 5 above are hypothetical Composition of Revenue and Capital Expenditure in Union Budget 2007-08 87% 13% Revenue Expenditure Capital Expenditure
- 12. Examples of Revenue and Capital Expenditure Revenue Expenditure Govt. spends for building a new Factory (increase in assets) Govt. acquires 10 % shares of a Public Ltd. Co. (increase in assets) Central Govt. gives a loan to a State Govt. (increase in assets) Govt. repays the principal amount of a loan taken from ADB (reduction of a liability) Capital Expenditure Govt. pays the annual interest due on a loan from IMF (no effect on the size of the original liability) Govt. expenditure on Food Subsidy (no effect on assets/ liabilities) MHRD spends on Teachers’ Salary under SSA MoHFW spends on procurement of medicines under NRHM Central Govt. gives Grants to a State and the State spends it to build Schools (Centre won’t have the ownership of Schools built!) Mobilisation of Resources Assume total expenditure in 2007-08 will be Rs 100, the central government will have to raise Rs. 100 to meet out the expenditures Sources of Government Income (Receipts) 1. Tax Revenue (Net) (i.e. Gross Tax Revenue – States’ Share in Taxes, as per Finance Commission recommendations) 2. Non Tax Revenue Interest Receipts Dividends & Profits from PSUs External Grants, and Services Charges recovered by Ministries 3. Non Debt Capital Receipts Recoveries of Loans and Advances Disinvestment Proceeds
- 13. Projections of receipts by Union Government in 2007-08 1. Net Tax Revenue Rs. 63 2. Non-Tax Revenue Rs. 13 Revenue Receipts (RR) Rs. 76 3. Non-debt Capital receipts RS. 0.5 Total Rs. 76.50 Total receipts projected by the Union government in 2007-08 is Rs. 76.50 and expenditure is Rs. 100. Hence Rs. (100-76.50)=Rs. 23.5 will be raised through borrowings and is called Debt Deficit Deficit is a Gap and the Govt. takes Debt to cover that gap. Difference between Fiscal and Revenue Deficit Fiscal Deficit Fiscal deficit (FD) of the Union government is the gap between its total expenditure (including loans net of repayments) and its sum total of non-debt creating receipts. Fiscal deficit indicates the total borrowing to be made by the government in a particular year. Example: In Union Budget 2007-08, FD= Rs. 100-76.5= Rs. 23.5 Revenue Deficit Revenue deficit (RD) is the gap between Revenue Expenditure and Revenue Receipts Example: In Union Budget 2007-08, RD= Rs. 87-Rs. 76=Rs. 11 Composition of receipts by the Union governement 63 13 0.5 23.5 Net Tax Revenue Non-Tax Revenue Non-debt Capital receipts Debt
- 14. Where does the Govt. record its Receipts and Expenditures? All receipts and expenditures of the government are shown in three separate parts in the Budget, viz. (1) Consolidated Fund, (2) Contingency Fund and (3) Public Account. Consolidated Fund: All revenues received by the Govt., all money received by it in recovery of loans, and all loans raised by it constitute one consolidated fund, called the Consolidated Fund of the India. The government can take out money from the Consolidated Fund only if it gets legislative approval to do so. This fund is created under Article 266(1) of the Constitution of India. Contingency Fund: This Fund is of the nature of an imprest and enables the Govt. to meet unforeseen expenditure. However, the fund needs to be replenished and expenditure approvals are to be cleared at a later date by the Parliament. Article 267 of the Indian Constitution empowers the Parliament and the Legislature of a State to create a Contingency Fund for India and the States; through the Contingency Fund of India Act, 1950. Public Account: Article 266 (2) of the Constitution of India states that all other public money received by or on behalf of the Government of India shall be credited to the Public Account of India. Receipts and disbursements, such as deposits, reserve funds, remittances etc., which do not form part of the ‘Consolidated Fund’ are included in the Public Account. Money in this Account is at the disposal of Govt., who acts merely as a banker or custodian of the public money (e.g. Provident Funds, small savings, deposits and advances etc). To make payments out of this account the approval of the Parliament is not needed.
- 15. Budget Estimates, Revised Estimates and Actuals In India, a fiscal (or financial) year starts on 1st of April and ends on the 31st of March in the following year. When Union Budget (say, for 2007-08) is prepared: All figures pertaining to the approaching fiscal year, i.e. 2007-08, are Budget Estimates All figures pertaining to the current fiscal year (2006-07) are given both as Budget Estimates (which gives the amount projected in the Budget for 2006-07) and Revised Estimates (which the government prepares based on the trends in receipts and expenditures over the first six to seven months of the financial year 2006-07) And most of the figures for the last financial year, i.e. 2005-06, are Actuals, not estimates. DAY II Session I Documents of the Union Budget (A) Non-technical documents in the Union Budget: Budget Highlights Presents the key expenditure and tax proposals made in the Budget. Budget Speech Speech delivered by the Finance Minister while placing the Budget before the Parliament. Budget at a Glance- Provides a brief overview of almost all aspects of receipts and expenditures contained in the Budget, at aggregate levels. Implementation of Budget Announcements- Implementation of Budget Announcement is a document indicating the status of implementation of the proposals made in the previous year’s Budget. (B) Technical documents in the Union Budget: Annual Financial Statement – Under Article 112 of the Constitution of India, a statement of estimated receipts and expenditure of the Government of India has to be laid before Parliament in
- 16. respect of every financial year. This statement, titled Annual Financial Statement, is the main Budget document. The Annual Financial Statement gives receipts and expenditure of the government for three consecutive years. Details of actual receipts and expenditures for the preceding year, revised estimates (RE) for the current year, and the budget estimates (BE) for the ensuing financial year are given in this document. Finance Bill Proposals in budget regarding the levy of new taxes, modifications in the existing tax structure or continuance of existing tax rates for further period are presented through the Finance Bill. The Finance Bill is presented to the Parliament immediately after the presentation of the Budget. Explanatory Memorandum to the Finance Bill A memorandum explaining the provisions in the Finance Bill is also made available. Demands for Grants Estimates of expenditure from the Consolidated Fund of India, which are required to get legislative approval, are submitted in form of Demands for Grants. The Demands for Grants are presented in the Lok Sabha along with the Budget statements. Usually one Demand for Grant is presented in respect of each Ministry or Department. However, in respect of large Ministries or Departments more than one demand is presented. Expenditure Budget (Vol. I and Vol. II) Expenditure budget volume I gives revenue and capital expenditure of various ministries and departments. The estimates are given under plan and non-plan heads. The expenditure estimates for various ministries and departments are given in detail in the Expenditure Budget volume II. The explanations given in Demand for Grants for proposed expenditure under various schemes/programmes are also included in this volume and, wherever needed, brief reasons for the variations in the estimates are also given. Receipts Budget Receipts Budget provides estimated income (receipts) of the government in detail. Estimates of receipts included in Annual Financial Statement are further analyzed in Receipts Budget. It gives details of revenue receipts, capital receipts and explains the estimates. Trends of receipts over the years and details of External Assistance received are also included in this document. Apart from the above mentioned documents, the following documents are now being presented with the Budget every year, as the Fiscal Responsibility and Budget Management Act requires the government to do so.
- 17. The Macro Economic Framework Statement The Medium Term Fiscal Policy Statement The Fiscal Policy Strategy Statement The Statement under Section 7 of the FRBM Act Understanding technical documents in the Budget The expenditure proposals in the Budget are classified either on the basis of Departments that will undertake the specific expenditures- for which there are Demands numbers, or on the basis of specific services which are delivered through a particular expenditure- for which there are Major Heads of account. Demand Nos.: The estimates of expenditure for various Ministries/Departments which need to be voted by the Parliament are submitted in the form of demand for grants. When a Ministry/Department is handling a number of different functions, a separate demand for each of its major functions is submitted. Each demand for grant shows the total amount required for a function during the year showing revenue and capital expenditure separately. The demands for grants are presented before the Lok Sabha along with the Budget statement. An important technicality to be noted here is that under Article 113 of the Constitution, no demand for grant (for any Ministry/Department) can be submitted except on the recommendation of the President. This means only the government can present a demand for grant and not the private members. It is noteworthy that when a demand for grant is presented, the Parliament can object to it, refuse it, reduce it, but cannot increase it. Examples from Union Budget Demand No. Ministry/ Department 1 Department of Agriculture and Cooperation 55 Dept. of Elementary Education and Literacy 56 Dept. of Secondary and Higher Education 93 Ministry of Tribal Affairs
- 18. Major Heads: Major heads are four digit codes, which have been allotted to specific services delivered by the government- following distinct patterns for revenue receipts, revenue expenditures, capital receipts and capital expenditures. If the first digit of the major head is "0" or "1" the Head of Account will represent Revenue Receipt , "2" or "3" will represent revenue expenditure, "4" or "5" Capital Account, "6" or "7" Loan and Advances, and "8" or "9" Public account . Examples: 0401 Crop Husbandry (Revenue Receipt) 2401 Crop Husbandry (Revenue Expenditure) 4401 Capital Outlay on Crop Husbandry (Capital Account) 6401 Loans for Crop Husbandry (Loan and advances account) 2210 Revenue account disbursement for Medical and Public Health 4210 Capital account disbursement for Medical and Public Health 6210 Loans for Medical and Public Health
- 19. “BUDGET SPEECH” Speech of P. Chidambaram Minister of Finance February 28, 2006 Mr. Speaker, Sir It is my privilege to present the Budget for the year 2006-07. 1. AN OVERVIEW OF THE ECONOMY 2. Twenty months ago, when I presented the first Budget of the UPA Government, I asked Honourable Members – and the people of this country – to walk with us on the path of honour and courage. The final report card on the first of the UPA Government is out, and there are reasons to celebrate. According to the Central Statistical Organization (CSO), the growth in 2004-05 was 7.5 per cent, with the manufacturing sector growing at 8.1 per cent. More importantly, at current market prices, gross domestic saving increased to 29.1 per cent of GDP and the rate of gross capital formation increased to 30.1 per cent of GDP.
- 20. “BUDGET HIGHLIGHTS” FLAGSHIP PROGRAMMES Allocation for eight flagship programmes to increase by 43.2 per cent from Rs.34,927 crore in 2005-06 to Rs.50,015 crore. North Eastern Region (NER): In addition 10 per cent of the Plan Budget of each Ministry/Department to be allocated for schemes and programmes in the North Eastern Region (NER); for the flagship programmes allocation of Rs.4,870 crore in 2006-07; total allocation for NER is Rs.12,041 crore. Sarva Siksha Abhiyan: 93 per cent of children in age group 6-14 years are in school, number of children not in school has come down to about one crore; outlay to increase from Rs.7,156 crore to Rs.10,041 crore in 2006- 07; 500,000 additional class rooms to be constructed and 150,000 more teachers to be appointed; Rs.8,746 crore to be transferred to the Prarambhik Siksha Kosh from revenues through education cess. Mid-day Meal Scheme: 12 crore children now covered; allocation to be enhanced from Rs.3,010 crore to Rs.4,816 crore.
- 21. “BUDGET A GLANCE” (In crore of Rupees) 2004-05 2005-06 2005-06 2006-07 Actuals Budget Estimates Revised Estimates Budget Estimates 1 Revenue Receipts 306013 351200 348474 403465 2 Tax Revenue (net to centre) 224798 273466 274139 327205 3 Non-Tax Revenue 81215 77734 74335 76260 4 Capital Receipts (5+6+7)$ 191669 163144 160231 160526 5 Recoveries of Loans 62043 12000 11700 8000 6 Other Receipts 4424 … 2356 3840 7 Borrowings and other liabilities $ 125202 151144 146175 148686 8 Total Receipts (1+4)$ 497682 514344 508705 563991 9 Non-Plan Expenditure 365406 370847 364914 391263 10 On Revenue Account of which, 296857 330530 326142 344430 11 Interest Payments 126934 133945 130032 139823 12 On Capital Account 68549 40317 38772 46833 13 Plan Expenditure 132276 143497 143791 172728 14 On Revenue Account 87495 115982 114153 143762 15 On Capital Account 44781 27515 29638 28966 16 Total Expenditure (9+13) 497682 514344 508705 563991 17 Revenue Expenditure (10+14) 384351 446512 440295 488192 18 Capital Expenditure (12+15) 113331 67832 68410 75799 19 Revenue Deficit (17-1) 78338 (2.5) 95312 (2.7) 91821 (2.6) 84727 (2.1) 20 Fiscal Deficit {16-(1+5+6)} 125202 (4.0) 151144 (4.3) 146175 (4.1) 148686 (3.8) 21 Primary Deficit (20-11) -1732 -(0.1) 17199 (0.5) 16143 (0.5) 8863 (0.2)
- 22. “ANNUAL FINANCIAL STATEMENT: REVENUE ACCOUNT RECEIPTS” (In crore of Rupees) Major Head Actuals 2004-05 Budget 2005-06 Revised 2005-06 Budget 2006-07 A TAX REVENUE (a) Taxes on Income and Expenditure 132024.21 176812.00 167073.00 206419.00 Corporation Tax 0020 82679.58 110573.00 103573.00 133010.00 Taxes on Income other than Corporation Tax 0021 49258.48 66239.00 63500.00 73409.00 Hotel Receipts Tax 0023 1.14 … … … Interest Tax 0024 49.85 … … … Other Taxes on Income and Expenditure 0028 35.16 … … … (b) Taxes on Property and Capital Transactions: 736.95 265.00 3004.00 4265.00 Estate Duty 0031 0.20 … … … Taxes on Wealth 0032 145.36 265.00 265.00 265.00 Gift Tax 0033 1.89 … … … Securities Transaction Tax 0034 589.50 … 2389.00 3500.00 Banking Cash Transaction Tax 0036 … … 350.00 500.00
- 23. “FINANCE BILL” AS INTRODUCED IN LOK SABHA ON 28TH FEBRUARY, 2006 Bill No. 16 of 2006 THE FINANCE BILL, 2006 A BILL to give effect to the financial proposals of the Central Government for the financial year 2006-07. BE it enacted by Parliament in the Fifty-seventh Year of the Republic of India as follows:- CHAPTER I PRELIMINARY 1. (1) This Act may be called the Finance Act, 2006. (2) Save as otherwise provided in this Act, sections 2 to 57 shall be deemed to have come into force on the 1st day of April 2006. CHAPTER II RATES OF INCOME –TAX 2. (1) Subject to the provisions of sub-sections (2) and (3), for the assessment year commencing on the 1st day of April, 2006, income-tax shall be charged at the rates specified in Part I of the First Scheduled and such tax as reduced by the rebate of income-tax calculated under Chapter VIII-A of the Income-tax Act, 1961 (hereinafter referred to as the Income-tax Act) shall be increased by a surcharge for purposes of the Union calculated in each case in the manner provided therein. (2) In the cases of which Paragraph A of Part I of the First Schedule applies, where the assessee has, in the previous year,
- 24. “MEMORANDUM” FINANCE BILL, 2006 PROVISIONS RELATING TO DIRECT TAXES The provisions in Finance Bill, 2006, in the sphere of direct taxes relate to the following matters:- (i) Prescribing the rates of income-tax on income liable to tax for the assessment year 2006-07; the rates at which tax will be deductible at source during the financial year 2006-07 from interest (including interest on securities), winnings from lotteries or crossword puzzles, winnings from horse races, card games and other categories of income liable to deduction or collection of tax at source under the income-tax Act; rates for computation of “advance tax”, deduction of income-tax from or payment of tax on ‘salaries’ and charging of income-tax on current incomes in certain cases for the financial year 2006-07. (ii) Amendment of the Income-tax Act, inter-alia, to rationalize and simplify the procedures, and widen the tax base. (iii) Amendment of the Wealth-tax Act to streamline the assessment procedure. 2. Subject to certain exceptions, which have been indicated while dealing with the relevant provisions, the Bill follows the principle that changes in the provisions of the tax laws, should ordinarily be made operative prospectively in relation to the current incomes and not in relation to the incomes of past years. The substance of the main provisions in the Bill relating to direct taxes is explained in the following paragraphs:-
- 25. RECEIPTS BUDGET PART A REVENUE RECEIPTS The statement below summarises, by broad categories, the estimates of revenue receipts for 2006-07. The estimates include the effect of Budget proposals. Further details by sections and heads of account, together with brief notes explaining the variation between the Budget and Revised Estimates, 2005-06 and between the latter and the Budget Estimates for 2006-07, are given in the notes that follow this Statement. In accordance with the constitution (Eightieth Amendment) Act, 2000, which has been given retrospective effect from 1.4.1998, all taxes referred to in the Union List, except the duties and taxes referred to in Articles 268 and 269, respectively, surcharge on taxes and duties referred to in Article 271 and any cess levied for specific purpose under any law made by Parliament, shall be levied and collected by the Government of India and shall be distributed between the Union and the States in such manner as may be prescribed by the President on the recommendations of the Finance Commission. For the period 2005-2010, the manner of distribution between the Centre and the States has been prescribed in Presidential Orders issued after considering the recommendations of the Twelfth Finance Commission. (In crore of Rupees) Budget 2005-06 Revised 2005-06 Budget 2006-07 1 Tax Revenue Corporation Tax 11573 103573 133010 Taxes on Income 66239 66239 77409 Wealth Tax 265 265 265 Customs 53182 64215 77066 Union Excise Duties 121533 112000 119000 Service Tax 17500 23000 34500 Taxes of Union Territories 733 849 903
- 27. “EXPENDITURE BUDGET- VOL II” MINISTRY OF HUMAN RESOURCE DEVELOPMENT DEMAND NO. 55 Department of Elementary Education and Literacy A. The Budget allocations, net of recoveries, are given below: (In crore of Rupees) Major Head Budget 2005-2006 Revised 2005-2006 Budget 2006-2007 Plan Non Plan Total Plan Non Plan Total Plan Non Plan Total Revenue 12531.76 4.77 12536.53 12531.86 4.65 12536.33 17128.0 4.71 17132.71 Capital … … … … … … … … … Total 12531.76 4.77 12536.53 12531.86 4.65 12536.33 17128.0 4.71 17132.7 1 Secretariat- Social Services 2251 … … … … … … … … … General Education Elementary Education 2 Strengthening of Teachers Training Institutions 2202 1.00 … 1.00 1.00 … 1.00 1.00 … 1.00 2251 0.30 … 0.30 0.30 … 0.30 0.30 … 0.30 3601 169.70 … 169.70 172.70 … 172.70 154.70 … 154.70 3602 9.00 … 9.00 6.00 … 6.00 6.00 … 6.00
- 28. Total 180.00 … 180.00 180.00 … 180.00 162.00 … 162.00 3 Shiksha Karmi Project in Rajasthan 2202 6.50 … 6.50 6.50 … 6.50 … … … 4 Mahila Samakhya 2202 29.85 … 29.85 23.85 … 23.85 29.85 … 29.85 2251 0.15 … 0.15 0.15 … 0.15 0.15 … 0.15 Total 30.00 … 30.00 24.00 … 24.00 30.00 … 30.00 5 National Bal Bhawan, New Delhi 2202 4.50 2.53 7.03 4.50 2.53 7.03 5.40 2.61 8.01 6 District Primary Education Programme (EAP) 2202 597.91 … 597.91 597.91 … 597.91 197.91 … 197.91 2251 2.09 … 2.09 2.09 … 2.09 2.09 … 2.09 Total 600.00 … 600.00 600.00 … 600.00 200.00 … 200.00 7 Nutritional Support to Primary Education (MDM) 2202 1164.70 … 1164.70 1164.70 … 1164.70 463.39 … 463.39 2251 … … … … … … 10.50 … 10.50 3601 1825.07 … 1825.07 1825.07 … 1825.07 1391.61 … 1391.61 3602 20.99 … 20.99 20.99 … 20.99 32.70 … 32.70 Total 3010.76 … 3010.76 3010.76 … 3010.76 1898.20 … 1898.20 8 Sarva Shiksha Abhiyan (SSA) 2202 7129.53 … 7129.53 7139.78 … 7139.58 4210.68 … 4210.68 2251 26.45 … 26.45 26.45 … 26.45 … … … 3601 0.01 … 0.01 0.01 … 0.01 0.01 … 0.01 3602
- 29. Total 7156.00 … 7156.00 7166.25 … 7166.25 4210.70 … 4210.70 9 Transfer to Prarambhik Shiksha Kosh (PSK) 2202 … … … … … … 8746.00 … 8746.00 10 Schemes financed from Prarambhik Shiksha Kosh (PSK) 10.1 Nutritional Support to Primary Education (MDM) 2202 … … … … … … 729.00 … 729.00 2251 … … … … … … … … … 3601 … … … … … … 2186.00 … 2186.00 3602 … … … … … … … … … Total … … … … … … 2915.00 … 2915.00 10.2 Sarva Shiksha Abhiyan (SSA) 2202 … … … … … … 5831.00 … 5831.00 2251 … … … … … … … … … 3601 … … … … … … … … … 3602 … … … … … … … … … Total … … … … … … 5831.00 … 5831.00 11 Amount met from Prarambhik Shiksha (PSK) 2202 … … … … … … -6560.00 … 6560.00 2251 … … … … … … … … … 3601 … … … … … … -2186.00 … 2186.00
- 30. 3602 … … … … … … … … … Total … … … … … … -8746.00 … 8746.00 12 National Council of Teacher Education 2202 4.50 … 4.50 0.25 … 0.25 0.45 … 0.45 13 Kasturba Gandhi Balika Vidayalaya 2202 225.00 … 225.00 225.00 … 225.00 115.20 … 115.20 3601 … … … … … … … … … 3602 … … … … … … … … … Total 225.00 … 225.00 225.00 … 225.00 115.20 … 115.20 Lumpsum Provisions for the Benefit of North Eastern Region and Sikkim …. …. …. …. …. …. Total Elementary Education 11217.3 2.5 11219.8 11217.3 2.5 11219.8 15367.9 2.6 15370.6
- 31. Session: Union and State Budgets from the lens of Children Children constitute about 42% of the total population of the country and often ignored and neglected group. All kind of public expenditure, meant for development of a community, can be expected to have some benefits for children as well. There exists a strong case for identifying that part of public expenditure which is meant specifically for addressing the needs of children; in other words segregating those programmes/schemes from all kinds of developmental programmes/schemes, which are specifically meant for addressing the needs of children. Motivation for Child Budget Analysis Governments prioritise between sectors/ departments/ objectives while spending money; Analysis of government budgets can reveal such priorities and also explain to a significant extent the progress across sectors/ departments/ objectives; Analysis of budget documents of the government can inform us about financial constraints in achieving desired policy goals; Examining budgetary processes (e.g. flow of funds) can also identify non-financial constraints in achieving desired outcomes from outlays. Pressing need for Child Budget Analysis and Advocacy in India. Ministries/ Departments undertaking child-specific programmes(in the Central Government): • Elementary Education & Literacy • Secondary Education & Higher Education • Women & Child Development
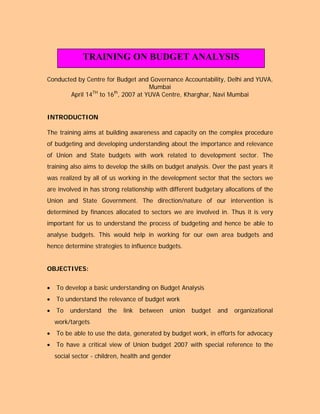
- 32. • Health & Family Welfare • Social Justice & Empowerment • Tribal Affairs • Youth Affairs & Sports • Labour & Employment • Rural Development • Expenditures by these Ministries/ Departments grouped into the four categories of: (a) Early Childhood Care & Development; (b) Child Health; (c) Child Education; and (d) Child Protection Analysis of Union Budget : 1. Total Allocations (%) for Child Specific Schemes in Union Budget as a proportion of Total Expenditure of Union Government
- 33. 2.11 2.05 2.2 2.54 4.17 4.86 0 2 4 6 8 10 12 14 16 18 20 2001- 02 (RE) 2002- 03 (RE) 2003- 04 (RE) 2004- 05 (RE) 2005- 06 (RE) 2006- 07 (BE) Year ChildBudgetas%ofTotalUnionBudget
- 34. 2. Sectoral Composition of the Total Outlay for Children in Union Budget in 2001-02 (BE) Child Protection 1% Child Health 13% Child Education 66% Early Childhood Care and Development 20%
- 35. Concerns: Magnitude of child budget in the Union Budgets has been very low, in comparison to the needs of children in the country. This magnitude has improved in 2005-06 and 2006-07 Growth in the magnitude of child budget at the level of Central Government has been mainly due to increases in spending on elementary education (mainly, SSA) and (to a smaller extent) due to increases in spending on ICDS. Child Education gets a very large chunk of allocations within total child budget in the Union Budget. Child Health and Protection of Children in difficult circumstances are most neglected in the Union Budget. Analysis of State Budget of Some States SN. State Outlays from the State Budget on Child-Specific schemes (approx.) Allocation (%) as a percentage of total outlay 1 Rajasthan Rs. 1760 16.4 2 Uttar Pradesh Rs. 1460 14.7 3 West Bengal Rs. 1170 13.3
- 36. Gender Issues and Union Budget The way in which national budgets in most countries are formulated, ignores the different, socially determined roles, responsibilities and capabilities of men and women. Gender sensitive budget analysis is needed to examine whether resources have been budgeted to implement a country’s commitment to improving the status of women Gender Budgets are NOT: A separate budget for women About spending the same on women and men Just about assessing programmes targeted specifically at Women and girls. Gender budgets are: A policy framework, A methodology and a set of tools to assist governments to integrate gender perspective into budget, Seek to expose assumptions of ‘gender neutrality’ within all economic policy raising awareness that budgets will impact differently on women and men because of the different social and economic positioning. Evolution of Gender Budgeting in India Seventh Plan (1985-90)
- 37. Declared as its objective, “to bring women into the mainstream of national development” 1985- Ministry of Human Resource Development set up DWCD 27 major women specific schemes and DWCD entrusted the task of monitoring their impact on women– genesis of GB Eighth Plan (1992-97) Paradigm shift– from development to empowerment of women For the first time highlighted the need to ensure a definite flow of funds from general developmental sectors to women It commented:“ …benefits should not bypass women and special programmes on women should complement the general development programmes. The latter in turn should reflect greater gender sensitivity” Ninth Plan (1997-2002) Stated Empowerment of Women as strategic obj Women’s Component Plan- 30% of funds were sought to be ear-marked in all “women related” sectors Tenth Plan (2002-2007) Aims at initiating immediate action in tying up the two effective concepts of Women Component Plan and Gender Budgeting to play a complementary role to each other.
- 38. Initiatives by the Women & Child Department Issued Checklists / Guidelines for gender audit of public expenditure, consultations etc Framework a. Quantification of allocation of resources for women b. Gender Audit of policies of the Government c. Impact assessment of various schemes in the Union and State budgets d. Analyzing policies for their impact on status of women as reflected in Macro Indicators e. Institutionalizing the generation and collection of gender dis-aggregated data f. Consultations and Capacity building g. Promote gender equity in participation in decision making h. Formulation of Satellite accounts Gender Budgeting Statements in the Union Budget Documents Year No. of Demands Years Total magnitude of Gender Budgeting GB Statement presented in 2005-06 10 2005-06 BE Rs. 14,378.68 Crore (4.74%*)
- 39. GB Statement presented in 2006-07 24 2005-06 RE Rs. 24,240.51 Crore (4.77%*) 24 2006-07 BE Rs. 28,736.53 Crore (5.10%*) GB Statement presented in 2007-08 33 2006-07 RE Rs. 22,251.41 Crore (3.8%*) 33 2007-08 BE Rs. 31,177.96 Crore (4.8%*) Gender Budgeting from the lens of most marginalised women, 2007-08 BE Most marginalise d Women 7% Other Women 93%
- 40. Session Budget making as a Political Process Budget Cycle Formulation Enactment Execution Audit
- 41. Formulation: The Executive branch puts together the budget plan by taking into account the broad contours of economic growth, inflation and demographic factors that may influence the accounts. Such task is usually taken care of by the Budget Division of the Ministry of Finance. Ministry of finance seeks the relevant information and demands from different individual departments and other ministries Enactment The legislative branch of the government enacts the budget by approving it after a thorough debate in the parliament. It is a cardinal principle that no taxation can be levied and no expenditure incurred, without the prior approval of the Parliament. The journey of the budget through Parliament is the vital part of the process. In parliament, it goes through the following stages: 1. Presentation to the Legislature 2. General Discussion 3. Voting of Demand for Grants 4. Consideration and passing of the taxation proposals, that is, the Finance Bill Execution The government is responsible for the execution of the enacted budget. Often, budgets are not always implemented in the same form and manner they were approved. Sometimes, unexpected changes in receipts and sometimes the unexpected changes in the priorities make a case for changing the practical implementation procedure from the enacted ones. Audit This is the final stage of a budget cycle. It includes a number of activities that measures the extent to which the public resources are properly and effectively utilized. It is an integral part of the financial management system and ensures the best possible use of the public resources. At this stage, the performance is the judging parameter of the budgets. The Comptrller and Auditor General (CAG) of India audits government departments and the CAG reports are placed before the parliament and scrutinized by the Public Account Committee.
- 42. Budget making Process Income Plan August-September October November December December January February March Finalisation Consultation Spending Demands of Grants Union Cabinet Finance Ministry Union Cabinet Prime Minister Finance Minister Presentation of budget Parliament Line Ministries Treasury Ministers Planning Commission
- 43. Who influences our budget? Constitutional Actors Non-Constitutional Actors Government Actors Non-Govt. Actors Executive Members of Parliament and Committees Within the Parliament Finance Commission/ Constitutional Commissions/ Committees Planning Commission Bureaucracy Reserve Bank Govt. funded Research Institutions Civil Society Organisations Individuals- Industrialists (in groups or anyone) Rich farmers Lobby Industrial Lobby- CII, FICCI, ASSOCHAM etc. Media External Political Economy/Institions-IMF, World Bank, ADB
- 44. Civil Society Engagement in Budget Analysis Budget Formulation Performance Monitoring Civil Society Budget Review Budget Tracking
- 45. Budget as a Tool for Advocacy Rich/powerful people are very close to the resources and have control over resources where as Marginalised and poor people are very far off. They have very limited or no access to resources. Here comes the need for Budget advocacy. Budget analysis is very important to scrutinize the Government Budgets from any perspective and mere analysis of the Budgets alone cannot influence the policy making unless it is supported by proper public action or advocacy to promote the findings in public forums so as to influence the common mindset. Budget analysis is an advocacy tool for developing public understanding on policy priorities of the Government. This would eventually empower the people to seek Governments’ accountability. This process would provide us a large operative space that is unexplored to tactfully engage with the State, and this alternative mechanism using democratic space goes beyond traditional means of public activism. For effective Budget advocacy one should have complete information/knowledge on the Budget which can be acquired through Resources/ Rights Rich/ Powerful Middleclass Marginalised
- 46. study/analysis and experiences. Information/knowledge empowers people with the right to question, right to examine, right to audit, right to assess, etc. Strategizing Budget Analysis Strategy is a clear path from where you are to where you want to be Building blocks of strategy Where are you now? Where do you want to get to? How will you get from one to the other? The more specific the better Key components: Objectives: place where we want to get to Audience: who can make the change that you want Primary audiences: those who have the actual formal authority to deliver the goods Secondary audiences: those that influence the primary audiences (media, key political constituencies, etc.) Message: What the audiences need to hear to convince them Messengers: Whom do they need to hear it from? Experts Key constituencies Political power Authentic voices Actions How can we get the message delivered Convincing decision makers, media advocacy, public education, protests, jansunwais, etc. The best actions are those requiring the least effort and have the least negative consequences, BUT which still gets the job done