The document contains templates for timeline graphs that span different time periods from 4 to 12 years. Each template includes boxes for each time period that can be filled in with descriptive text and metrics. The templates include options for formatting the data as bar graphs or line graphs. Overall, the document provides templates to help visualize and present timeline data over multiple years or months.
I summarised my experience, knowledge, skills and recommendations in a visual way...why not an infographic?!
Detail of each work experience and courses as well as all the recommendations are in my LinkedIn profile and in the pdf at bit.ly/mjserres-cv
Do you want to know more about me? about.me/mjserres
5 Internal Factors that Cause Licensing ComplexityBDNA Corporation
Β
Here are 5 internal factors that cause software licensing complexity in the enterprise. Without a data-driven approach to reducing licensing complexity, enterprises find it difficult to stay compliant and keep costs low. What other factors do you see? Feel free to comment below.
To learn more about managing complexity, check out 3 Ways to Cut the Cost and Pain of a Software Audit at http://bit.ly/1KlYb4y
Slack (or Teams) Automation for Bonterra Impact Management (fka Social Soluti...Jeffrey Haguewood
Β
Sidekick Solutions uses Bonterra Impact Management (fka Social Solutions Apricot) and automation solutions to integrate data for business workflows.
We believe integration and automation are essential to user experience and the promise of efficient work through technology. Automation is the critical ingredient to realizing that full vision. We develop integration products and services for Bonterra Case Management software to support the deployment of automations for a variety of use cases.
This video focuses on the notifications, alerts, and approval requests using Slack for Bonterra Impact Management. The solutions covered in this webinar can also be deployed for Microsoft Teams.
Interested in deploying notification automations for Bonterra Impact Management? Contact us at sales@sidekicksolutionsllc.com to discuss next steps.
GraphRAG is All You need? LLM & Knowledge GraphGuy Korland
Β
Guy Korland, CEO and Co-founder of FalkorDB, will review two articles on the integration of language models with knowledge graphs.
1. Unifying Large Language Models and Knowledge Graphs: A Roadmap.
https://arxiv.org/abs/2306.08302
2. Microsoft Research's GraphRAG paper and a review paper on various uses of knowledge graphs:
https://www.microsoft.com/en-us/research/blog/graphrag-unlocking-llm-discovery-on-narrative-private-data/
Securing your Kubernetes cluster_ a step-by-step guide to success !KatiaHIMEUR1
Β
Today, after several years of existence, an extremely active community and an ultra-dynamic ecosystem, Kubernetes has established itself as the de facto standard in container orchestration. Thanks to a wide range of managed services, it has never been so easy to set up a ready-to-use Kubernetes cluster.
However, this ease of use means that the subject of security in Kubernetes is often left for later, or even neglected. This exposes companies to significant risks.
In this talk, I'll show you step-by-step how to secure your Kubernetes cluster for greater peace of mind and reliability.
Kubernetes & AI - Beauty and the Beast !?! @KCD Istanbul 2024Tobias Schneck
Β
As AI technology is pushing into IT I was wondering myself, as an βinfrastructure container kubernetes guyβ, how get this fancy AI technology get managed from an infrastructure operational view? Is it possible to apply our lovely cloud native principals as well? What benefitβs both technologies could bring to each other?
Let me take this questions and provide you a short journey through existing deployment models and use cases for AI software. On practical examples, we discuss what cloud/on-premise strategy we may need for applying it to our own infrastructure to get it to work from an enterprise perspective. I want to give an overview about infrastructure requirements and technologies, what could be beneficial or limiting your AI use cases in an enterprise environment. An interactive Demo will give you some insides, what approaches I got already working for real.
UiPath Test Automation using UiPath Test Suite series, part 4DianaGray10
Β
Welcome to UiPath Test Automation using UiPath Test Suite series part 4. In this session, we will cover Test Manager overview along with SAP heatmap.
The UiPath Test Manager overview with SAP heatmap webinar offers a concise yet comprehensive exploration of the role of a Test Manager within SAP environments, coupled with the utilization of heatmaps for effective testing strategies.
Participants will gain insights into the responsibilities, challenges, and best practices associated with test management in SAP projects. Additionally, the webinar delves into the significance of heatmaps as a visual aid for identifying testing priorities, areas of risk, and resource allocation within SAP landscapes. Through this session, attendees can expect to enhance their understanding of test management principles while learning practical approaches to optimize testing processes in SAP environments using heatmap visualization techniques
What will you get from this session?
1. Insights into SAP testing best practices
2. Heatmap utilization for testing
3. Optimization of testing processes
4. Demo
Topics covered:
Execution from the test manager
Orchestrator execution result
Defect reporting
SAP heatmap example with demo
Speaker:
Deepak Rai, Automation Practice Lead, Boundaryless Group and UiPath MVP
Smart TV Buyer Insights Survey 2024 by 91mobiles.pdf91mobiles
Β
91mobiles recently conducted a Smart TV Buyer Insights Survey in which we asked over 3,000 respondents about the TV they own, aspects they look at on a new TV, and their TV buying preferences.
Elevating Tactical DDD Patterns Through Object CalisthenicsDorra BARTAGUIZ
Β
After immersing yourself in the blue book and its red counterpart, attending DDD-focused conferences, and applying tactical patterns, you're left with a crucial question: How do I ensure my design is effective? Tactical patterns within Domain-Driven Design (DDD) serve as guiding principles for creating clear and manageable domain models. However, achieving success with these patterns requires additional guidance. Interestingly, we've observed that a set of constraints initially designed for training purposes remarkably aligns with effective pattern implementation, offering a more βmechanicalβ approach. Let's explore together how Object Calisthenics can elevate the design of your tactical DDD patterns, offering concrete help for those venturing into DDD for the first time!
State of ICS and IoT Cyber Threat Landscape Report 2024 previewPrayukth K V
Β
The IoT and OT threat landscape report has been prepared by the Threat Research Team at Sectrio using data from Sectrio, cyber threat intelligence farming facilities spread across over 85 cities around the world. In addition, Sectrio also runs AI-based advanced threat and payload engagement facilities that serve as sinks to attract and engage sophisticated threat actors, and newer malware including new variants and latent threats that are at an earlier stage of development.
The latest edition of the OT/ICS and IoT security Threat Landscape Report 2024 also covers:
State of global ICS asset and network exposure
Sectoral targets and attacks as well as the cost of ransom
Global APT activity, AI usage, actor and tactic profiles, and implications
Rise in volumes of AI-powered cyberattacks
Major cyber events in 2024
Malware and malicious payload trends
Cyberattack types and targets
Vulnerability exploit attempts on CVEs
Attacks on counties β USA
Expansion of bot farms β how, where, and why
In-depth analysis of the cyber threat landscape across North America, South America, Europe, APAC, and the Middle East
Why are attacks on smart factories rising?
Cyber risk predictions
Axis of attacks β Europe
Systemic attacks in the Middle East
Download the full report from here:
https://sectrio.com/resources/ot-threat-landscape-reports/sectrio-releases-ot-ics-and-iot-security-threat-landscape-report-2024/
Builder.ai Founder Sachin Dev Duggal's Strategic Approach to Create an Innova...Ramesh Iyer
Β
In today's fast-changing business world, Companies that adapt and embrace new ideas often need help to keep up with the competition. However, fostering a culture of innovation takes much work. It takes vision, leadership and willingness to take risks in the right proportion. Sachin Dev Duggal, co-founder of Builder.ai, has perfected the art of this balance, creating a company culture where creativity and growth are nurtured at each stage.
Software Delivery At the Speed of AI: Inflectra Invests In AI-Powered QualityInflectra
Β
In this insightful webinar, Inflectra explores how artificial intelligence (AI) is transforming software development and testing. Discover how AI-powered tools are revolutionizing every stage of the software development lifecycle (SDLC), from design and prototyping to testing, deployment, and monitoring.
Learn about:
β’ The Future of Testing: How AI is shifting testing towards verification, analysis, and higher-level skills, while reducing repetitive tasks.
β’ Test Automation: How AI-powered test case generation, optimization, and self-healing tests are making testing more efficient and effective.
β’ Visual Testing: Explore the emerging capabilities of AI in visual testing and how it's set to revolutionize UI verification.
β’ Inflectra's AI Solutions: See demonstrations of Inflectra's cutting-edge AI tools like the ChatGPT plugin and Azure Open AI platform, designed to streamline your testing process.
Whether you're a developer, tester, or QA professional, this webinar will give you valuable insights into how AI is shaping the future of software delivery.
Software Delivery At the Speed of AI: Inflectra Invests In AI-Powered Quality
Β
Timeline graphs powerpoint presentation templates
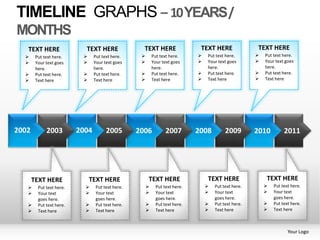
1. TIMELINE GRAPHS β 10 YEARS/
MONTHS
TEXT HERE TEXT HERE TEXT HERE TEXT HERE TEXT HERE
ο Put text here. ο Put text here. ο Put text here. ο Put text here. ο Put text here.
ο Your text goes ο Your text goes ο Your text goes ο Your text goes ο Your text goes
here. here. here. here. here.
ο Put text here. ο Put text here. ο Put text here. ο Put text here. ο Put text here.
ο Text here ο Text here ο Text here ο Text here ο Text here
2002 2003 2004 2005 2006 2007 2008 2009 2010 2011
TEXT HERE TEXT HERE TEXT HERE TEXT HERE TEXT HERE
ο Put text here. ο Put text here. ο Put text here. ο Put text here. ο Put text here.
ο Your text ο Your text ο Your text ο Your text ο Your text
goes here. goes here. goes here. goes here. goes here.
ο Put text here. ο Put text here. ο Put text here. ο Put text here. ο Put text here.
ο Text here ο Text here ο Text here ο Text here ο Text here
Your Logo
2. Get Unlimited Access to 100,000+ Powerpoint Pre-
designed Slides, Templates, Diagrams and Maps at
www.slidegeeks.net
- Bring Your Presentation to Life
- Amaze Your Audience
- Pitch Your Ideas Convincingly
Continue Browsing to View This Template
4. TIMELINE GRAPHS β 9 YEARS/
MONTHS
PUT TEXT PUT TEXT PUT TEXT PUT TEXT PUT TEXT
HERE HERE HERE HERE HERE
2003 2004 2005 2006 2007 2008 2009 2010 2011
PUT TEXT PUT TEXT PUT TEXT PUT TEXT
HERE HERE HERE HERE
Your Logo
6. TIMELINE GRAPHS β 8 YEARS/
MONTHS PUT TEXT HERE PUT TEXT HERE
β’ Put text here. β’ Put text here.
β’ Your text goes here. β’ Your text goes here.
β’ Put text here. β’ Put text here.
PUT TEXT HERE PUT TEXT HERE
β’ Put text here. β’ Put text here.
β’ Your text goes here. β’ Your text goes here.
β’ Put text here. β’ Put text here.
2004 2005 2006 2007 2008 2009 2010 2011
PUT TEXT HERE
PUT TEXT HERE PUT TEXT HERE
β’ Put text here.
β’ Put text here. β’ Put text here.
β’ Your text goes here.
β’ Your text goes here. β’ Your text goes here.
β’ Put text here.
β’ Put text here. PUT TEXT HERE β’ Put text here.
β’ Put text here.
β’ Put text here. β’ Your text goes here.
β’ Your text goes here. β’ Put text here.
β’ Put text here.
Your Logo
8. TIMELINE GRAPHS β 7 YEARS/
MONTHS
PUT TEXT PUT TEXT PUT TEXT PUT TEXT
HERE HERE HERE HERE
2004 2005 2006 2007 2008 2009 2010
PUT TEXT PUT TEXT PUT TEXT
HERE HERE HERE
Your Logo
10. TIMELINE GRAPHS β 6 YEARS/
MONTHS
PUT TEXT HERE PUT TEXT HERE PUT TEXT HERE
ο Put text here. ο Put text here. ο Put text here.
ο Your text goes ο Your text goes ο Your text goes
here. here. here.
ο Put text here. ο Put text here. ο Put text here.
ο Text here ο Text here ο Text here
2006 2007 2008 2009 2010 2011
PUT TEXT HERE PUT TEXT HERE PUT TEXT HERE
ο Put text here. ο Put text here. ο Put text here.
ο Your text goes ο Your text goes ο Your text goes
here. here. here.
ο Put text here. ο Put text here. ο Put text here.
ο Text here ο Text here ο Text here
Your Logo
11. TIMELINE GRAPHS β 6 YEARS/
MONTHS PUT TEXT HERE
ο Put text here.
ο Your text goes
here.
ο Put text here.
ο Text here
PUT TEXT HERE
ο Put text here.
ο Your text goes PUT TEXT HERE
here.
ο Put text here. ο Put text here.
ο Text here ο Your text goes
here.
ο Put text here.
ο Text here
PUT TEXT HERE
ο Put text here.
ο Your text goes PUT TEXT HERE
here.
ο Put text here. ο Put text here.
ο Text here ο Your text goes
here.
ο Put text here.
ο Text here
PUT TEXT HERE
ο Put text here.
ο Your text goes
here.
ο Put text here.
ο Text here Your Logo
13. TIMELINE GRAPHS β 5 YEARS/
MONTHS
PUT TEXT HERE
ο Put text here.
2011
ο Your text goes
here.
ο Put text here.
ο Text here
PUT TEXT HERE
2010 ο Put text here.
ο Your text goes
here.
ο Put text here.
PUT TEXT HERE
ο Text here
ο Put text here.
ο Your text goes
ο
here.
Put text here.
2009
ο Text here
PUT TEXT HERE
ο Put text here.
ο Your text goes
here.
ο
PUT TEXT HERE 2008 ο
Put text here.
Text here
ο Put text here.
ο Your text goes
here.
ο Put text here.
ο Text here
2007
Your Logo
14. TIMELINE GRAPHS β 5 YEARS/
MONTHS
PUT TEXT HERE PUT TEXT HERE PUT TEXT HERE
ο Put text here. ο Put text here. ο Put text here.
ο Your text goes ο Your text goes ο Your text goes
here. here. here.
ο Put text here. ο Put text here. ο Put text here.
ο Text here ο Text here ο Text here
2007 2008 2009 2010 2011
PUT TEXT HERE PUT TEXT HERE
ο Put text here. ο Put text here.
ο Your text goes ο Your text goes
here. here.
ο Put text here. ο Put text here.
ο Text here ο Text here
Your Logo
15. TIMELINE GRAPHS β 5 YEARS/
MONTHS
PUT TEXT HERE PUT TEXT HERE PUT TEXT HERE
ο Put text here. ο Put text here. ο Put text here.
ο Your text goes ο Your text goes ο Your text goes
here. here. here.
ο Put text here. ο Put text here. ο Put text here.
ο Text here ο Text here ο Text here
2007 2008 2009 2010 2011
PUT TEXT HERE PUT TEXT HERE
ο Put text here. ο Put text here.
ο Your text goes ο Your text goes
here. here.
ο Put text here. ο Put text here.
ο Text here ο Text here
Your Logo
17. TIMELINE GRAPHS β 4 YEARS/
MONTHS
PUT TEXT HERE PUT TEXT HERE
ο Put text here. ο Put text here.
ο Your text goes here. ο Your text goes here.
ο Put text here. ο Put text here.
ο Text here ο Text here
ο Put text here. ο Put text here.
ο Text here ο Text here
2008 2009 2010 2011
PUT TEXT HERE PUT TEXT HERE
ο Put text here. ο Put text here.
ο Your text goes here. ο Your text goes here.
ο Put text here. ο Put text here.
ο Text here ο Text here
ο Put text here. ο Put text here.
ο Text here ο Text here
Your Logo
18. TIMELINE GRAPHS β 4 YEARS/
MONTHS
PUT TEXT HERE PUT TEXT HERE
ο Put text here. ο Put text here.
ο Your text goes ο Your text goes
here. here.
ο Put text here. ο Put text here.
ο Text here ο Text here
2008 2009 2010 2011
PUT TEXT HERE PUT TEXT HERE
ο Put text here. ο Put text here.
ο Your text goes ο Your text goes
here. here.
ο Put text here. ο Put text here.
ο Text here ο Text here
Your Logo
20. TIMELINE GRAPHS β 12 YEARS/
MONTHS
PUT TEXT HERE PUT TEXT HERE PUT TEXT HERE PUT TEXT HERE PUT TEXT HERE PUT TEXT HERE
ο Put text here. ο Put text here. ο Put text here. ο Put text here. ο Put text here. ο Put text here.
ο Your text goes ο Your text ο Your text goes ο Your text ο Your text goes ο Your text goes
here. goes here. here. goes here. here. here.
ο Put text here. ο Put text here. ο Put text here. ο Put text here. ο Put text here. ο Put text here.
ο Text here ο Text here ο Text here ο Text here ο Text here ο Text here
Jan Feb Mar Apr May Jun Jul Aug Sep Oct Nov Dec
PUT TEXT HERE PUT TEXT HERE PUT TEXT HERE PUT TEXT HERE PUT TEXT HERE PUT TEXT HERE
ο Put text here. ο Put text here. ο Put text here. ο Put text here. ο Put text here. ο Put text here.
ο Your text goes ο Your text goes ο Your text goes ο Your text goes ο Your text goes ο Your text goes
here. here. here. here. here. here.
ο Put text here. ο Put text here. ο Put text here. ο Put text here. ο Put text here. ο Put text here.
ο Text here ο Text here ο Text here ο Text here ο Text here ο Text here
Your Logo
21. TIMELINE GRAPHS β 12 YEARS/
MONTHS
500
400
300
200
100
0
-100
-200
-300
-400
-500
Jan Feb Mar Apr May Jun Jul Aug Sep Oct Nov Dec
Your Logo
22. TIMELINE GRAPHS β 12 YEARS/
MONTHS
500
400
300
200
100
0
-100
-200
-300
-400
-500
Jan Feb Mar Apr May Jun Jul Aug Sep Oct Nov Dec
Your Logo
23. TIMELINE GRAPHS β 11 YEARS/
MONTHS
PUT TEXT PUT TEXT PUT TEXT PUT TEXT PUT TEXT PUT TEXT
HERE HERE HERE HERE HERE HERE
2001 2002 2003 2004 2005 2006 2007 2008 2009 2010 2011
PUT TEXT PUT TEXT PUT TEXT PUT TEXT PUT TEXT
HERE HERE HERE HERE HERE
Your Logo
26. All images are 100% editable in Powerpoint
βChange color, size and orientation of any icon to your likingβ
27. Edit Colorβ Inside the Group
2
1
3
1. Right click the object.
2. Choose Group and then Ungroup.
3. Click beside the object and drag the arrow over it.
28. Edit Color
1 2 3
1. Right click the object
2. Choose Format Shape in the dialog box
3. Choose βFillβ in the Format Shape box then βSolidβ or βGradientβ
depending on the appearance of the object. Change colour as
shown in the picture.