This document summarizes Olivier Morandi's talk on debugging and profiling Titanium apps. The talk introduces Ti Inspector, a tool that allows debugging Titanium apps using Chrome DevTools. It also discusses Node Inspector for debugging on Android and prototypes for profiling apps using Chrome's timeline and tracing features. Future work is planned to integrate these capabilities into a unified debugging and profiling tool.

![TICONF.US,NEWYORK,10/05/2014 10
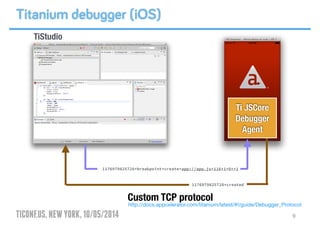
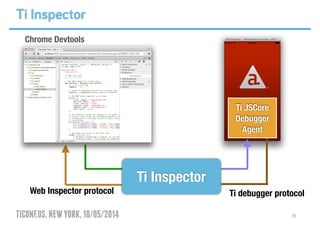
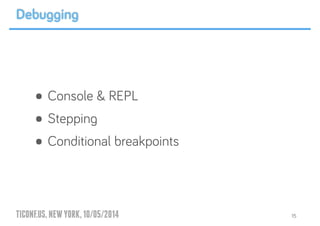
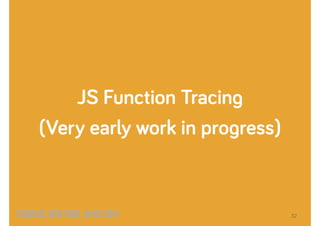
Chrome Remote Debugging
Chrome Devtools Inspected Page
JSON-RPC protocol over Websockets
{"method":"Debugger.setBreakpointByUrl","params":
{"lineNumber":32,"url":"todo-view.js","columnNumber":
0,"condition":""},"id":157}
{"result":{"breakpointId":"odo-view.js:32:0","locations":
[{"scriptId":"96","lineNumber":32,"columnNumber":7}]},"id":157}
https://developers.google.com/chrome-developer-tools/docs/debugger-protocol?hl=it](https://image.slidesharecdn.com/ticonf-140511155908-phpapp01/85/TiConf-US-2014-10-320.jpg)
![TICONF.US,NEWYORK,10/05/2014
$ [sudo] npm install -g ti-inspector
12
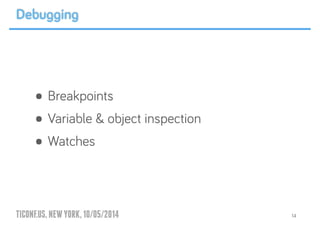
Ti Inspector - Install](https://image.slidesharecdn.com/ticonf-140511155908-phpapp01/85/TiConf-US-2014-12-320.jpg)
![TICONF.US,NEWYORK,10/05/2014
$ [sudo] npm install -g node-inspector
21
Node Inspector - Install](https://image.slidesharecdn.com/ticonf-140511155908-phpapp01/85/TiConf-US-2014-21-320.jpg)


![Titanium Studio [Updated - 18/12/2011]](https://cdn.slidesharecdn.com/ss_thumbnails/titanium-110713043027-phpapp01-thumbnail.jpg?width=640&height=640&fit=bounds)


