This document discusses the transformation of African agriculture that is likely to occur over the next two decades, mirroring Brazil's experience in recent decades. Key factors driving change include urbanization, the rise of large-scale "superfarms", a lack of legacy structures in African agriculture, and a desire for food security. The completion of the "BAC axis" between Brazil, Africa, and China will be important for global food security as China's food needs cannot be met by Brazil alone. Urbanization will create demand and capital for agricultural transformation. Large-scale industrialized farms are seen as inevitable and more efficient than smallholders. New thinking around sustainability, resource nationalism, and the future of aid will also influence African agriculture.


![77
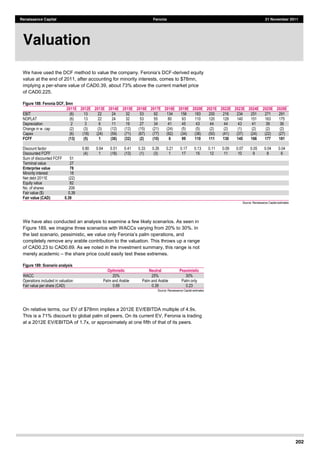
Renaissance Capital This other Eden 21 November 2011
questions is how to motivate farmers to adopt sustainability measures that are
beneficial to the environment and society considering that some of the measures
imply additional costs to farmers. Equally important is how to persuade businesses
and consumers to buy into these strategies in order to create a sustainable future.
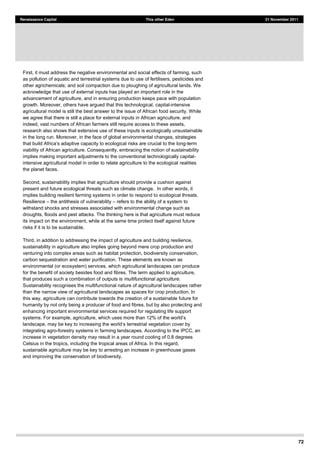
A range of measures is now used worldwide to bring various actors into the
sustainability agenda. These include the use of mandatory regulations and advisory
measures. Mandatory regulations imply that governments develop legislation that
compels agricultural producers and businesses to adopt sustainability measures.
-and-
agenda, increased attention is turning to the use of flexible economic instruments. In
particular, discussions on innovative measures to promote sustainability are
focusing on payments for ecosystem services from agriculture and the use of
premium pricing through eco-labelling. In the next section, we discuss how these
instruments work.
Direct payments for environmental measures
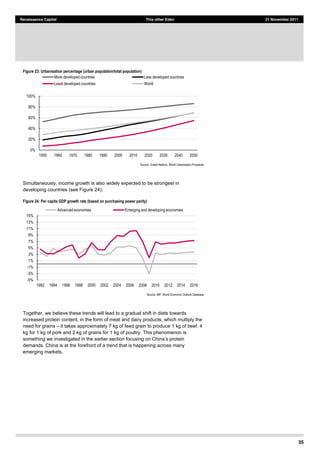
One of the mechanisms to have emerged to advance sustainable agriculture is the
use of direct financial rewards for farmers who incorporate environmental
sustainability measures into their farming systems. As already noted, sustainability
means that farmers should not only be considered as producers of food and fibres,
but also as providers of environmental services that benefit wider society. However,
note that while food and fibres have been produced traditionally for sale or
consumption, such that they are highly visible to the market, the same cannot be
said of environmental services from agricultural areas. For example, ecological
services that improve water and air quality can be enjoyed by everyone and are, in
effect, public goods. In addition, consumers are largely unaware about the role of
ecosystem services in their welfare. Under these circumstances, ecosystem
services have often been viewed as non-tradable goods, thus leaving farmers with
few incentives to protect or enhance them. The reality, however, is that these public
goods can easily be degraded and threaten human welfare. In this regard, it is
argued that there is a need to make markets for ecosystem services and
environmental products more visible to the all stakeholders. Mechanisms which
allow farmers to be paid for undertaking measures with environmental benefits are
ayments for ecosystem [or environmental] services
(PES). These provide financial incentives for farmers to adopt environmental
measures. The underlying premise is that farmers have to be paid for delivering a
public good as well as for opportunity costs incurred from undertaking environmental
measures in their farming systems.
While the market is said to be the major player in PES mechanisms, the reality is
that markets for ecosystem services from agricultural environments are still very
much undeveloped. In developed countries, most PES initiatives rely on public
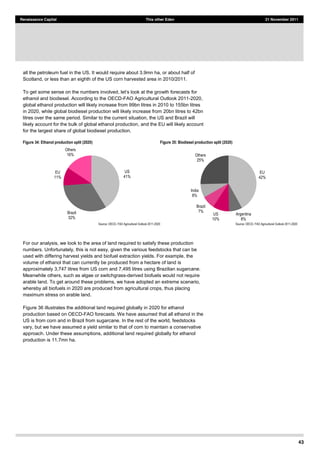
payment schemes. In the EU, for example, efforts to establish a sustainable
agriculture culture have resulted in the development of publicly funded agri-
environmental schemes in which farmers voluntarily agree to modify their
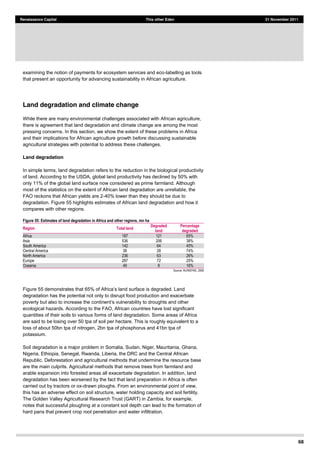
agricultural activities in favour of sustainability issues. Thus, some 30mn ha of land
(24% of available agriculture land) comes under some form of agri-environmental
measures. While the use of public funds for sustainable agriculture is feasible in
developed countries, we doubt whether the same can be done in developing
countries. In Africa, direct payments to farmers using public funds have yet to enter](https://image.slidesharecdn.com/2a0c6a82-7d2b-40f0-99f9-a496aca6626f-151222115000/85/This-other-Eden-78-320.jpg)

![94
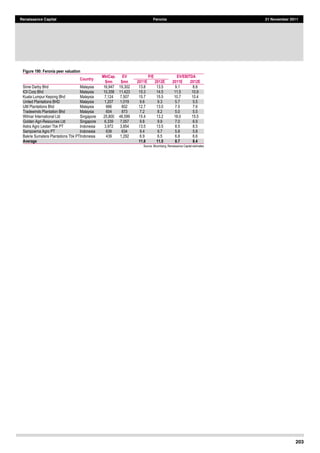
Renaissance Capital This other Eden 21 November 2011
the outcome. Despite the possibility to add value to the processing and movement of
blended foods, many commercial opportunities were overlooked because JAM did
not consider how to use this infrastructure to leverage commercial business
particularly in the agriculture value chain. The organisation kept coming back to the
same question: could it remain true to our mission and do business at the same
time?
In the debates over development aid, there are well-founded reasons to join the
bandwagon of critics. There is a deep and prestigious literature replete with
examples of how aid has failed to bring about positive change in the lives of those
ravaged by poverty. What JAM presents here, however, is not a tale of failure but
rather a vision for success borne out of decades of well-meaning but fundamentally
flawed aid programmes.
Criticism of development aid focuses on foreign bilateral government aid,
development industry contractors, humanitarian aid and pure charity. For
convenience, let us call this group the aid industry. Each of these four categories
ought to have an interdependent role to facilitate outcomes in favour of the
impoverished. Unfortunately, the aid industry has, for most of its history, either
misunderstood or misdirected the promise to help. Passion and energy that has
been spent over decades of unmet expectation needs to take a new approach.
Above all it needs to demonstrate that charitable aid is noble but investment [as aid]
is divine.
JAM has firm roots in humanitarian aid: its programmes focus on nutritional feeding,
school feeding, assistance to orphans and vulnerable children, the provision of water
and sanitation as well as skills development and community training. JAM believes
that without education there can be no development and without adequate
nutrition there cannot be effective education.
Feeding children, partnering with communities to address health and social issues
and providing comfort from the distress of poverty is widely accepted as,
instinctively, the right thing to do. However, this action alone is insufficient and
the current development aid model
promotes a myth of sustainability. In fact, pause to consider th
ised in the 1987 publication, Our Common Future.
It is actually a tautology that has defined two generations of development theory. It
stands to reason that if an aid programme is not sustainable, it is not development.
The term was composed originally to establish a link between meeting the needs of
become, however, the myth of development, because the theory was predicated on
the notion of aid as charity meeting the needs of the poor instead of being driven
by how to create wealth among developing nations to eradicate poverty.
Thus, donors and development practitioners today at the end of each funding
proposal are compelled to explain how the funds and activities will be sustainable--
the veritable Holy Grail of development. The reality is, however, that the current aid
model must integrate with the commercial sector. Six generations and an entire aid
industry have been predicated on giving at the expense of investing. Michael
The Road To Hell raised these issues as far back as 1997 and another
generation has continued to give in the intervening years.](https://image.slidesharecdn.com/2a0c6a82-7d2b-40f0-99f9-a496aca6626f-151222115000/85/This-other-Eden-95-320.jpg)


![158
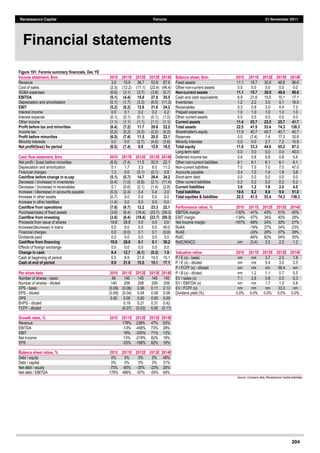
Renaissance Capital Zambeef 21 November 2011
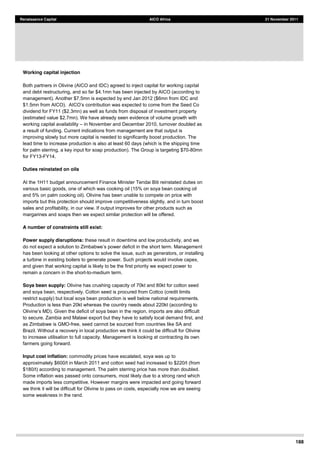
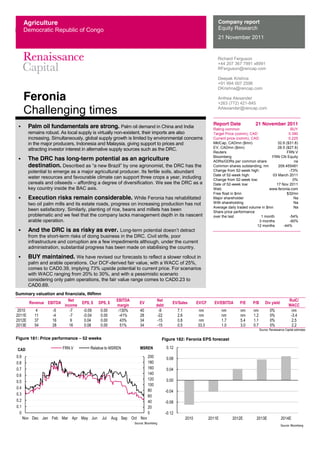
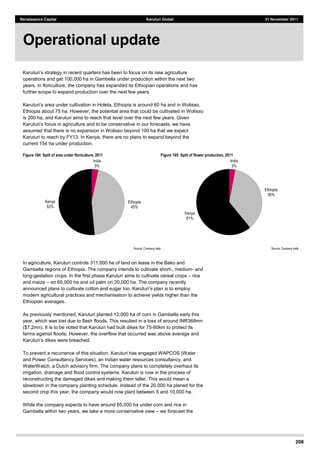
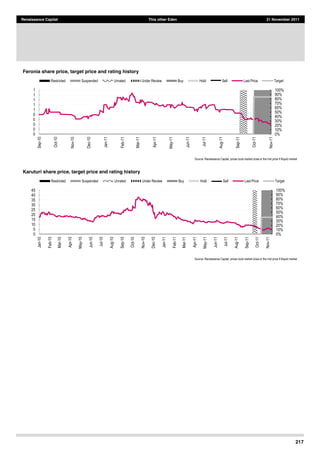
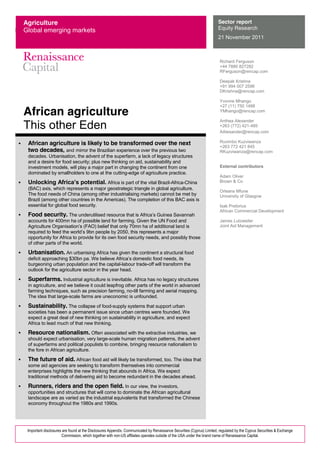
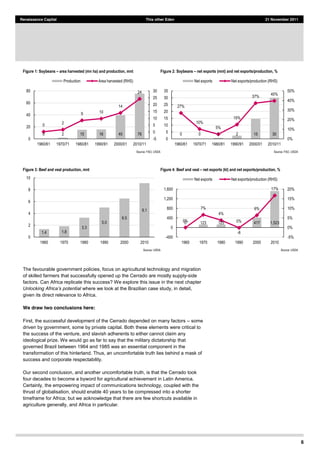
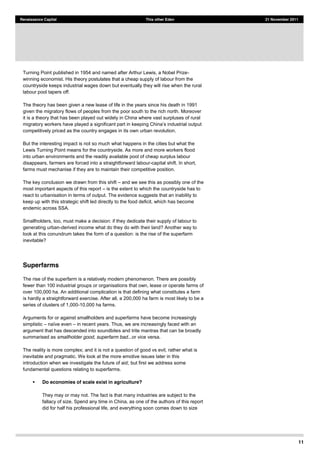
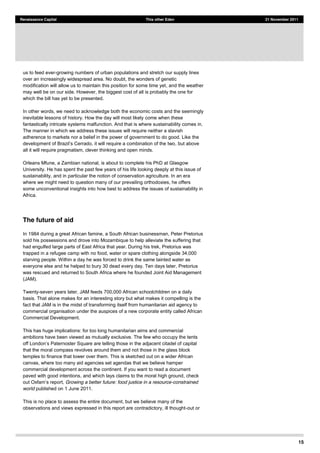
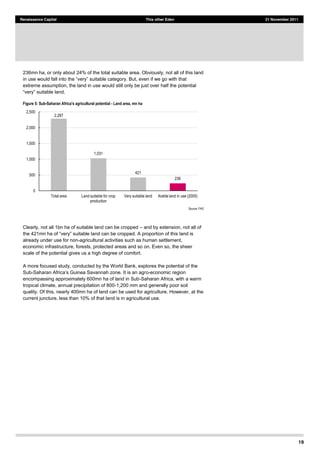
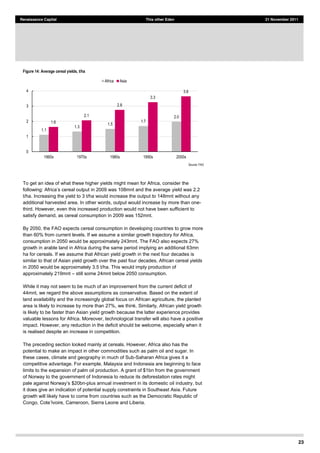
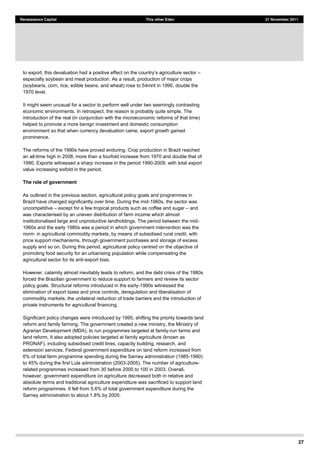
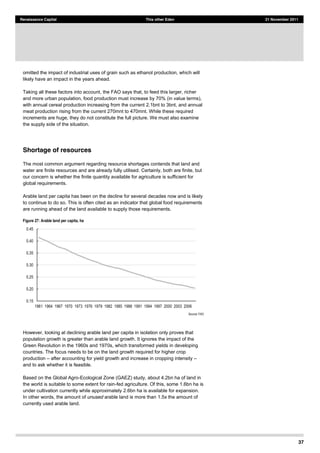
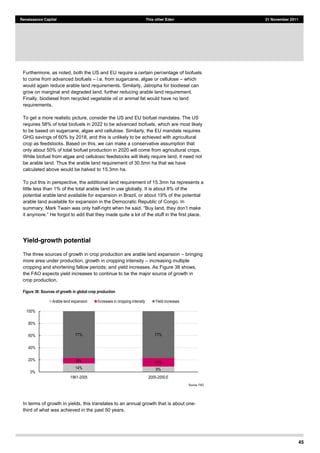
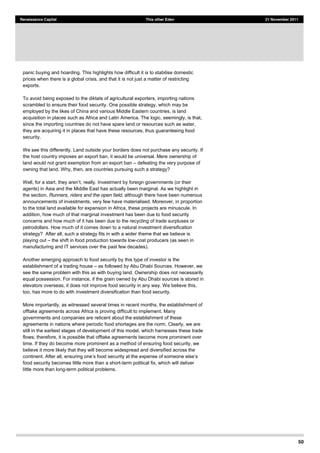
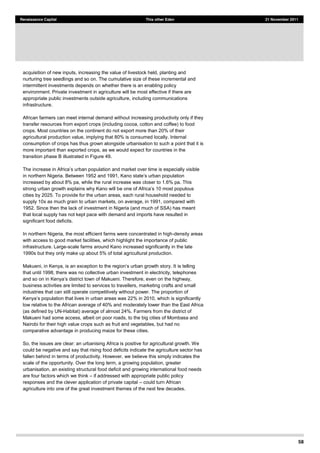
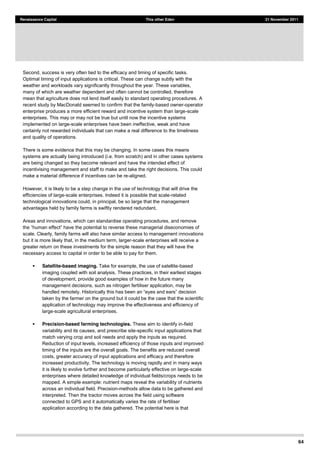
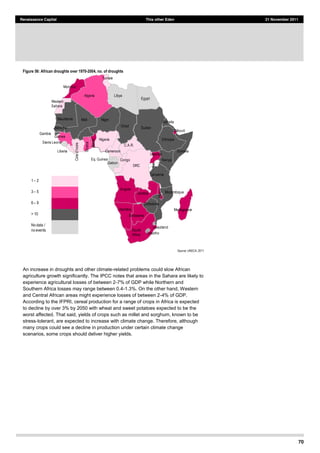
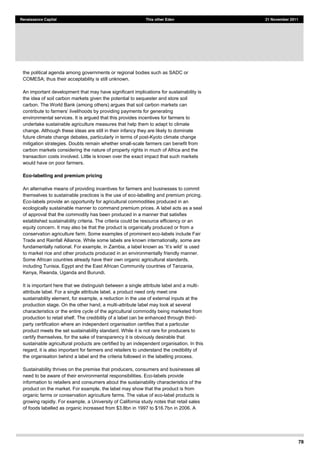
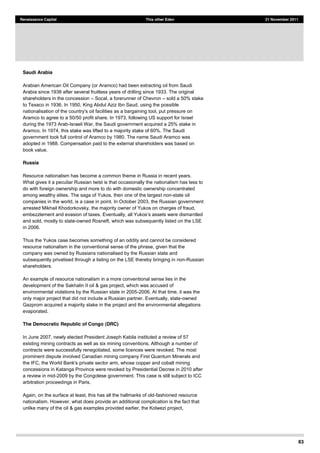
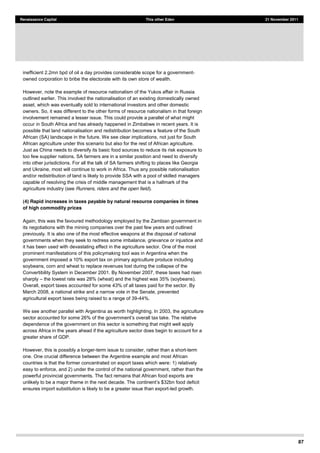
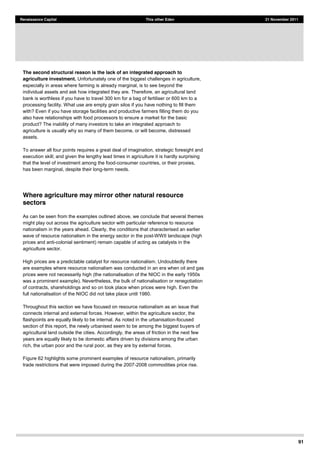
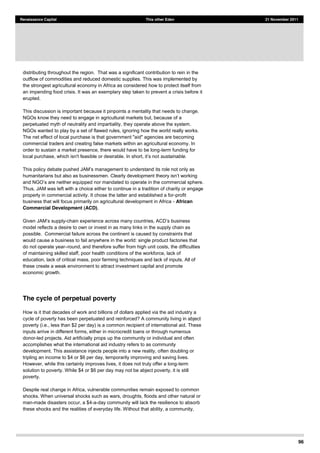
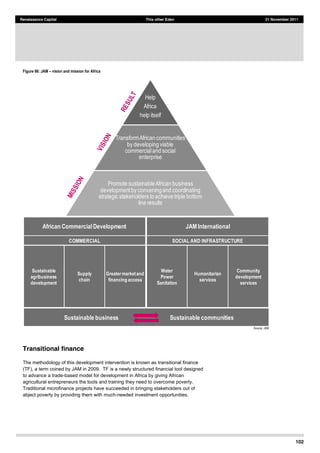
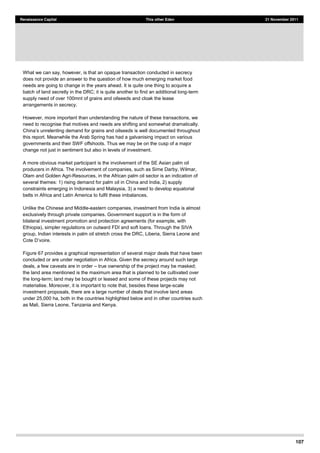
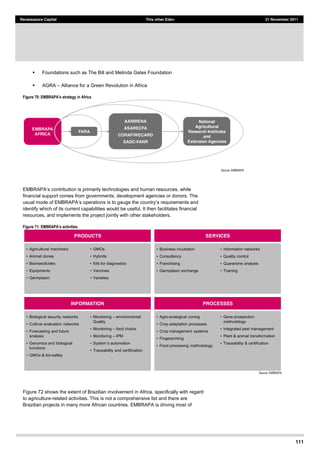
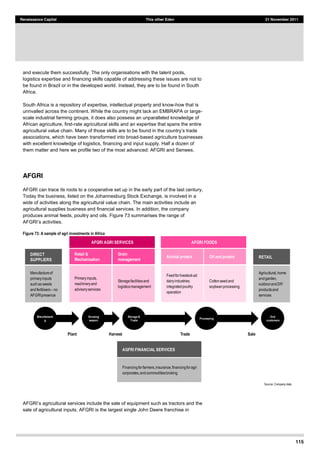
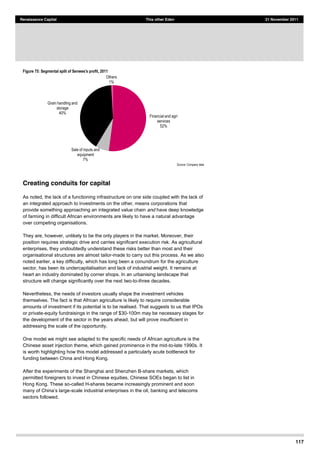
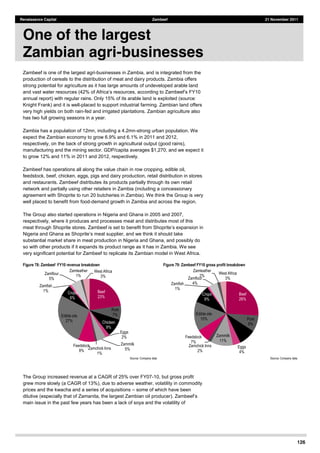
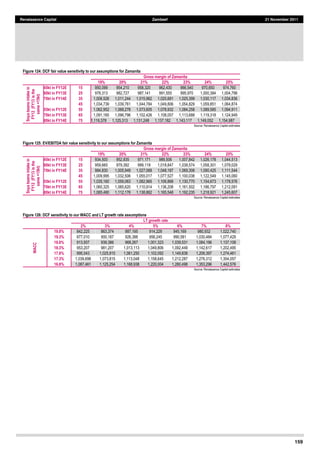
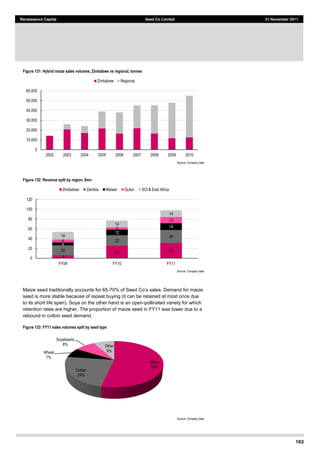
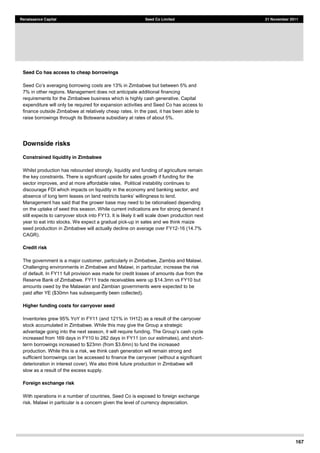
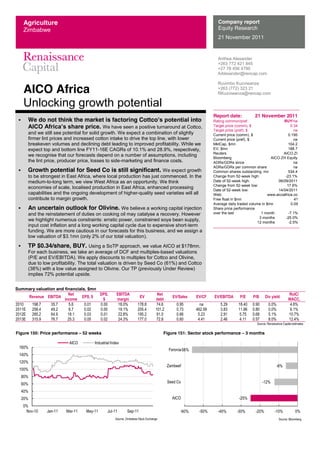
Figure 122: DCF fair value sensitivity to our assumptions in the crops division
Gross margin in the crops division
34% 36% 38% 40% 42% 44% 46%
Cerealoutputin
Zambeef'sexiting
farms
15,000 846,074 868,743 891,413 914,083 936,753 959,422 982,092
25,000 884,529 909,460 934,392 959,324 984,256 1,009,188 1,034,119
35,000 922,984 950,177 977,371 1,004,565 1,031,759 1,058,953 1,086,147
45,000 961,438 990,894 1,020,350 1,049,806 1,079,262 1,108,718 1,138,174
55,000 999,893 1,031,611 1,063,329 1,095,047 1,126,765 1,158,483 1,190,201
15,000 1,038,348 1,072,328 1,106,308 1,140,288 1,174,268 1,208,248 1,242,228
25,000 1,076,803 1,113,045 1,149,287 1,185,529 1,221,771 1,258,013 1,294,255
Source: Renaissance Capital estimates
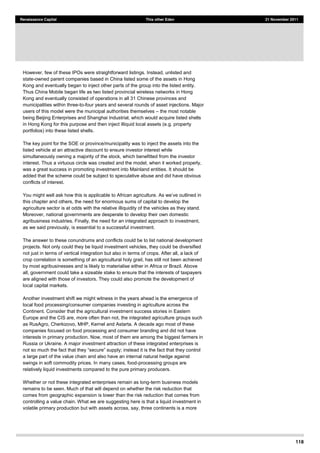
Figure 123: EV/EBITDA fair value sensitivity to our assumptions in the crops division
Gross margin in the crops division
34% 36% 38% 40% 42% 44% 46%
Cerealoutputin
Zambeef'sexiting
farms
15,000 828,108 854,901 881,694 908,486 935,279 962,072 988,864
25,000 876,003 905,613 935,223 964,833 994,443 1,024,054 1,053,664
35,000 923,898 956,326 988,753 1,021,180 1,053,608 1,086,035 1,118,463
45,000 971,793 1,007,038 1,042,283 1,077,527 1,112,772 1,148,017 1,183,262
55,000 1,019,688 1,057,750 1,095,812 1,133,874 1,171,937 1,209,999 1,248,061
15,000 1,067,583 1,108,463 1,149,342 1,190,221 1,231,101 1,271,980 1,312,860
25,000 1,115,478 1,159,175 1,202,872 1,246,568 1,290,265 1,333,962 1,377,659
Source: Renaissance Capital estimates
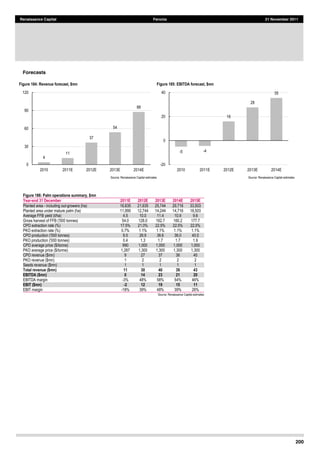
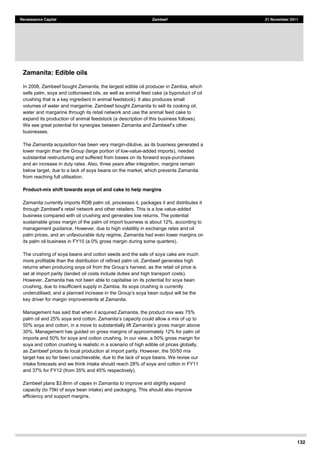
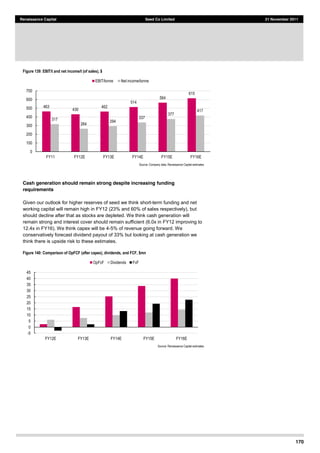
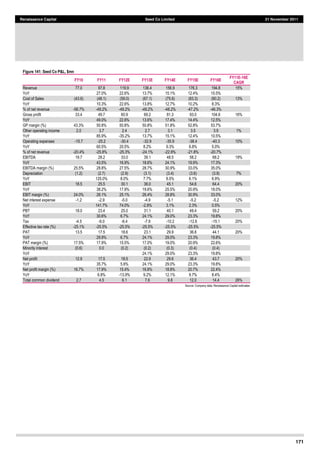
We have also made relatively conservative assumptions for the recovery of margins
at Zamanita: at 18% in FY11E, rising to 25% by FY13E. The margin at Zamanita
was 19% in FY08 and 24% in FY09, despite a limited intake of soya beans. The
,
adverse price progressions, an increase in import duties on palm oil as well as
losses on forward contracts for soya beans and soya cake. We have been cautious
on margins to factor in the risk of volatility in soya prices and potential losses on
hedging. However, management has commented that hedges on soya beans for
Zamanita were now covered by forward soya cake sales (excluding sales to
Novatek)
production will provide some protection, assuming Novatek has better pricing power
than Zamanita. The sensitivity analysis below shows the impact on our DCF and
multiples-based fair value if the margin in FY12 is different from our assumption of
22% (after FY12 we see it rising by 3 ppts in FY13 [base case 25%]).
We assume Zamanita will be able to purchase 45kt of soya beans in FY12 and 15kt
more in FY12 (the additional production from Mpongwe farms). The level of soya
segments higher in the value chain, and therefore the impact on our valuation for the
Group.
If Zambeef was able to secure 55kt of soya beans in FY12
was 2 ppts higher than our base-case forecasts, our DCF and multiples-based fair
values would increase 4% and 7%, respectively.](https://image.slidesharecdn.com/2a0c6a82-7d2b-40f0-99f9-a496aca6626f-151222115000/85/This-other-Eden-159-320.jpg)
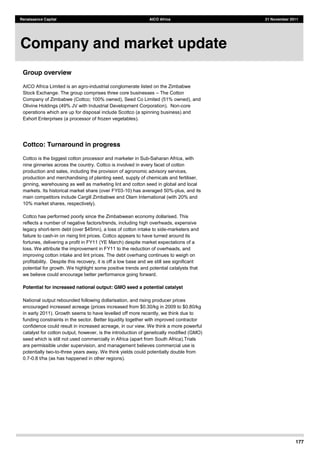
![179
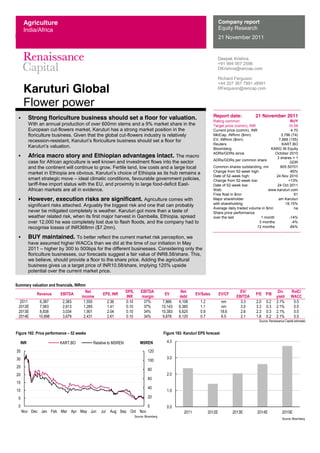
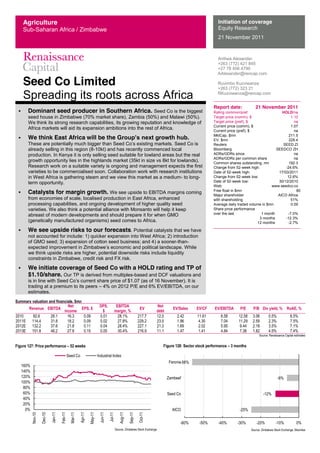
Renaissance Capital AICO Africa 21 November 2011
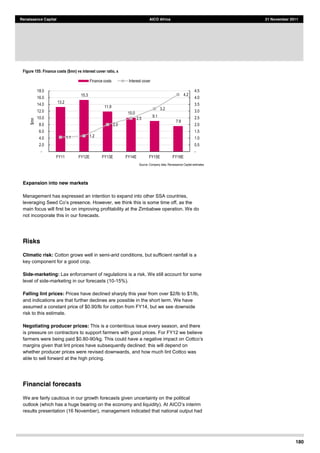
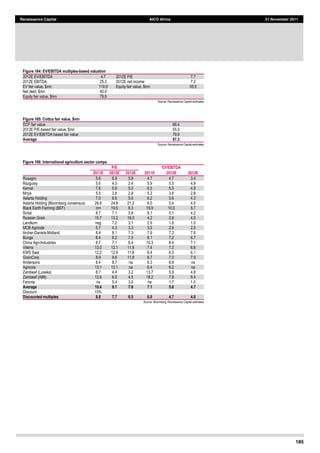
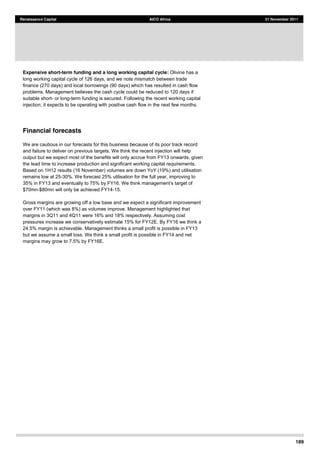
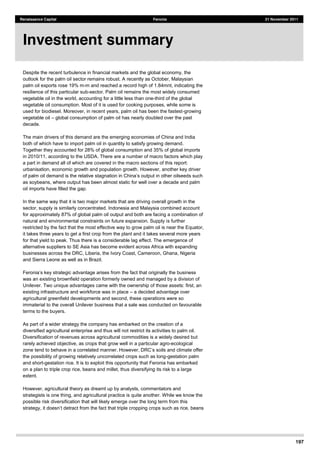
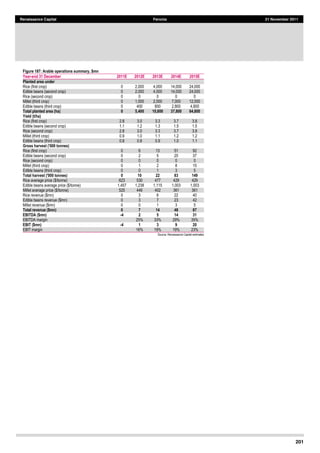
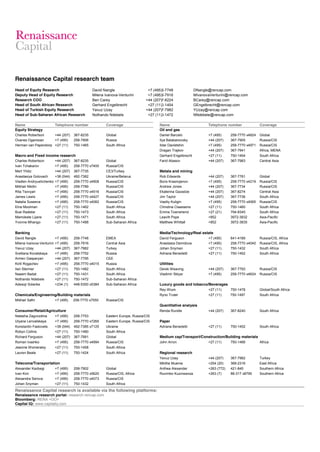
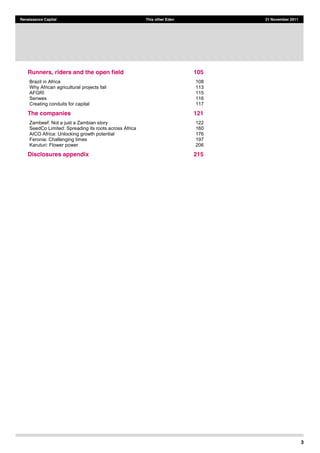
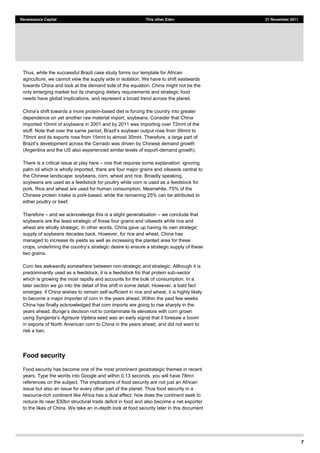
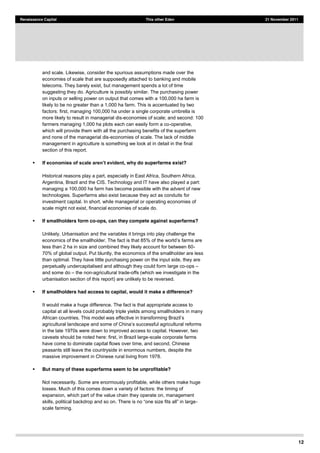
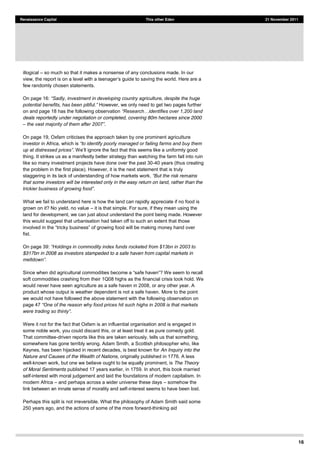
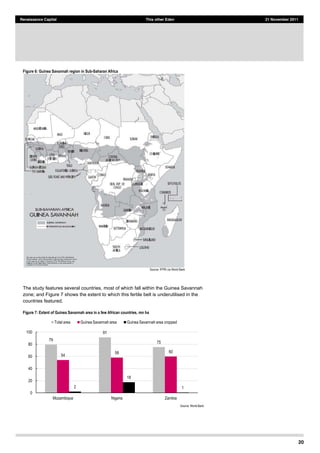
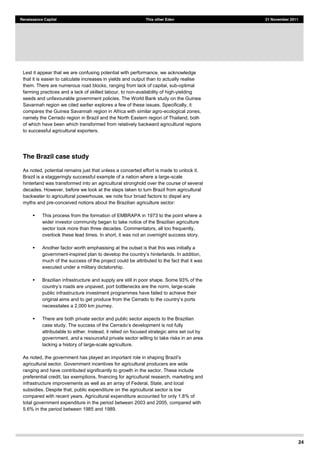
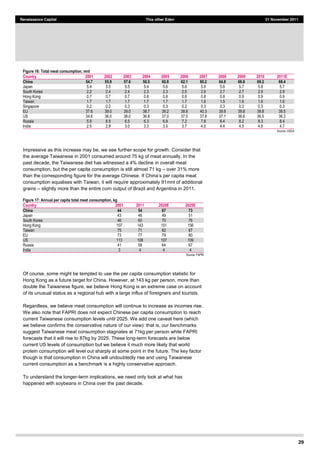
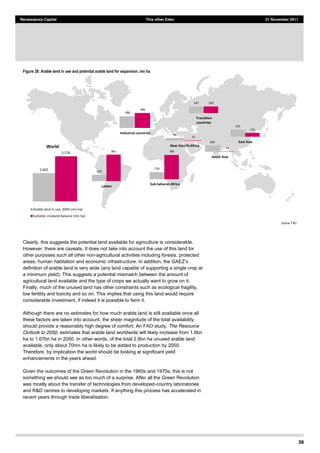
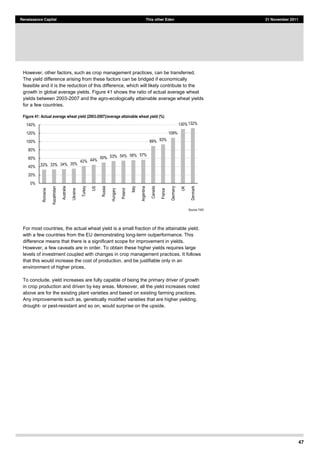
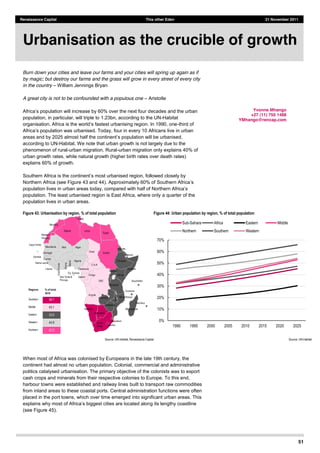
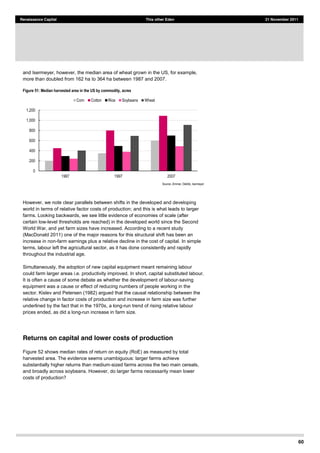
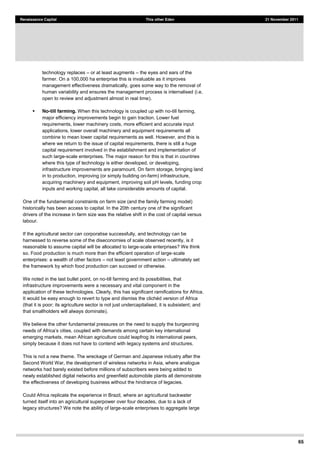
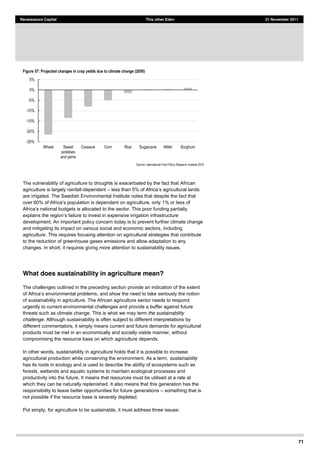
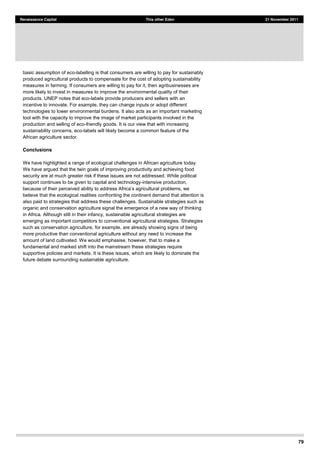
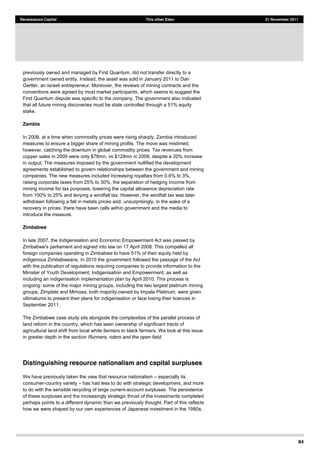
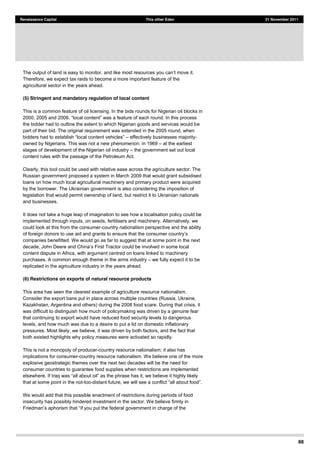
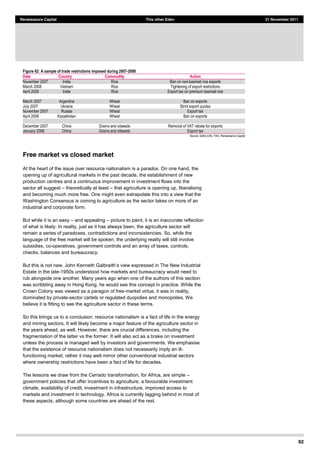
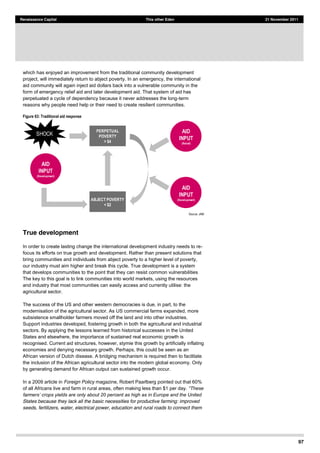
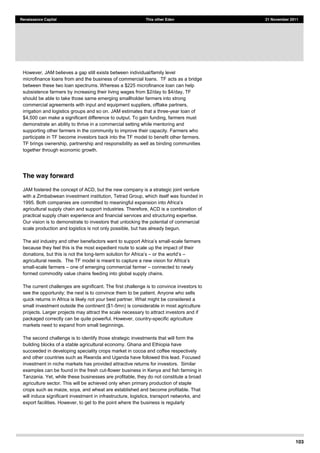
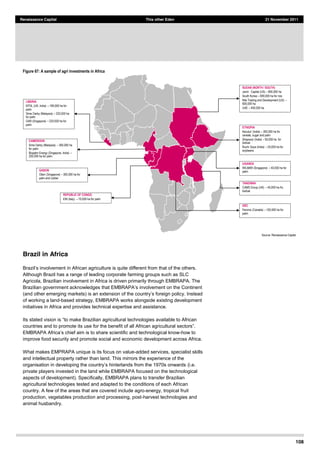
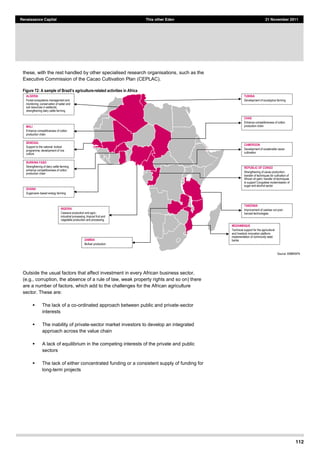
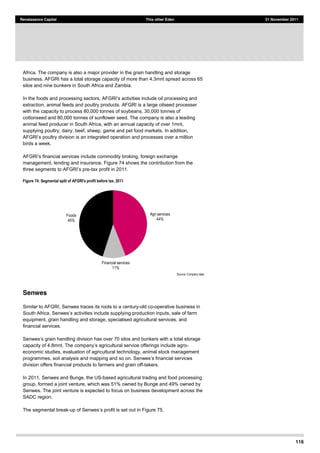
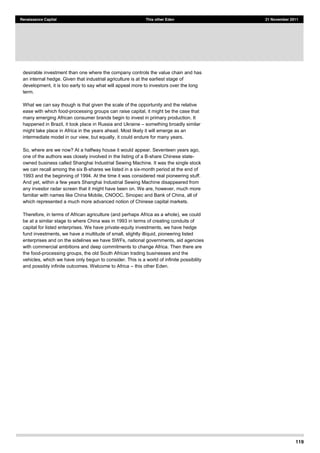
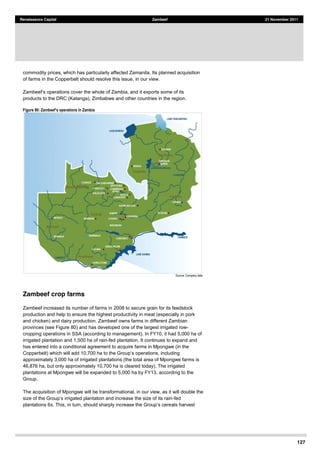
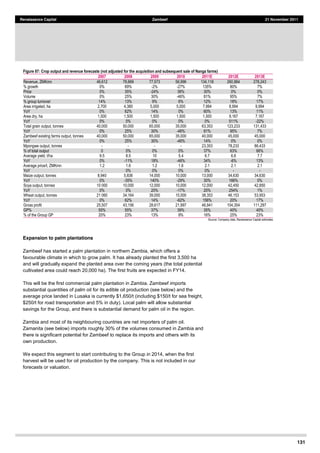
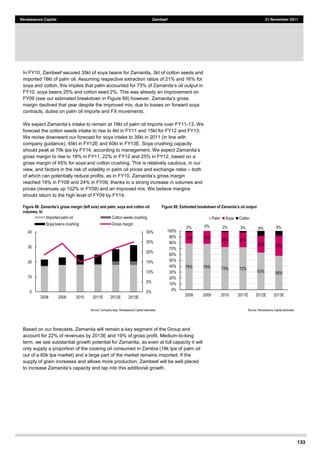
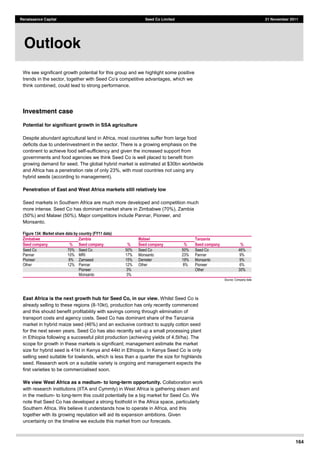
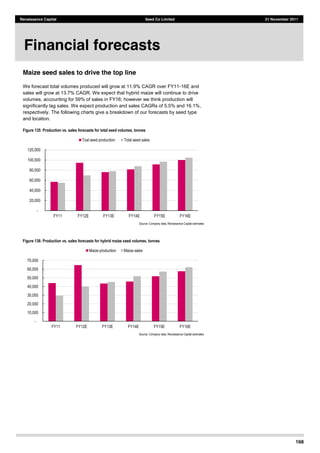
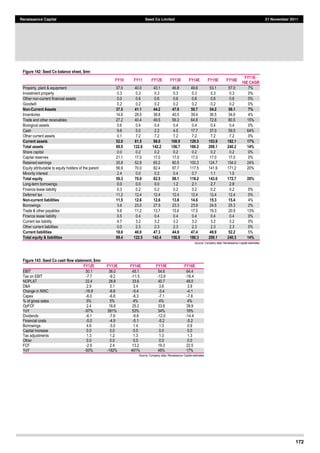
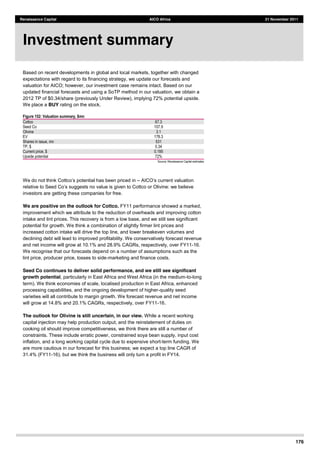
demand, supply constraints, as well as monetary easing which is likely to have an
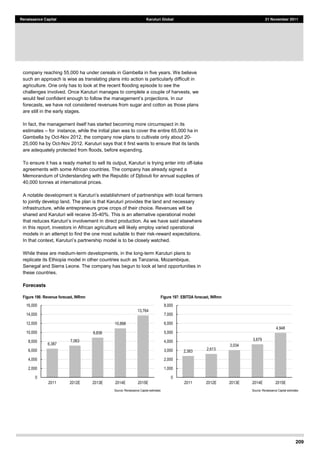
inflationary impact. To be conservative, we assume $1/lb for FY13 and $0.90/lb from
FY14 onwards.
Figure 154: Cotlook A Index, January 2001-September 2011
Source: National Cotton Council of America
Overheads reduced, benefits should continue to accrue in FY12
A voluntary retrenchment exercise saw permanent headcount reduced by more than
half (from 540 to 220) in FY11, with $2.7mn paid in severance packages (a non-
recurring cost). Break-even volumes are now significantly lower and we should
continue to see the benefits reflecting at the EBITDA line.
Elimination/restructuring of legacy short-term debt
-term legacy debt (annual revolving debt) is $38mn (it was
much higher previously but $15mn has been restructured with long-term debt and
$5mn paid off). Following pushback on a proposed equity raise, and given
challenges/delays in raising debt, management has earmarked proceeds from
disposals of non-core businesses to write down this debt. This will be complemented
by internally generated cash, and potentially long-term debt if it can be secured
(AICO was negotiating with lenders at the time of the FY11 results release [28 June
2011]). In June, management was estimating it would be out of the debt position in
12-18 months. We expect raising finance to remain a challenge in the near term,
and we understand that disposal of the non-core businesses is also proving
challenging. Therefore, we are relatively conservative in our forecasts, assuming a
gradual payoff using only internal resources. We think this could take closer to five
years and we estimate that the total debt balance will reduce to $12mn by FY16. We
forecast an improvement in interest cover from 1.1x in FY11 to 4.2x in FY16. We
think the reduction in finance costs alone will improve net margins by 2 ppts over
FY11-16.
0
50
100
150
200
250
Jan-01
May-01
Sep-01
Jan-02
May-02
Sep-02
Jan-03
May-03
Sep-03
Jan-04
May-04
Sep-04
Jan-05
May-05
Sep-05
Jan-06
May-06
Sep-06
Jan-07
May-07
Sep-07
Jan-08
May-08
Sep-08
Jan-09
May-09
Sep-09
Jan-10
May-10
Sep-10
Jan-11
May-11
Sep-11](https://image.slidesharecdn.com/2a0c6a82-7d2b-40f0-99f9-a496aca6626f-151222115000/85/This-other-Eden-180-320.jpg)