4
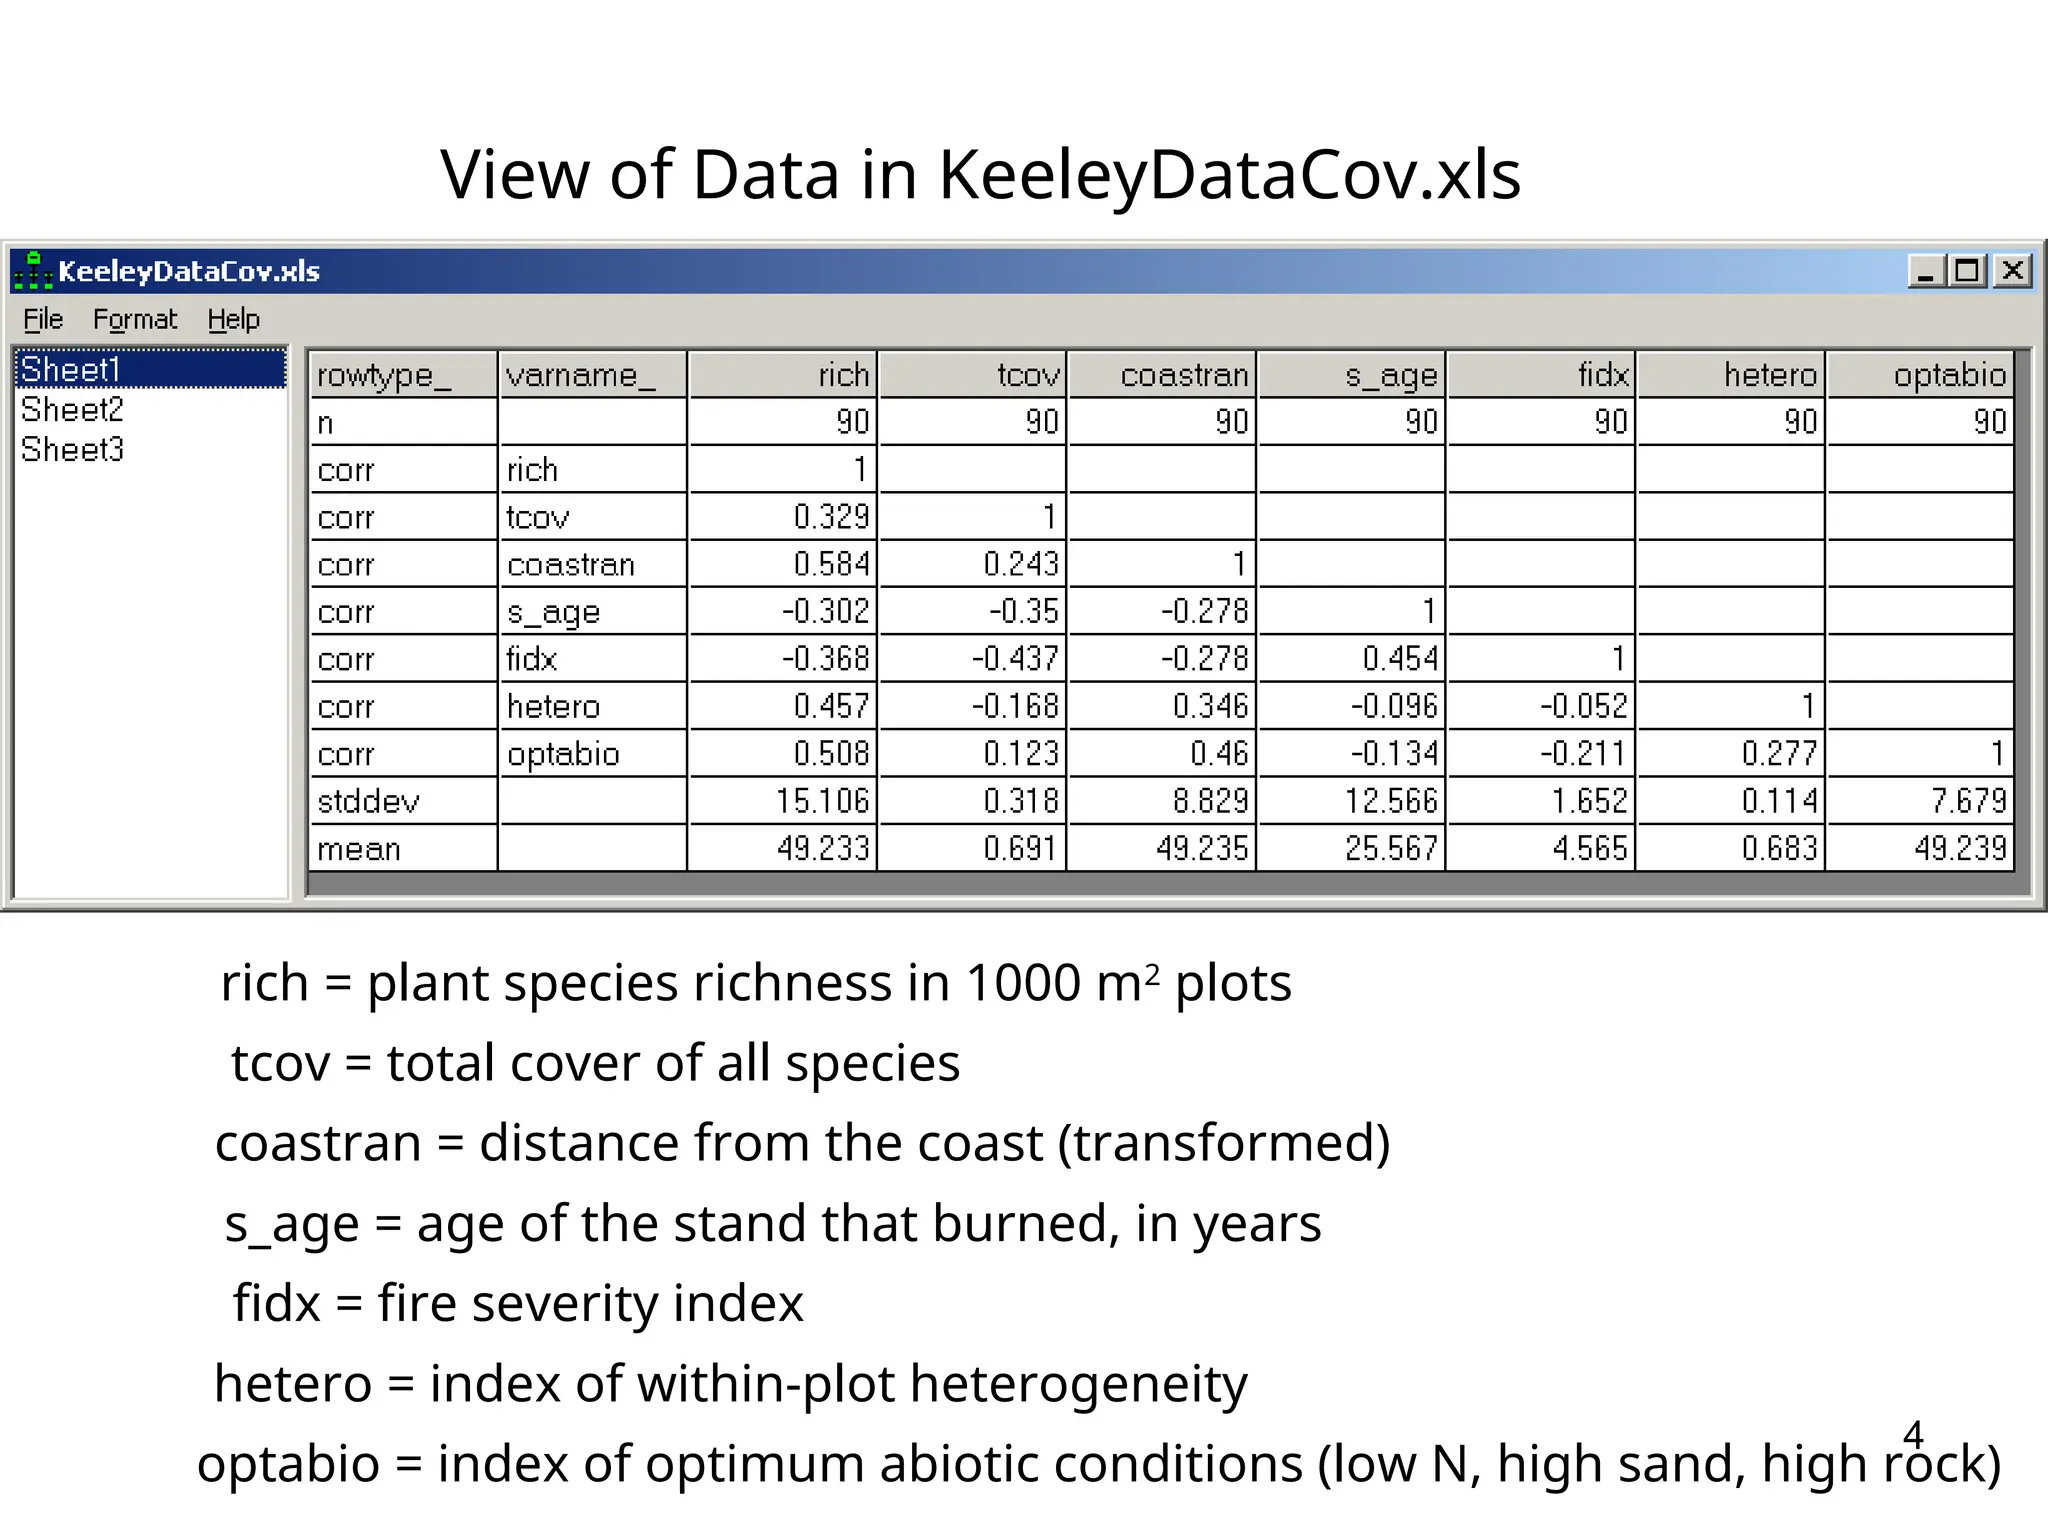
View of Datain KeeleyDataCov.xls
rich = plant species richness in 1000 m2
plots
tcov = total cover of all species
coastran = distance from the coast (transformed)
s_age = age of the stand that burned, in years
fidx = fire severity index
hetero = index of within-plot heterogeneity
optabio = index of optimum abiotic conditions (low N, high sand, high rock)
5.
5
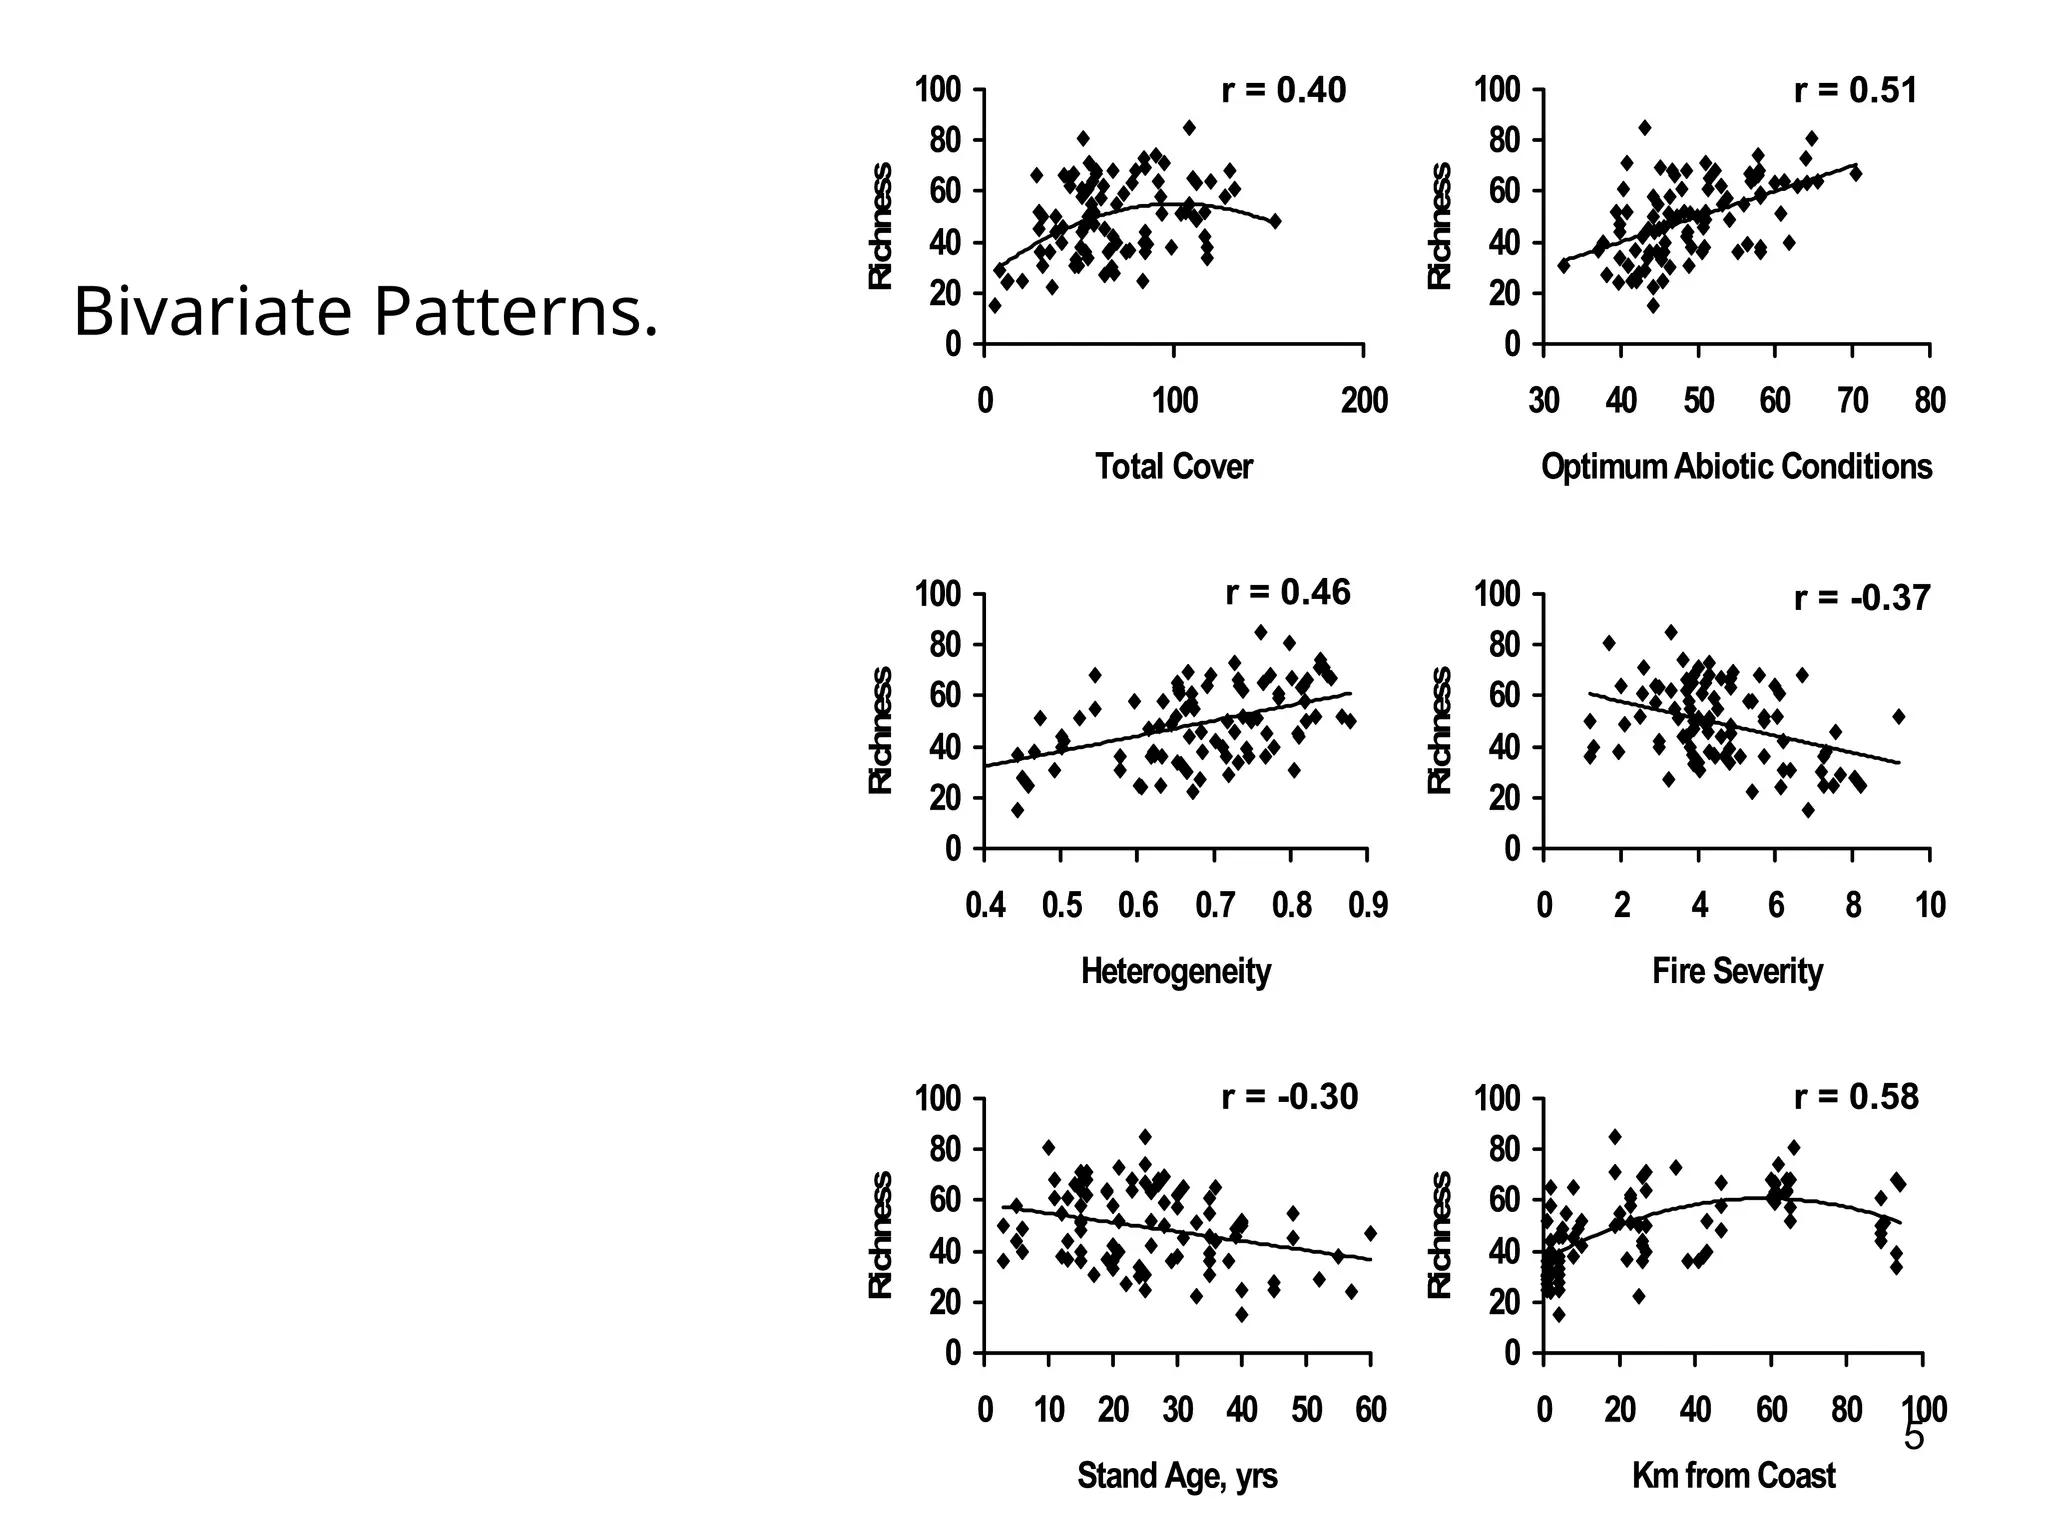
Bivariate Patterns. 0
20
40
60
80
100
0100 200
Total Cover
R
ichness
0
20
40
60
80
100
30 40 50 60 70 80
OptimumAbiotic Conditions
R
ichness
0
20
40
60
80
100
0.4 0.5 0.6 0.7 0.8 0.9
Heterogeneity
R
ichness
0
20
40
60
80
100
0 2 4 6 8 10
Fire Severity
R
ichness
0
20
40
60
80
100
0 10 20 30 40 50 60
Stand Age, yrs
R
ichness
0
20
40
60
80
100
0 20 40 60 80 100
Km from Coast
R
ichness
r = 0.51
r = 0.40
r = -0.37
r = 0.46
r = 0.58
r = -0.30
0
20
40
60
80
100
0 100 200
Total Cover
R
ichness
0
20
40
60
80
100
30 40 50 60 70 80
OptimumAbiotic Conditions
R
ichness
0
20
40
60
80
100
0.4 0.5 0.6 0.7 0.8 0.9
Heterogeneity
R
ichness
0
20
40
60
80
100
0 2 4 6 8 10
Fire Severity
R
ichness
0
20
40
60
80
100
0 10 20 30 40 50 60
Stand Age, yrs
R
ichness
0
20
40
60
80
100
0 20 40 60 80 100
Km from Coast
R
ichness
r = 0.51
r = 0.40
r = -0.37
r = 0.46
r = 0.58
r = -0.30
6.
6
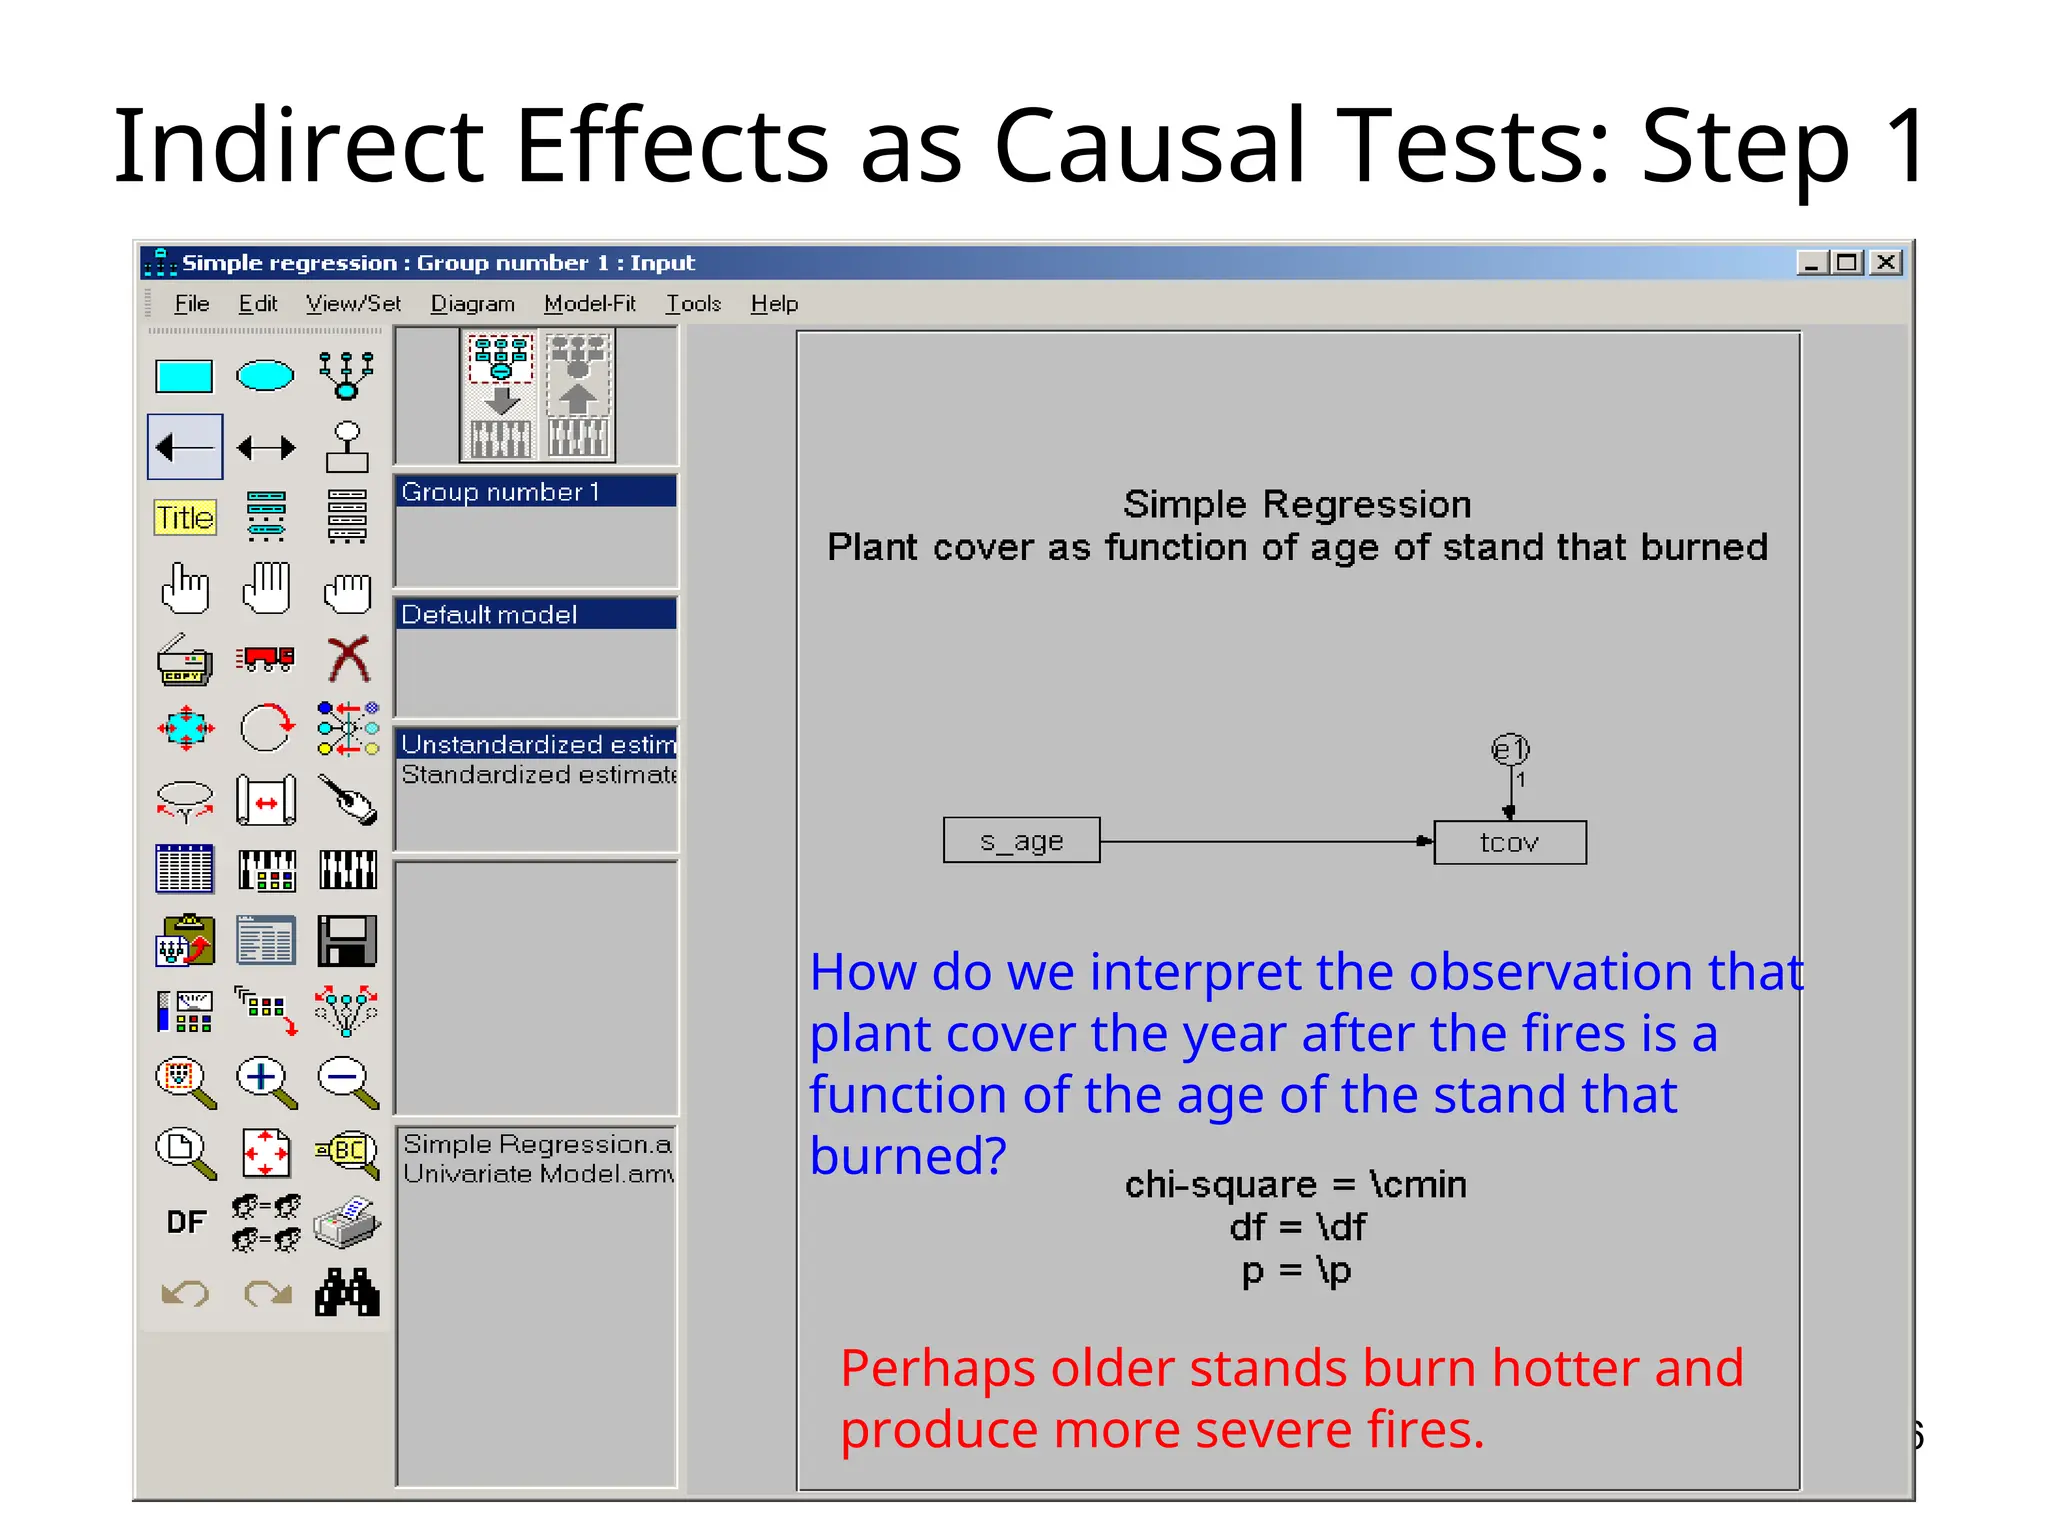
Indirect Effects asCausal Tests: Step 1
How do we interpret the observation that
plant cover the year after the fires is a
function of the age of the stand that
burned?
Perhaps older stands burn hotter and
produce more severe fires.
7.
7
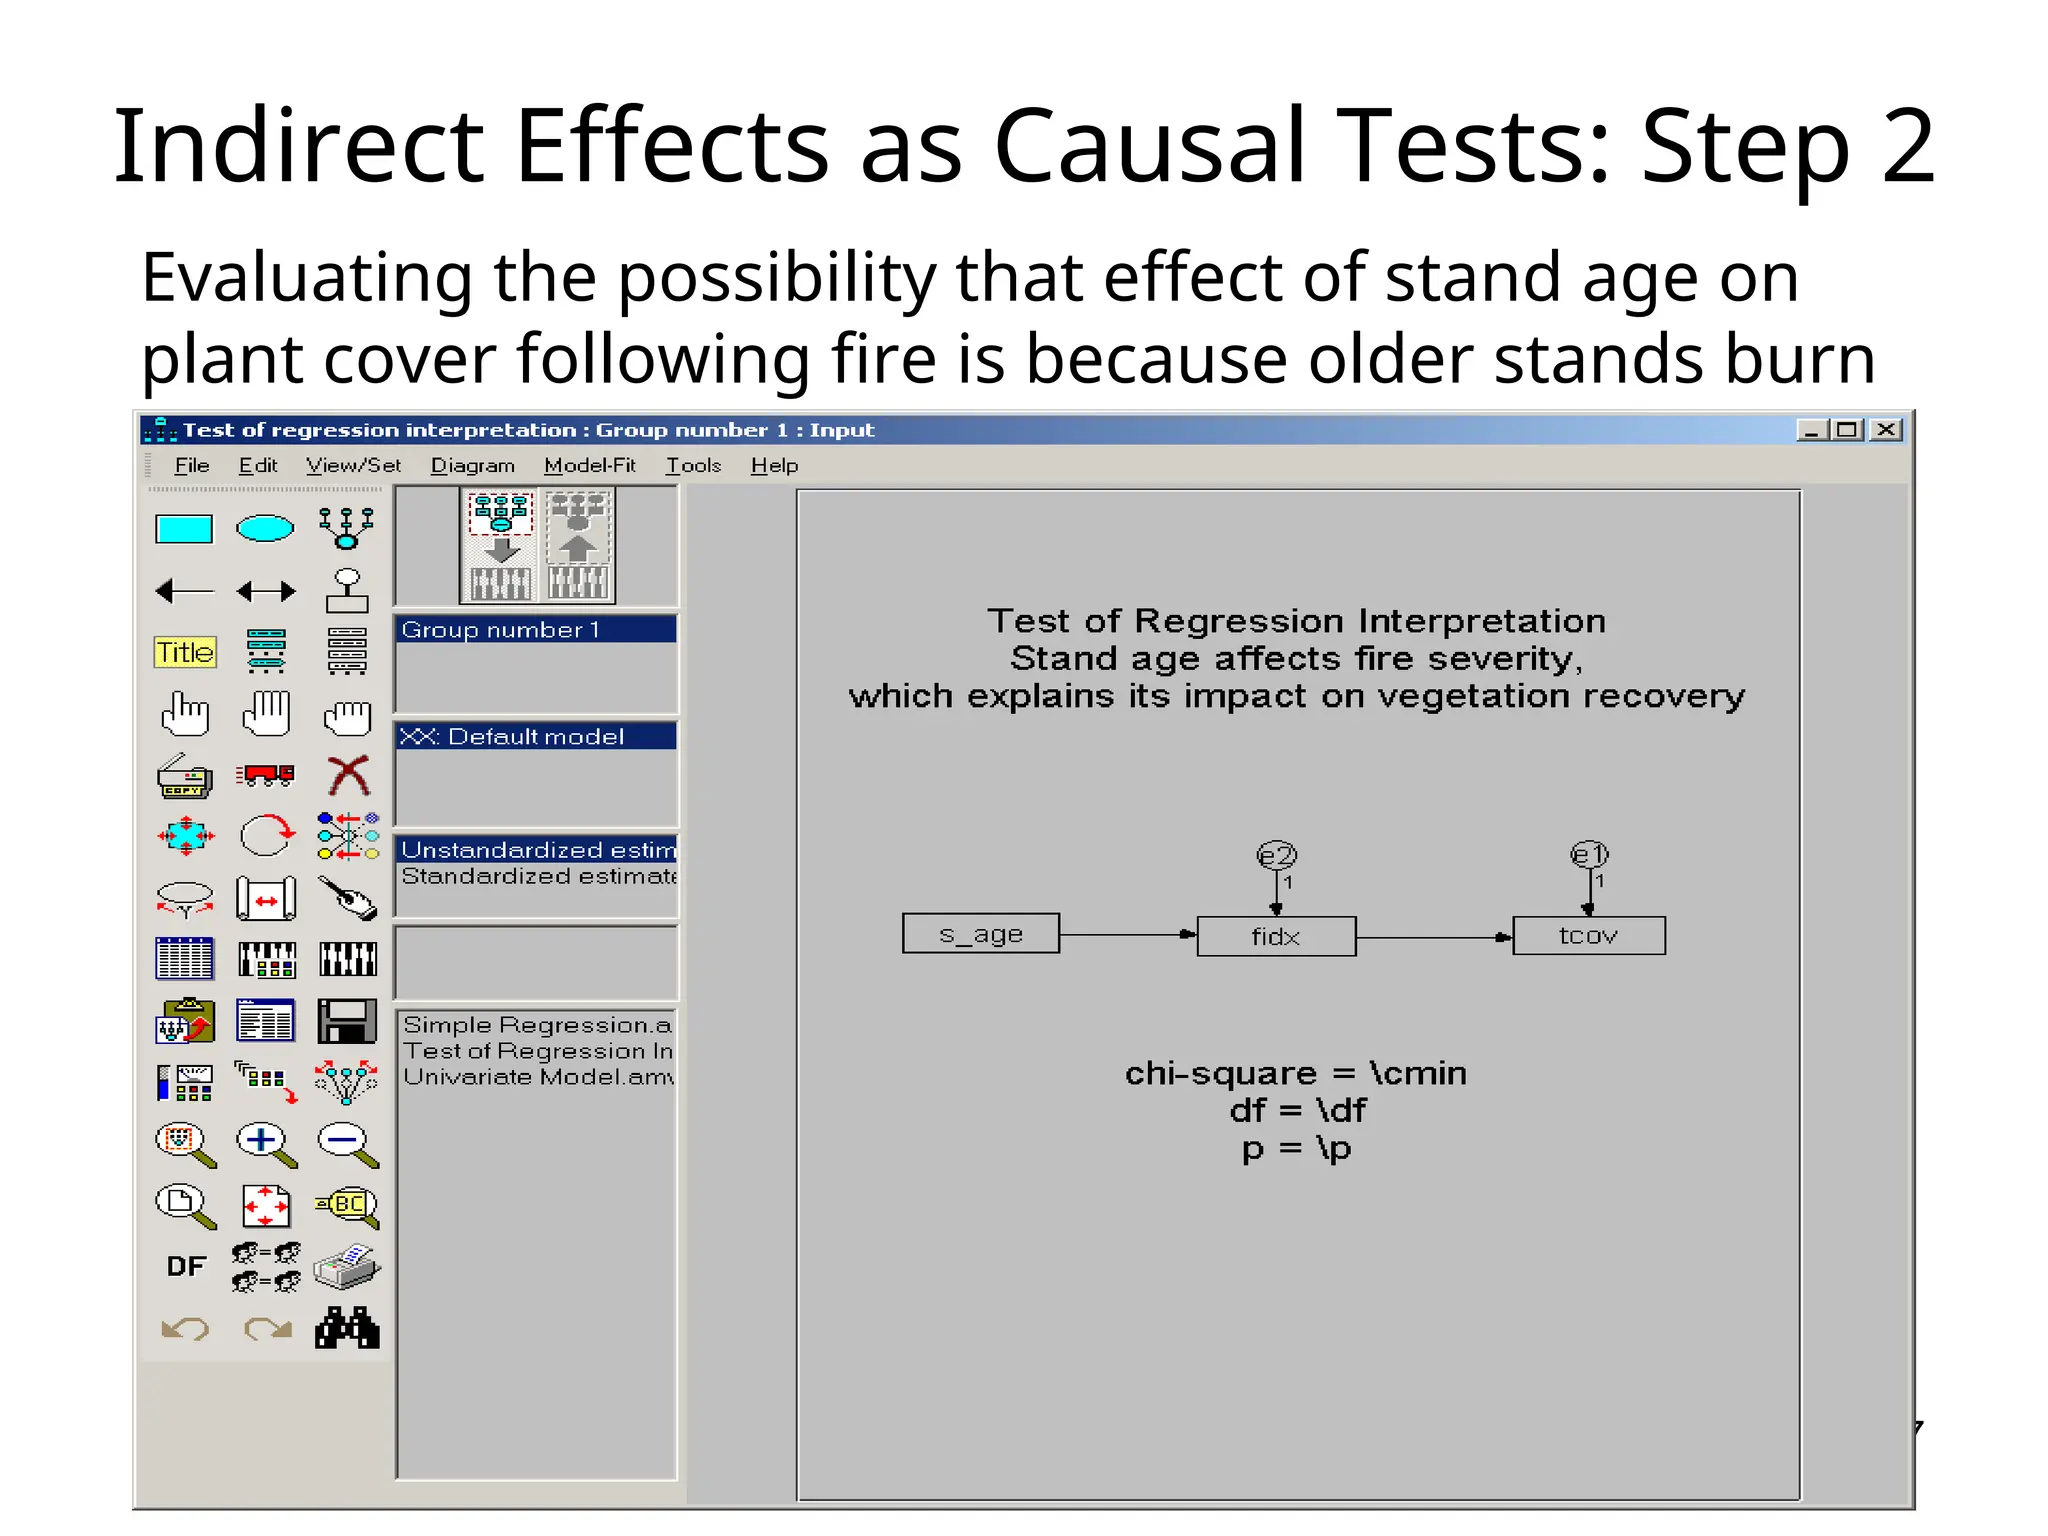
Evaluating the possibilitythat effect of stand age on
plant cover following fire is because older stands burn
hotter.
Indirect Effects as Causal Tests: Step 2
9
Testing the hypothesisof mediation - results.
Indirect Effects as Causal Tests: Step 3
Chi-square less than 3.84 indicates we pass
the test for concluding that fire severity
mediates the effect of stand age on
vegetation recovery.
standardized
path coefficients
R-square
10.
10
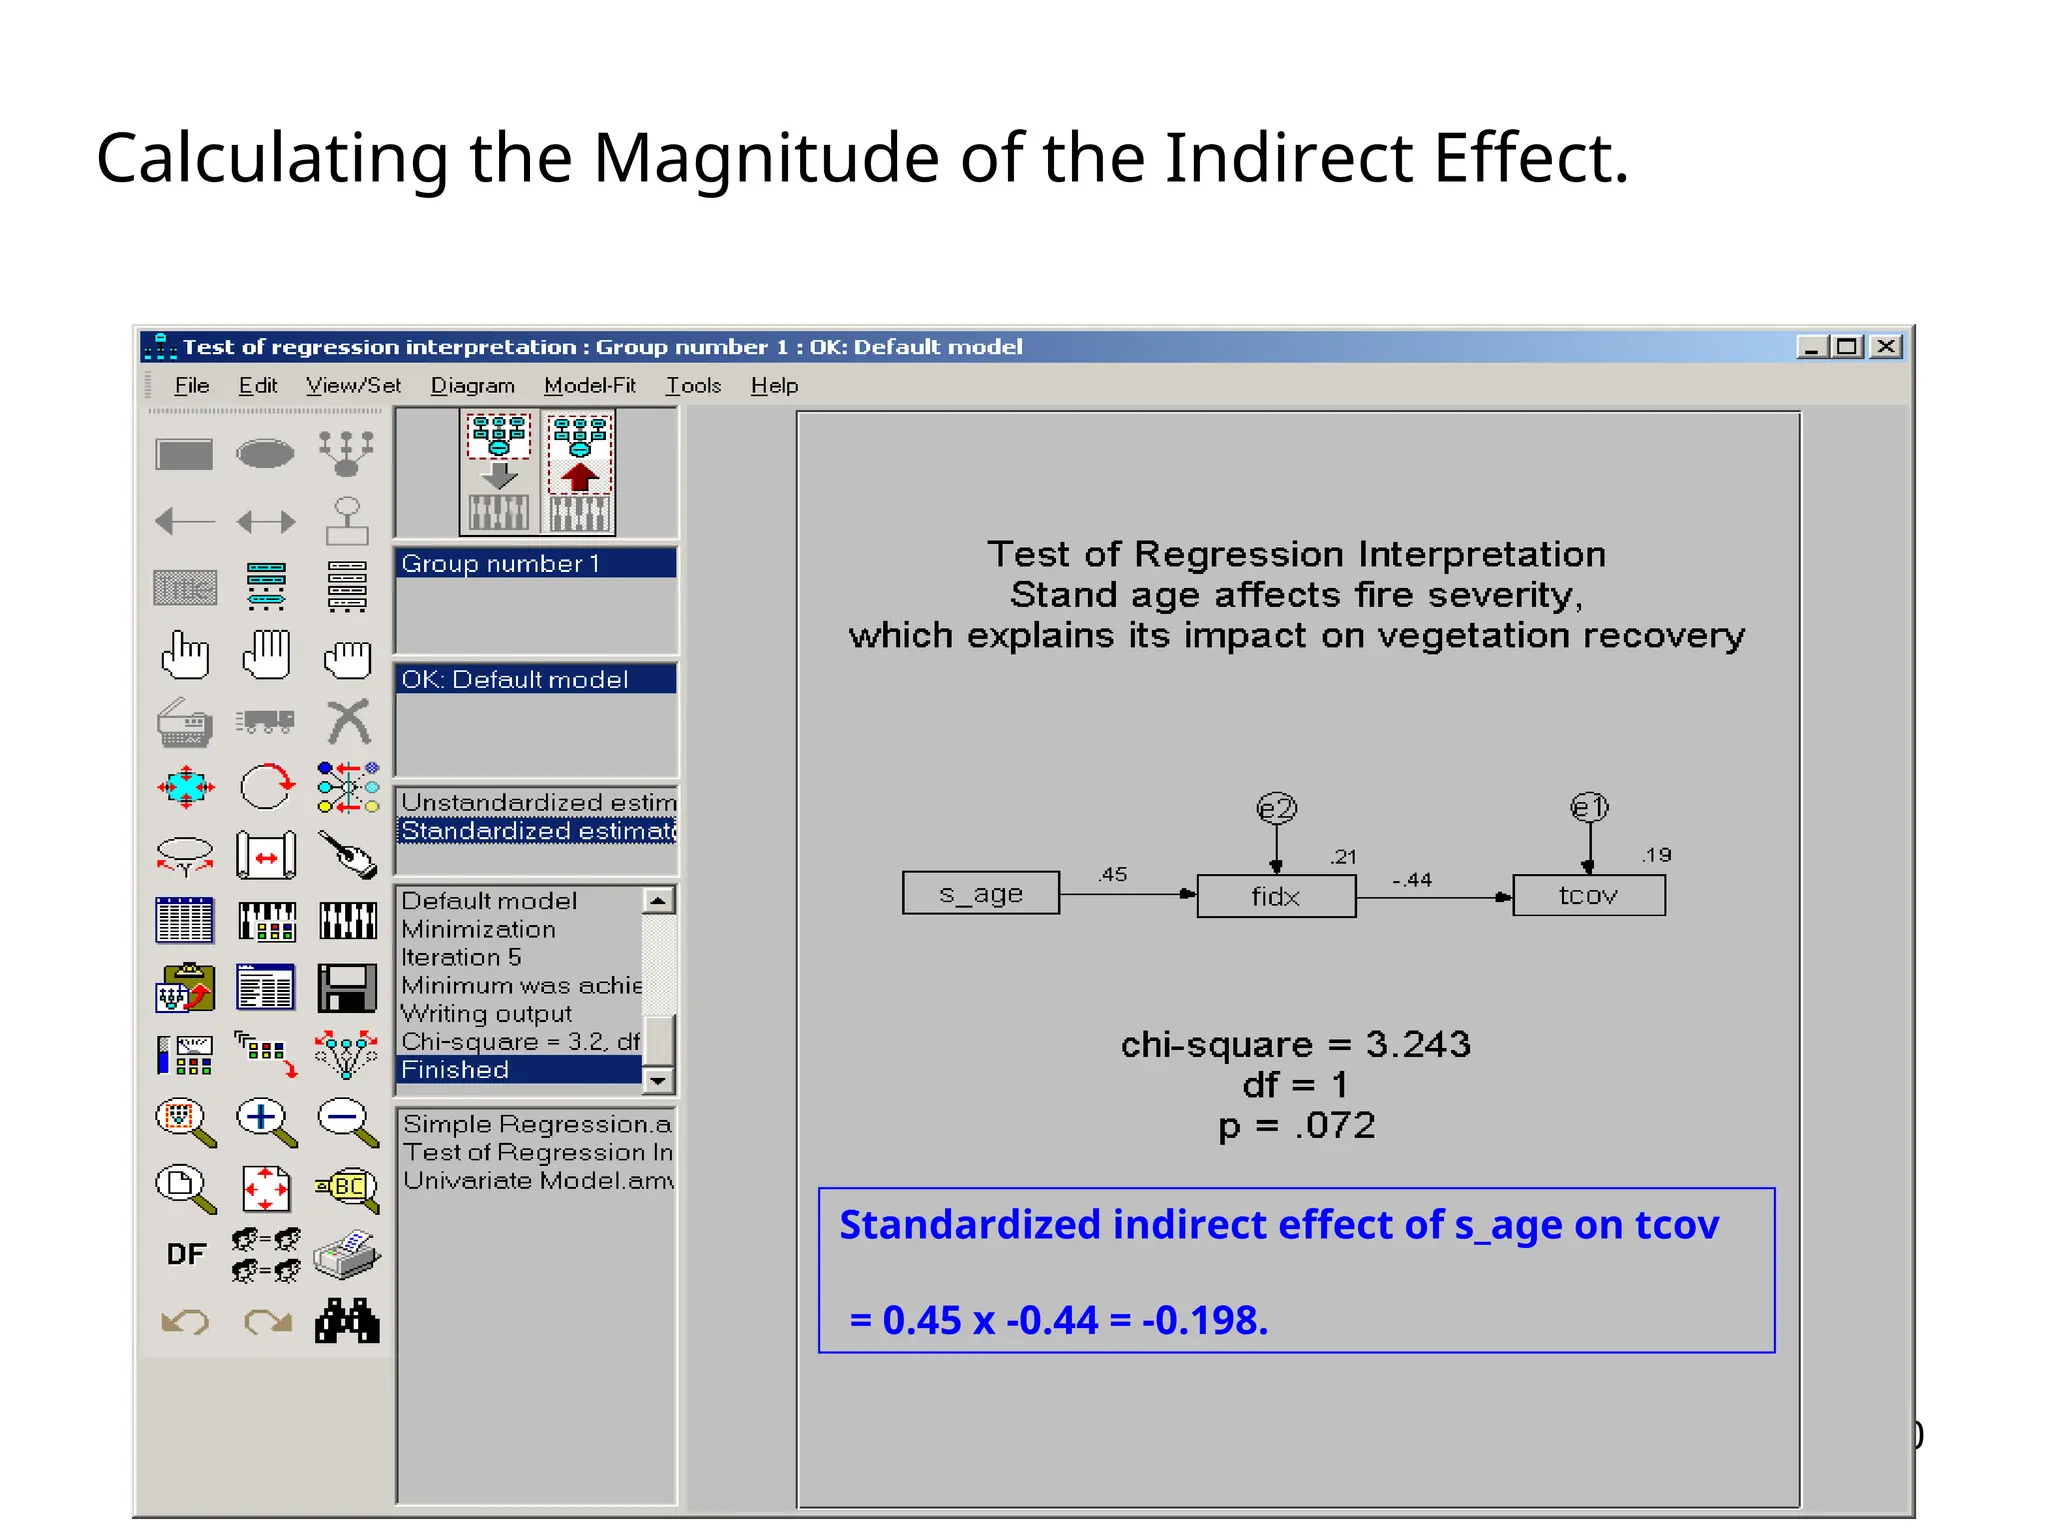
Calculating the Magnitudeof the Indirect Effect.
Standardized indirect effect of s_age on tcov
= 0.45 x -0.44 = -0.198.