


![THE STUDY OF STOCK EXCHANGE
36
Now, I will mention in short on the main stock exchanges of India, i.e. NSE
(National Stock Exchange), BSE (Bombay Stock Exchange) and OTCEI (Over The Counter
Exchange Of India). Though OTCEI plays a part of the key role, NSE and BSE are the most
important Stock Exchanges in India, which dominates and influences the Indian economy.
NATIONAL STOCK EXCHANGE (NSE)
The National Stock Exchange (NSE) is India's leading stock exchange covering various cities
and towns across the country. NSE was set up by leading institutions to provide a modern, fully
automated screen-based trading system with national reach. The Exchange has brought about
unparalleled transparency, speed & efficiency, safety and market integrity. It has set up facilities
that serve as a model for the securities industry in terms of systems, practices and procedures.
NSE has played a catalytic role in reforming the Indian securities market in terms of
microstructure, market practices and trading volumes. The market today uses state-of-art
information technology to provide an efficient and transparent trading, clearing and settlement
mechanism, and has witnessed several innovations in products & services viz. demutualisation of
stock exchange governance, screen based trading, compression of settlement cycles,
dematerialisation and electronic transfer of securities, securities lending and borrowing,
professionalisation of trading members, fine-tuned risk management systems, emergence of
clearing corporations to assume counterparty risks, market of debt and derivative instruments
and intensive use of information technology. The National Stock Exchange of India
Ltd. (NSE) located in the financial capital of India, Mumbai. National Stock Exchange (NSE)
was established in the mid 1990s as a demutualised electronic exchange. NSE provides a
modern, fully automated screen-based trading system, with over two lakh trading terminals,
through which investors in every nook and corner of Indiacan trade.
NSE has a market capitalisation of more than US$1.5 trillion and Number of securities (equities
segment) available for trading are 3,091 as on June 2014.[2]Though a number of other exchanges
exist, NSE and the Bombay Stock Exchange are the two most significant stock exchanges in
India, and between them are responsible for the vast majority of share transactions. NSE's
flagship index, the S&P CNX NIFTY, is used extensively by investors in India and around the
world to take exposure to the Indian equities market.
NSE was started by a clutch of leading Indian financial institutions at the behest of the
Government of India to bring transparency to the Indian market, and has a diversified
shareholding comprising domestic and global investors. The domestic investors includes Life
Insurance Corporation of India, GIC, State Bank of India and Infrastructure Development
Finance Company (IDFC) Ltd, while the foreign investors include MS Strategic (Mauritius)
Limited, Citigroup Strategic Holdings Mauritius Limited, Tiger Global Five Holdings and
Norwest Venture Partners X FII-Mauritius. It offers trading, clearing and settlement services in
equity, debt and equity derivatives. It is India's largest exchange, globally in cash market trades,
in currency trading and index options. As on June 2013, NSE has 1673 VSAT terminals and 2720
leaselines, spread over more than 2000 cities across India.](https://image.slidesharecdn.com/finalblackbook-150202033757-conversion-gate02/75/THE-STUDY-OF-STOCK-MARKET-36-2048.jpg)

![THE STUDY OF STOCK EXCHANGE
39
2000, the BSE used this index to open its derivatives market, trading SENSEX futures contracts.
The development of SENSEX options along with equity derivatives followed in 2001 and 2002,
expanding the BSE's trading platform. Established in 1875, BSE Ltd. (formerly known as
Bombay Stock Exchange Ltd. and established as "The Native Share and Stock Brokers'
Association") is one of Asia’s fastest stock exchanges, with a speed of 200 microseconds and
one of India’s leading exchange groups. BSE is a corporatized and demutualised entity, with a
broad shareholder-base that includes two leading global exchanges, Deutsche Bourse and
Singapore Exchange, as strategic partners. BSE provides an efficient and transparent market for
trading in equity, debt instruments, derivatives, and mutual funds. It also has a platform for
trading in equities of small-and-medium enterprises (SME). Over the past 139 years, BSE has
facilitated the growth of the Indian corporate sector by providing an efficient capital-raising
platform.
More than 5000 companies are listed on BSE, making it the world's top exchange in terms of
listed members. The companies listed on BSE Ltd. command a total market capitalization of
USD 1.51 Trillion as of May 2014.[1]It is also one of the world’s leading exchanges (3rd largest
in March 2014) for Index options trading (Source: World Federation of Exchanges).
BSE also provides a host of other services to capital market participants, including risk
management, clearing, settlement, market data services, and education. It has a global reach with
customers around the world and a nation-wide presence. BSE systems and processes are
designed to safeguard market integrity, drive the growth of the Indian capital market, and
stimulate innovation and competition across all market segments. BSE is the first exchange in
India and the second in the world to obtain an ISO 9001:2000 certification and the Information
Security Management System Standard BS 7799-2-2002 certification for its On-Line trading
System (BOLT). It operates one of the most respected capital market educational institutes in the
country (the BSE Institute Ltd.). BSE also provides depository services through its Central
Depository Services Ltd. (CDSL) arm.
BSE’s popular equity index - the S&P BSE SENSEX (Formerly SENSEX) - is India's most
widely tracked stock market benchmark index. It is traded internationally on the EUREX as well
as leading exchanges of the BRCS nations (Brazil, Russia, China and South Africa). On
Tuesday, 19 February 2013 BSE has entered into Strategic Partnership with S&P DOW JONES
INDICES and the SENSEX has been renamed as "S&P BSE SENSEX".](https://image.slidesharecdn.com/finalblackbook-150202033757-conversion-gate02/75/THE-STUDY-OF-STOCK-MARKET-39-2048.jpg)
![THE STUDY OF STOCK EXCHANGE
40
Advantages of trading at BSE
Historically an open outcry floor trading exchange, the Bombay Stock Exchange
switched to an electronic trading system developed by CMC Ltd in 1995. It took the
exchange only fifty days to make this transition. This automated, screen-based
trading platform called BSE On-line trading (BOLT) had a capacity of 8 million orders
per day. The BSE has also introduced the world's first centralized exchange-based
internet trading system, BSEWEBx.co.in to enable investors anywhere in the world to
trade on the BSE platform.
History and milestones:
Here is the latest history and milestone of NSE (2011-2014):
17 November 2011 Maharashtra and United Kingdom Environment Ministers launched
Concept Note for BSE Carbon Index
30 December 2011, picks up a stake in the proxy advisory firm, Institutional Investor
Advisory Services India Limited (IiAS)
7 January 2011 BSE Training Institute Ltd. with IGNOU launched India's first 2 year
full-time MBA programme specialising in Financial Market
15 January 2011 Co-location facility at BSE - tie up with Netmagic.com
22 February 2012 Launch of BSE-GREENEX to promote investments in Green India
13 March 2012 Launch of BSE - SME Exchange Platform
30 March 2012 BSE launched trading in BRICSMART indices derivatives
19 February 2013 - SENSEX becomes S&P SENSEX as BSE ties up with Standard and
Poor's to use the S&P brand for Sensex and other indices.[3]
28 November 2013 Launch of Currency Derivatives (BSE CDX)](https://image.slidesharecdn.com/finalblackbook-150202033757-conversion-gate02/75/THE-STUDY-OF-STOCK-MARKET-40-2048.jpg)


![THE STUDY OF STOCK EXCHANGE
54
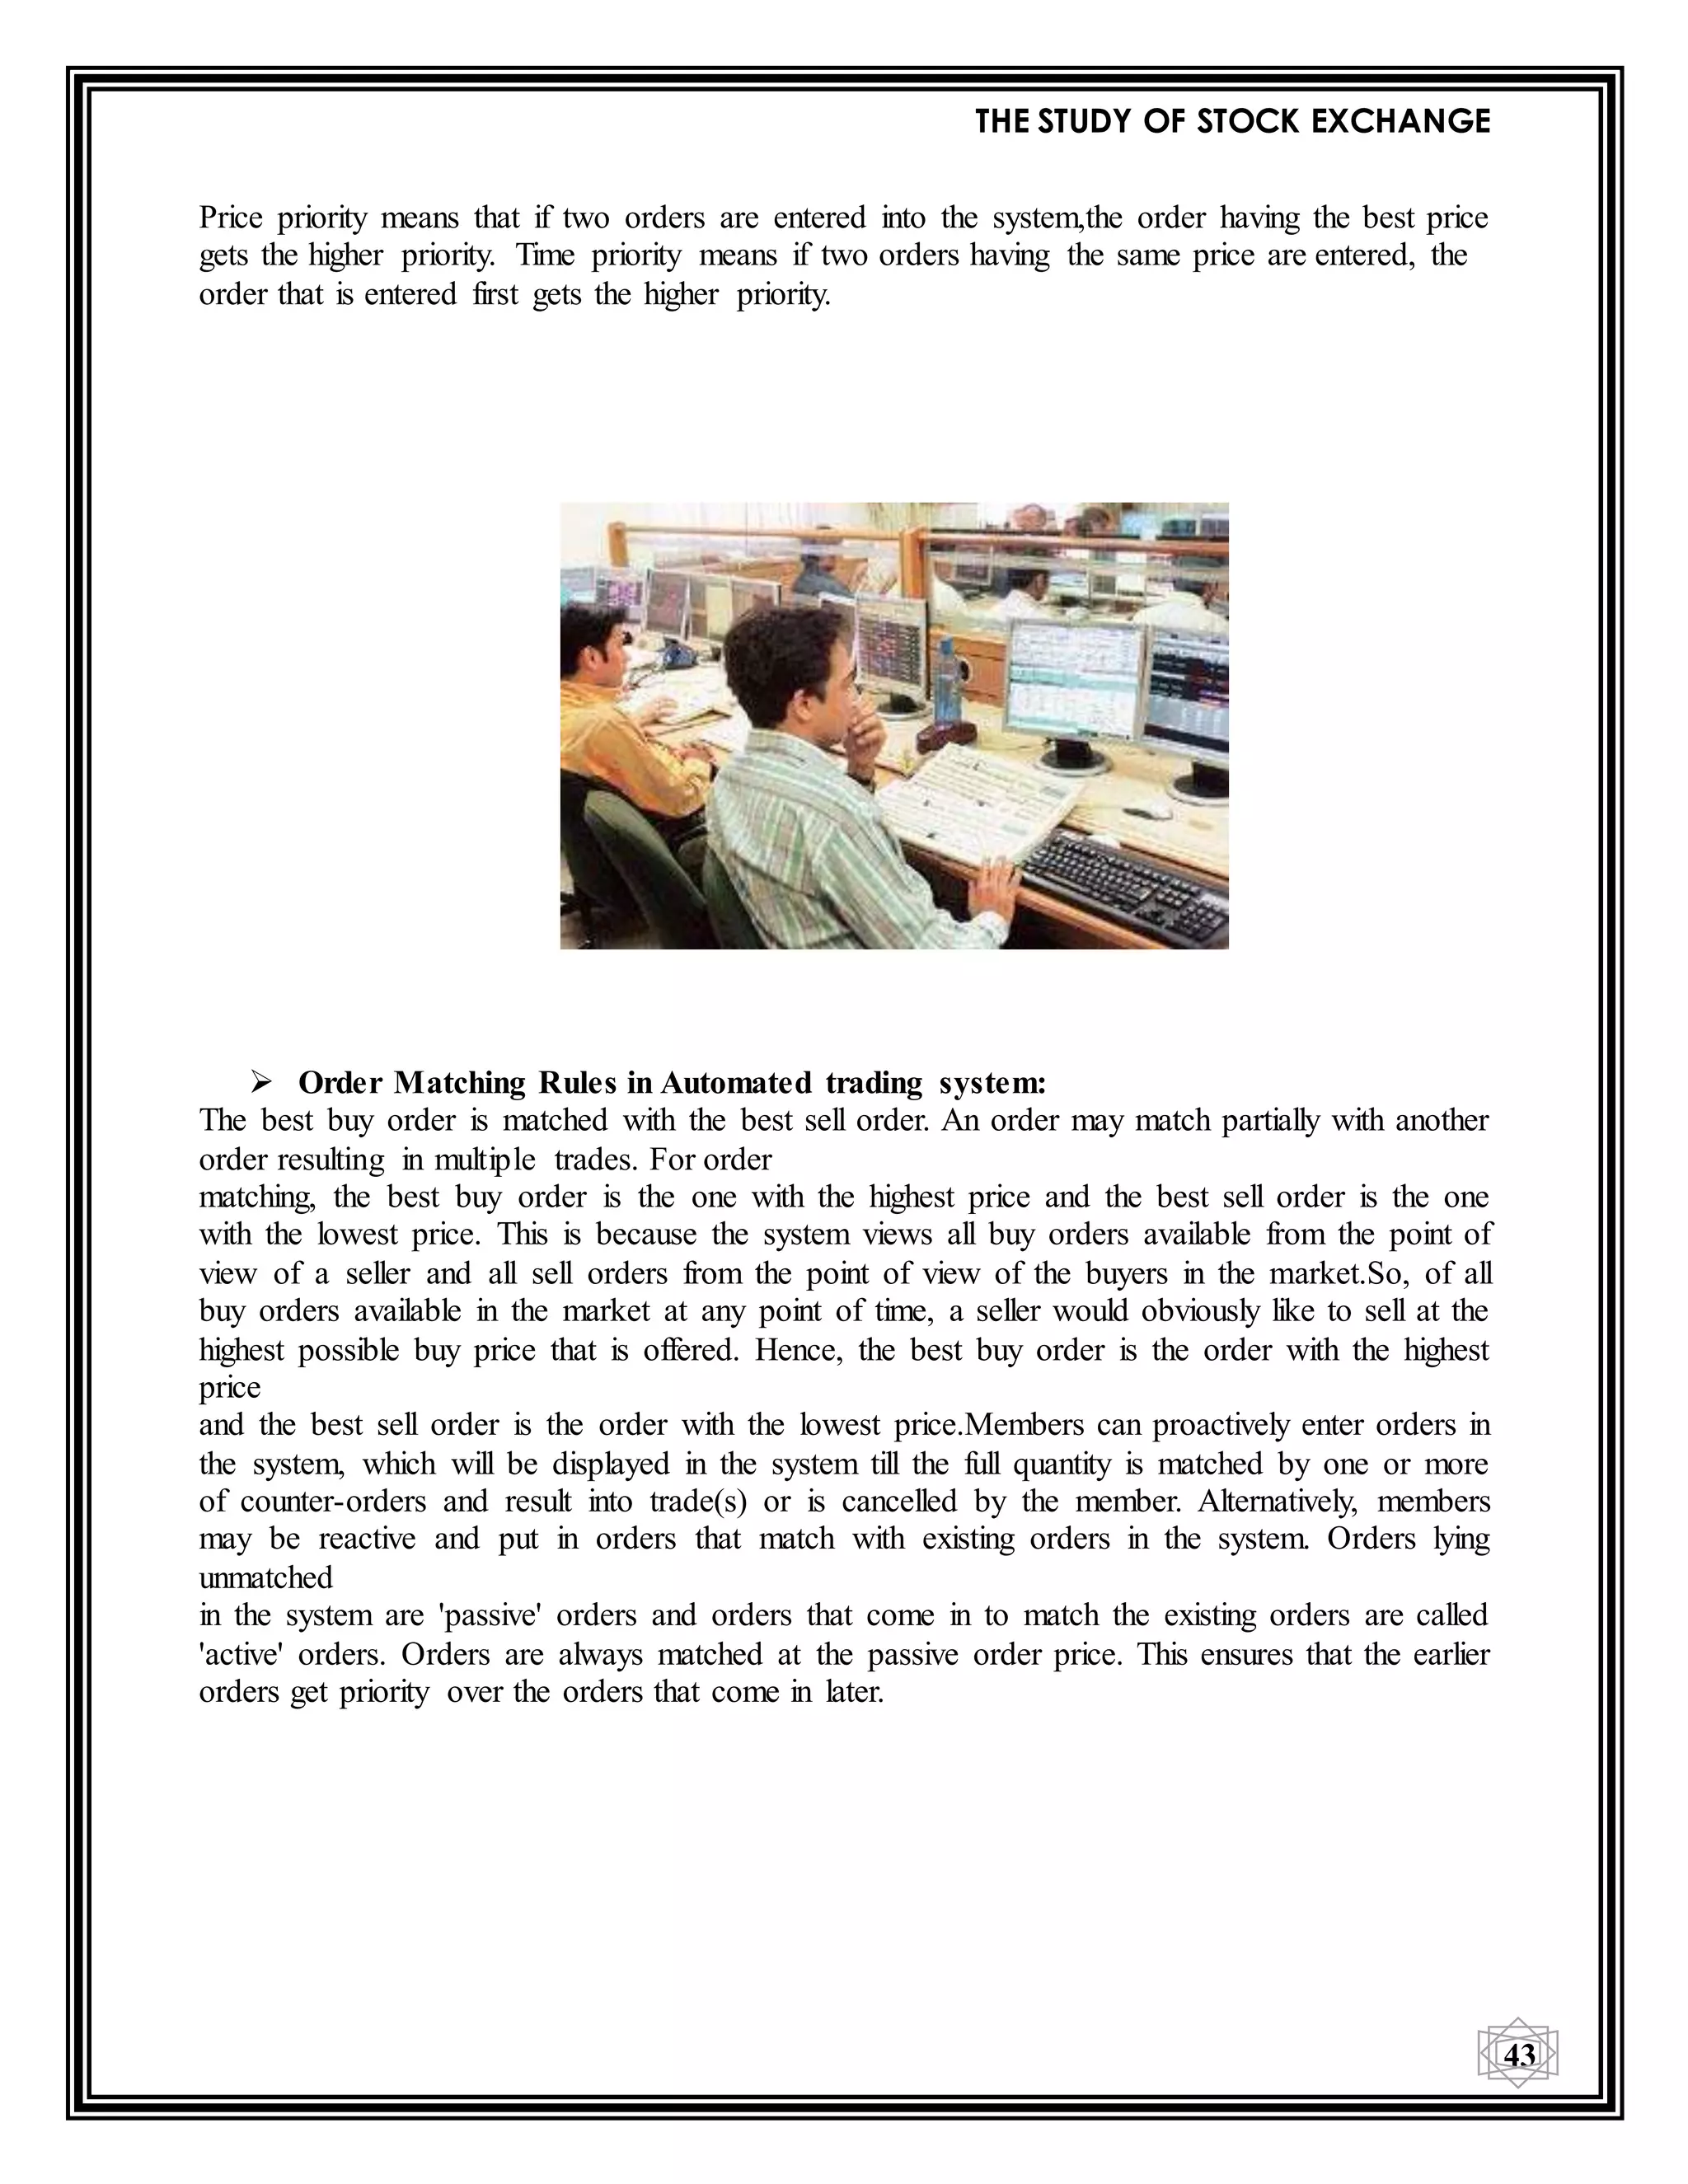
WHAT IS TRADING OF STOCKS?
Most stocks are traded on exchanges, which are places where buyers and sellers meet and decide
on a price. Some exchanges are physical locations where transactions are carried out on a trading
floor. You've probably seen pictures of a trading floor, in which traders are wildly throwing their
arms up, waving, yelling, and signaling to each other. The other type of exchange is virtual,
composed of a network of computers where trades are made electronically.
The purpose of a stock market is to facilitate the exchange of securities between buyers and
sellers, reducing the risks of investing. Just imagine how difficult it would be to sell shares if you
had to call around the neighborhood trying to find a buyer. Really, a stock market is nothing
more than a super-sophisticated farmers' market linking buyers and sellers.
WHO IS A STOCKBROKER?
Definition of 'Stockbroker'
1. An agent that charges a fee or commission for executing buy and sell orders submitted by an
investor.
2. The firm that acts as an agent for a customer, charging the customer a commission for its
services.
A stockbroker is an individual / organization who are specially given license to participate in the
securities market on behalf of clients. The stockbroker has the role of an agent. When the
Stockbroker acts as agent for the buyers and sellers of securities, a commission is charged for
this service.
As an agent the stock broker is merely performing a service for the investor. This means that the
broker will buy for the buyer and sell for the seller, each time making sure that the best price is
obtained for the client.
An investor should regard the stockbroker as one who provides valuable service and information
to assist in making the correct investment decision. They are adequately qualified to provide
answers to a number of questions that the investor might need answers to and to assist in
participating in the regional market. Here are some questions which arise in the minds of the
investors before the take help of the brokers for investing their money in a particular company.
Are they governed by any Rules and Regulations?
Of course, yes. Stock brokers are governed by SEBI Act, 1992, Securities Contracts (Regulation)
Act, 1956, Securities and Exchange Board of India [SEBI (Stock brokers and Sub brokers) Rules
and Regulations, 1992], Rules, Regulations and Bye laws of stock exchange of which he is a](https://image.slidesharecdn.com/finalblackbook-150202033757-conversion-gate02/75/THE-STUDY-OF-STOCK-MARKET-54-2048.jpg)


![THE STUDY OF STOCK EXCHANGE
93
INDIAN STOCK INDICES
There are two main indices of the Indian stock market:
NIFTY
SENSEX
NIFTY
NIFTY is a major stock index in India introduced by the National stock exchange.
NIFTY was coined for the two words ‘National’ and ‘FIFTY’. The word fifty is used because;
the index consists of 50 actively traded stocks from various sectors.
So the NIFTY index is a bit broader than the Sensex which is constructed using 30 actively
traded stocks in the BSE.
NIFTY is calculated using the same methodology adopted by the BSE in calculating the Sensex
– but with three differences.
They are:
The base year is taken as 1995
The base value is set to 1000
NIFTY is calculated on 50 stocks actively traded in the NSE
50 top stocks are selected from 24 sectors.
The CNX NIFTY, also called the NIFTY 50 or simply the NIFTY, is National Stock Exchange of
India's benchmark index for Indian equity market. NIFTY is owned and managed by India Index
Services and Products Ltd. (IISL), which is a wholly owned subsidiary of the NSE Strategic
Investment Corporation Limited. IISL is India's first specialized company focused upon the
index as a core product. IISL has a marketing and licensing agreement with Standard &
Poor's for co-branding equity indices. 'CNX' in its name stands for 'CRISIL NSE Index'.
CNX NIFTY has shaped up as a largest single financial product in India, with an ecosystem
comprising: exchange traded funds (onshore and offshore), exchange-traded futures and options
(at NSE in India and at SGX and CME abroad), other index funds and OTC derivatives (mostly
offshore).
The CNX NIFTY covers 22 sectors of the Indian economy and offers investment managers
exposure to the Indian market in one portfolio. During 2008-12, CNX NIFTY 50 Index share of
NSE market capitalisation fell from 65% to 29%[1] due to the rise of sectoral indices like CNX
Bank, CNX IT, CNX Mid Cap, etc. The CNX NIFTY 50 Index gives 29.70% weightage to
financial services, 0.73% weightage to industrial manufacturing and nil weightage to agricultural
sector.
The CNX NIFTY index is a free float market capitalisation weighted index. The index was
initially calculated on full market capitalisation methodology. From June 26, 2009, the
computation was changed to free float methodology. The base period for the CNX NIFTY index
is November 3, 1995, which marked the completion of one year of operations of National Stock
Exchital Market Segment. The base value of the index has been set at 1000, and a base capital of
Rs 2.06 trillion. The CNX NIFTY Index was developed by Ajay Shah and Susan Thomas. The
CNX NIFTY currently consists of the following 50 major Indian companies:
Kindly Note, post expiration of agreement between IISL and Standard and Poor’s Financial
Service LLC (S&P) on 31st Jan 2013, index is addressed as CNX NIFTY Index. (Formerly, S&P
CNX NIFTY Index)](https://image.slidesharecdn.com/finalblackbook-150202033757-conversion-gate02/75/THE-STUDY-OF-STOCK-MARKET-93-2048.jpg)


![THE STUDY OF STOCK EXCHANGE
113
Indexes:
Dow Jones Industrial Average
The Dow Jones Industrial Average /also called theIndustrial Average, the Dow Jones, the Dow
Jones Industrial, the Dow 30, or simply the Dow, is a stock market index, and one of several
indices created by Wall Street Journal editor and Dow Jones & Companyco-founder Charles
Dow. The industrial average was first calculated on May 26, 1896. Currently owned by S&P
Dow Jones Indices, which is majority owned by McGraw-Hill Financial, it is the most notable of
the Dow Averages, of which the first (non-industrial) was first published on February 16, 1885.
The averages are named after Dow and one of his business associates, statistician Edward Jones.
It is an index that shows how 30 large publicly owned companies based in the United States have
traded during a standard trading session in the stock market.[3] It is the second oldest U.S.
market index after the Dow Jones Transportation Average, which was also created by Dow.
S&P 500
The S&P 500, or the Standard & Poor's 500, is a stock market indexbased on the market
capitalizations of 500 large companies having common stock listed on the NYSE or NASDAQ.
The S&P 500 index components and their weightings are determined by S&P Dow Jones
Indices. It differs from other U.S. stock market indices, such as the Dow Jones Industrial
Averageor the Nasdaq Composite index, because of its diverse constituency and weighting
methodology. It is one of the most commonly followed equity indices, and many consider it one
of the best representations of the U.S. stock market, and a bellwether for the U.S.
economy. The National Bureau of Economic Research has classified common stocks, as a
leading indicator of business cycles.
NYSE Composite
The NYSE Composite is a stock market index covering all common stock listed on the New
York Stock Exchange, includingAmerican depositary receipts, real estate investment
trusts, tracking stocks, and foreign listings. Over 2,000 stocks are covered in the index, of which
over 1,600 are from United States corporations and over 360 are foreign listings; however
foreign companies are very prevalent among the largest companies in the index: of the 100
companies in the index having the largest market capitalization (and thus the largest impact on
the index), more than half (55) are non-U.S. issues. This includes corporations in each of the ten
industries listed in the Industry Classification Benchmark. It uses free-float market
cap weighting.
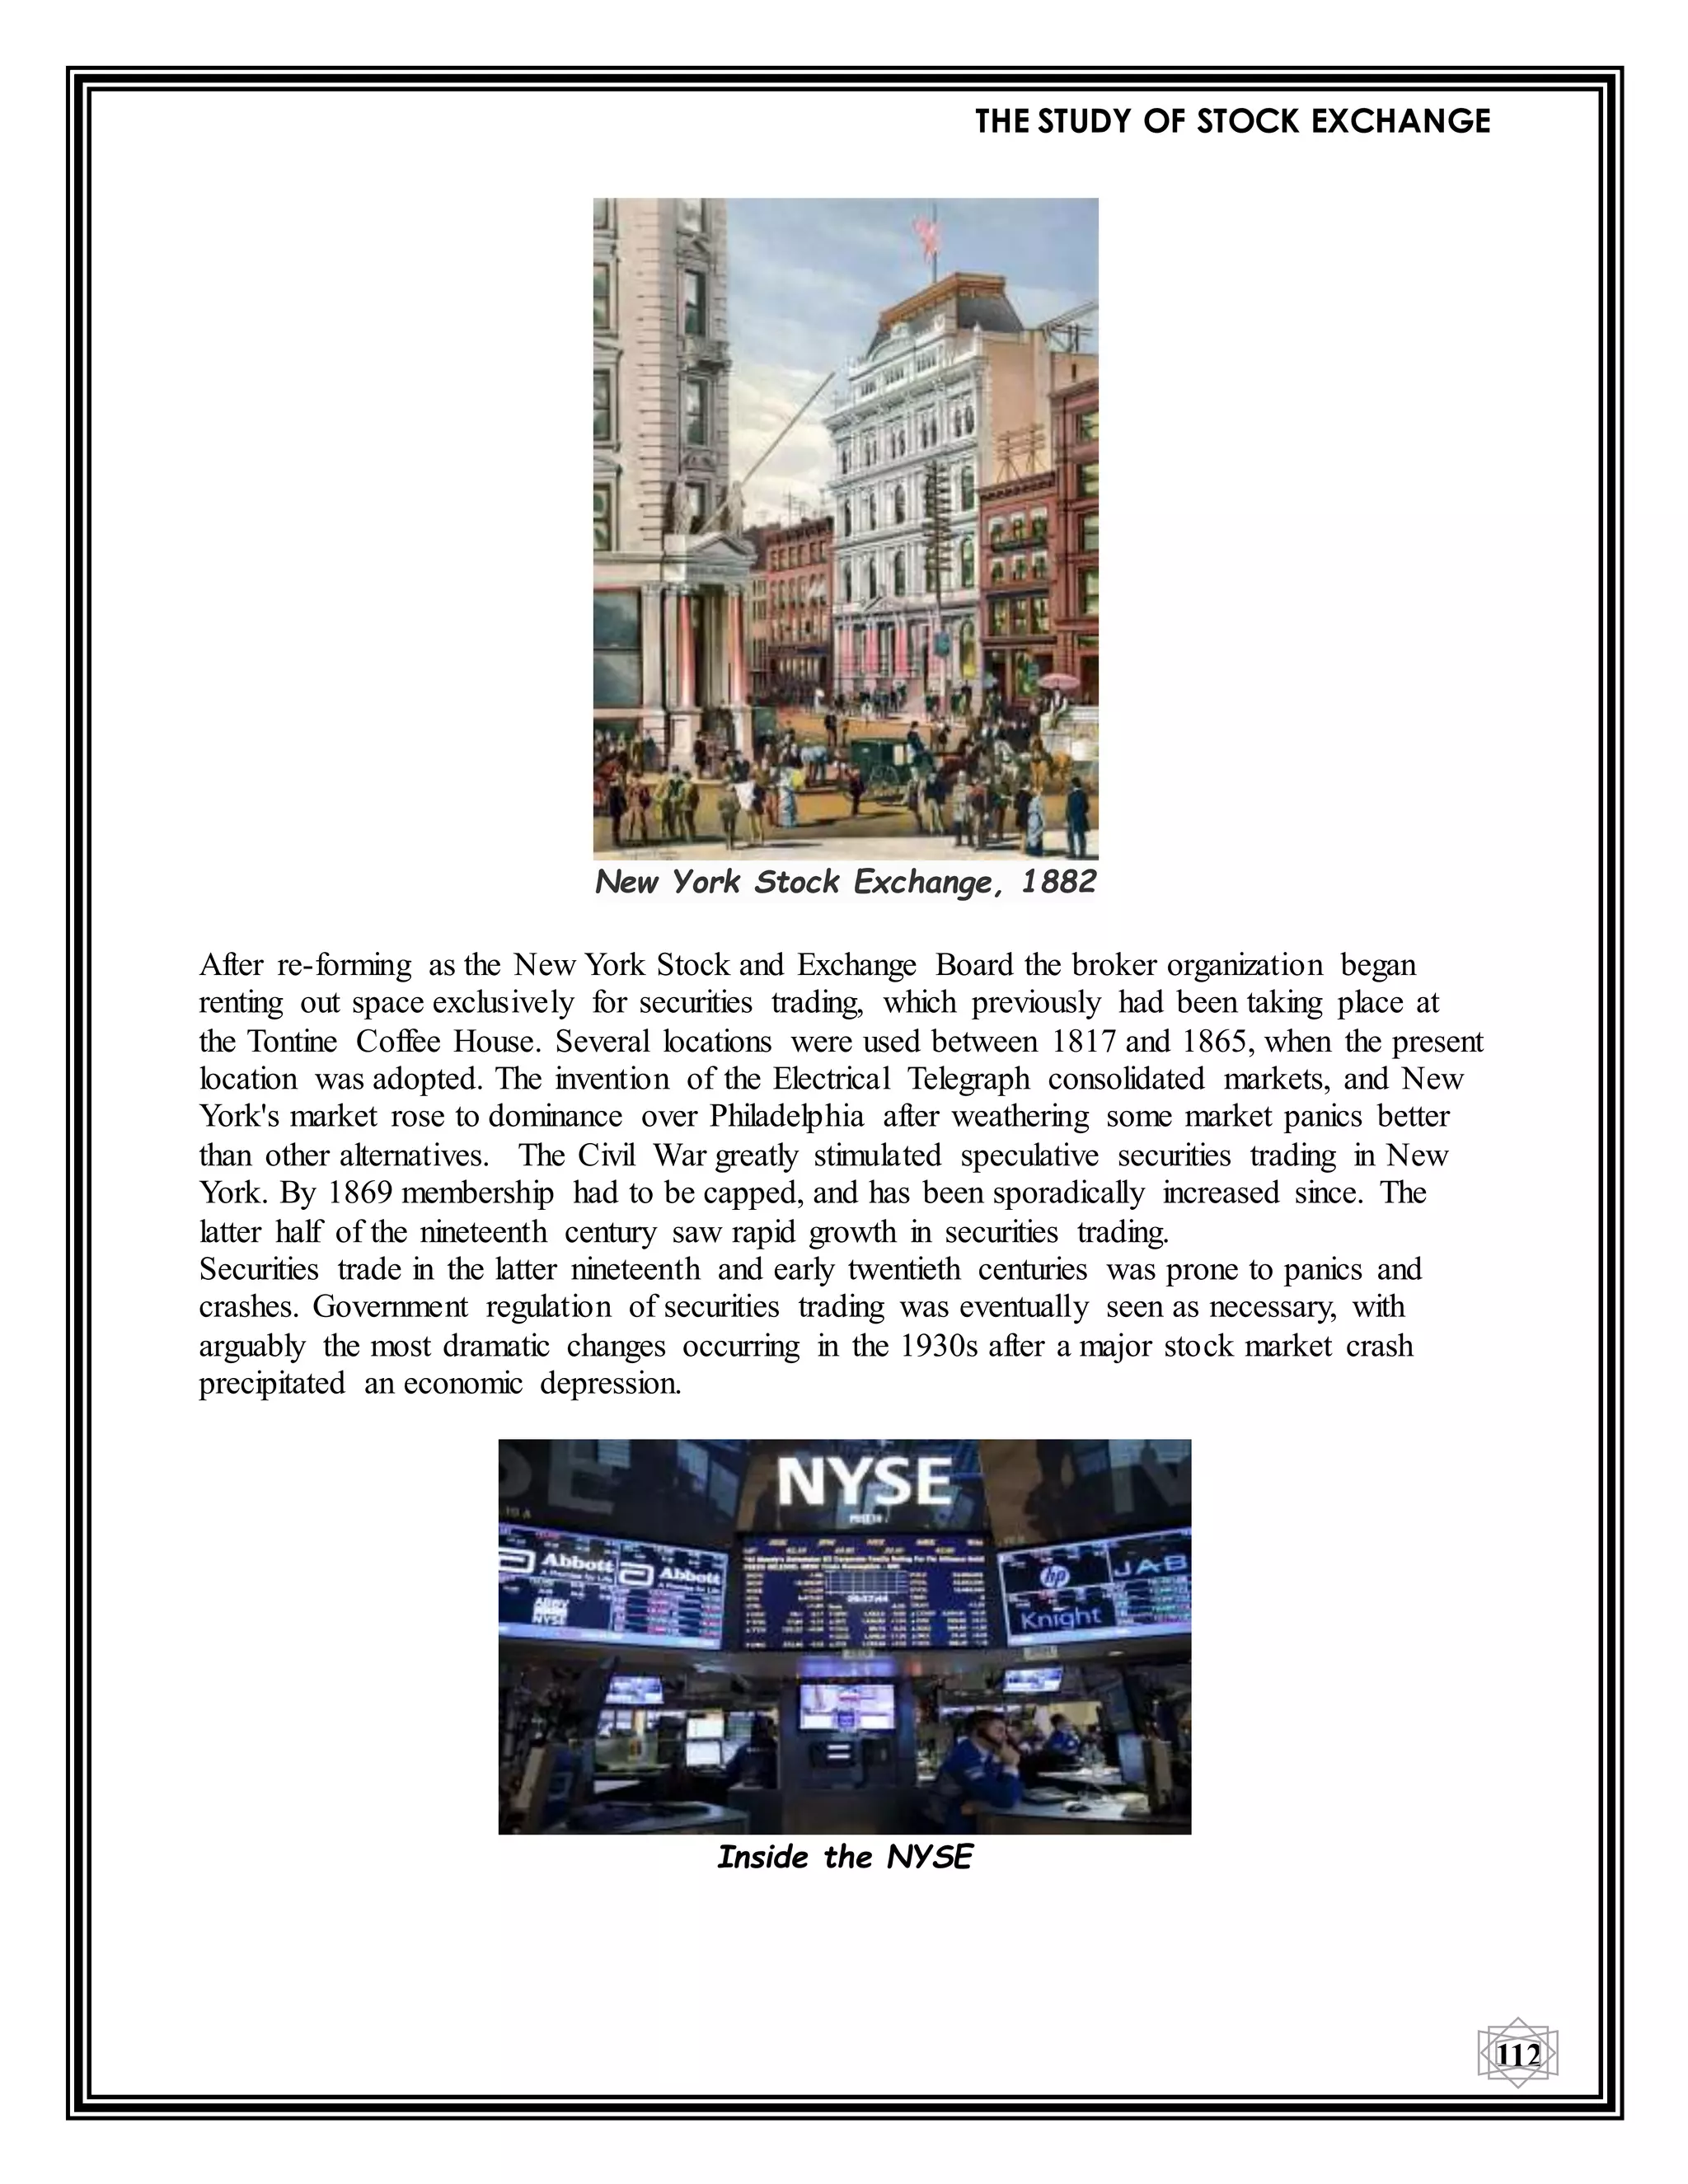
Notable events:
The Wall Street Crash of 1929, also known as Black Tuesday or the Stock Market Crash
of 1929, began in late October 1929 and was the most devastatingstock market crash in
the history of the United States, when taking into consideration the full extent and
duration of its fallout. The crash signaled the beginning of the 10-year Great
Depression that affected all Western industrialized countries. The Black Thursday crash
of the Exchange on October 24, 1929, and the sell-off panic which started on Black
Tuesday, October 29, are often blamed for precipitating the Great Depression. In an effort
to try to restore investor confidence, the Exchange unveiled a fifteen-point program](https://image.slidesharecdn.com/finalblackbook-150202033757-conversion-gate02/75/THE-STUDY-OF-STOCK-MARKET-113-2048.jpg)


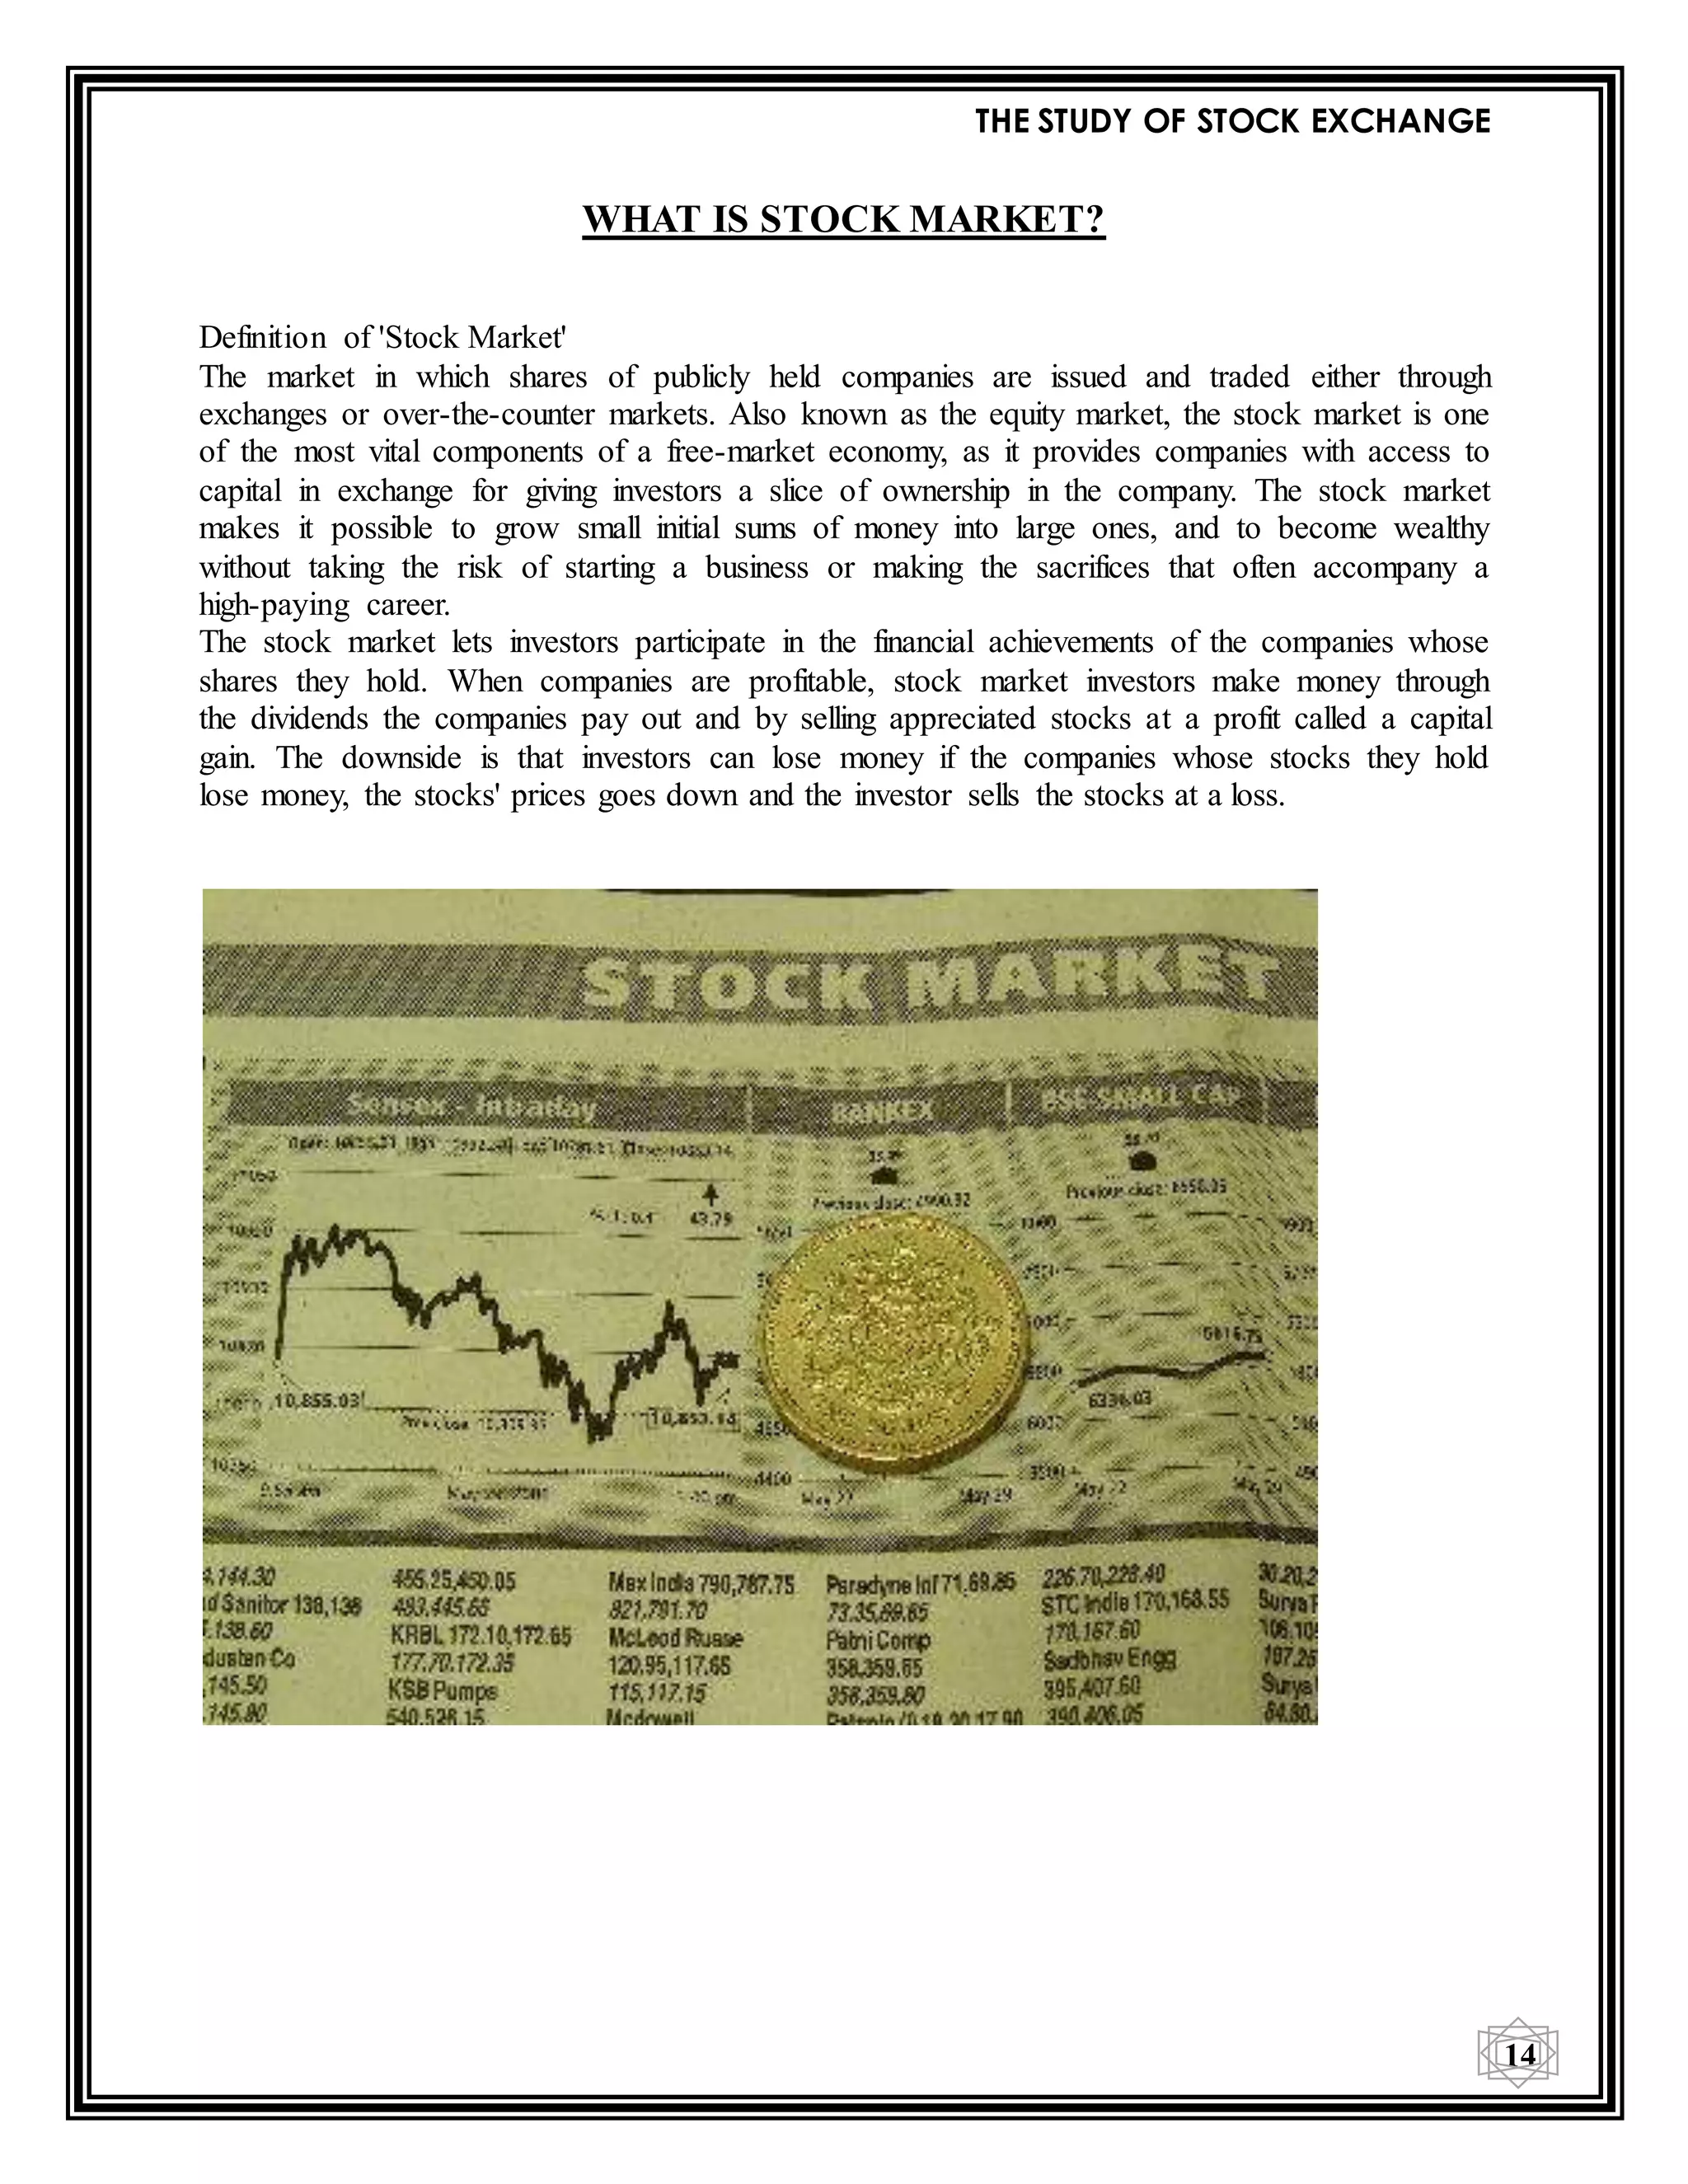
The document is a project report titled 'The Study of Stock Market' submitted by Shweta Sudhakaran Acharya as part of the T.Y.B.M.S program at the University of Mumbai. It outlines the objectives of understanding the stock market, its functioning, and the regulatory framework in India, while detailing the roles of stock exchanges and trading mechanisms. The report includes comprehensive research, interviews, and a historical perspective of stock markets, aiming to equip new investors with essential knowledge for investment decisions.


![[DSC Europe 25] Andy Cotgreave - Nothing is new in analytics.pptx](https://cdn.slidesharecdn.com/ss_thumbnails/mba4vzcurvoh5lfrd5zw-6-251205194645-341bbbbe-thumbnail.jpg?width=640&height=640&fit=bounds)
![[DSC Europe 25] Marija Vlajkovic & Andrea Radonjanin - Integration of AI tool...](https://cdn.slidesharecdn.com/ss_thumbnails/qf1jrglttoc3bm8s3aop-final-integration-of-ai-tools-251208151905-394f3a6a-thumbnail.jpg?width=640&height=640&fit=bounds)
![[DSC Europe 25] Dragan Vucic - Building the Learning Organization - How AI Tr...](https://cdn.slidesharecdn.com/ss_thumbnails/8brigo2sbu6qur6gxrra-7-251205085715-6ae07d24-thumbnail.jpg?width=640&height=640&fit=bounds)


![[DSC Europe 25] Vid Stimac - Policy Parsimony: Between Oversimplifying and Ov...](https://cdn.slidesharecdn.com/ss_thumbnails/eqlepagzqp2rhg3gbluh-dsc-stimac-251120-251205090438-059e7f54-thumbnail.jpg?width=640&height=640&fit=bounds)


![[DSC Europe 25] Nikola Rajovic - Hardware Technologies Under the Hood: RISC-V...](https://cdn.slidesharecdn.com/ss_thumbnails/o2gptrmtoyqndgoshwgq-dsc2025-tenstorrent-rajovic-251205090438-814685f5-thumbnail.jpg?width=640&height=640&fit=bounds)
![[DSC Europe 25] Goran Obradovic - The Rise of Sovereign AI: Building the Regi...](https://cdn.slidesharecdn.com/ss_thumbnails/7nw2xxixrxqdxvrb5wca-6-251205085714-ab09a2ac-thumbnail.jpg?width=640&height=640&fit=bounds)
![[DSC Europe 25] Dusan Jovicic - AI Story: From on-prem to cloud and back agai...](https://cdn.slidesharecdn.com/ss_thumbnails/8kp49m6uq22ifnbwhfnk-2-251205085715-964d11a6-thumbnail.jpg?width=640&height=640&fit=bounds)