The main purpose of the research was to argue if the foreign exchange risk is an asset pricing factor. Considering that the volatility of the foreign exchange is a major influencing factor of the macro environment changes -while macro environment has proven to affect stock prices-, I have chosen to examine directly the effect of foreign exchange fluctuations on stock returns by using a Fama and French five factor model.
In Sharjah ௵(+971)558539980 *_௵abortion pills now available.
The sensitivity of the cross section of stock returns to the foreign exchange risk
1. The sensitivity of the cross
section of stock returns to
the foreign exchange risk
Anastasia Semertzidou
SCHOOL OF ECONOMICS, BUSINESS ADMINISTRATION & LEGAL STUDIES
A thesis submitted for the degree of
Master of Science (MSc) in Finance and Banking
November 2018
Thessaloniki – Greece
Student Name: Anastasia Semertzidou
SID: 1103170018
Supervisor: Prof. Panagiotis Artikis
2. I hereby declare that the work submitted is mine and that where I have made use of
another’s work, I have attributed the source(s) according to the Regulations set in the
Student’s Handbook.
November 2018
Thessaloniki - Greece
3. Abstract
This dissertation was written as part of the MSc in Finance and Banking at the
International Hellenic University.
The objective of the present thesis is to examine the sensitivity of stock returns to
foreign exchange risk in an oil-exporting country. Specifically, the analysis had been
performed using listed companies in Norway’s Stock Exchange from 2008 to 2018. As
the time period of the research was the post period of the global financial crisis, I have
examined whether the relationship between foreign exchange risk and stock returns
both has changed after the above event. Norway’s economic structure is not skilled
labor oriented, but is highly subject on natural resources. Thus, Norwegian`s economic
growth is significantly affected by the movements in the demand and the pricing for
these natural resources. The main idea behind this research is to correlate the foreign
exchange fluctuations with the changes in stock prices. This is one of the most
important and challenging fields in the financial economics. Specifically, this study
focused on a European oil country which is not a member of the Eurozone. In order to
control for other risk factors affecting stock returns the model used will be based upon
the Fama and French five factor model.
In the past Norway has been used as the setting for testing the relationship between
oil price shocks and stock markets volatility. The most important of which is the “Oil
price shocks and stock markets in the U.S. and 13 European countries” of Jungwook
Park, Ronald A.Ratti (2008), which indicates that the Norway as an oil exporter shows a
statistically significantly positive response of real stock returns to an oil price increase.
Compare to the findings for U.S. and Norway, for the most of the oil importing
European countries, there is no strong evidence of linear effects on the real stock
returns because of the positive or negative oil price shocks. Considering that the
volatility of foreign exchange is a major influencing factor of changes in the macro
environment and the macro environment has proven to affect stock prices, I have
chosen to examine directly the effect of foreign exchange changes on stock returns.
4. A significant contribution was made by my supervisor, Dr. Panagiotis Artikis, who was
overseeing the process of this thesis, helped me during the regression of my models
and with the sources I used to the literature review.
Anastasia Semertzidou
03/11/2018
5. Preface
I wish to thank my supervisor for his helpful comments, suggestions and invaluable
guidance in order to complete successfully this research
7. 1
Introduction
The modeling of the systematic risk by using econometric approach, is widen
challenging field for the modern financial economics which is trying to capture the risk
factors of stock returns. The identification of the sources of these risks is an important
issue for both theoretical and applied reasons. In this research, has been identified and
evaluated the factors where most important explained the cross-sectional variation in
Norway`s stock returns, as a representative strong developed market.
In both developed and emerging markets around the world, there has been a
considerable evidence that the cross-section of average returns are related to firm
level characteristics such as the earnings, cash flows, the size of the company, the
dividend over price, the book-to-market ratio, the leverage and the momentum
effects. Norway is one of the most important Eurozone countries in terms of exports
and economic significance, and this is the reason this research is focused on the
analysis of these data. Norway is the biggest Eurozone oil-exporter who did not
participate in OECD.
The main objective of this research was to investigate whether the foreign exchange
risk is a strong asset pricing factor, by explaining the variation caused on the cross-
sectional stock returns by the foreign exchange factor portfolio. The methodology
used, was based on the work of Fama and French (1993), and more specifically of the
three factor Fama and French model, by using along with the market risk premium, the
size, the value factor, the momentum and the foreign exchange factor as to explain the
returns of the sample stocks.
8. 2
Norwegian Economy
Norway, Luxembourg, and Switzerland are the only three countries worldwide which
per capita GDP is above $70,000 and are not islands nor microstates. The Norwegian
economy characterized as a developed mixed economy which is oil-exporting but did
not be an OPEC member. Since the start of the industrial period, Norway shown a
significant growth exposure, although it is sensitive to global business cycle
movements. Several problems to the Norwegian economic policy has risen because
Norway is an oil-exporting country. Economic growth is vulnerable to fluctuation of the
prices of the natural resources because Norway`s economy in general is highly
dependent on natural resources. On account of this, many capital investments
accumulated at petroleum-related industries and due to this fact, the Government
Pension Fund is trying to hedge against the correlation on petroleum revenue.
Nowadays, the main objectives of the monetary policy that government wish to apply
is a low and stable inflation rate, stable developments in output and employment and
the robustness of monetary policy in general. Leading sources of vulnerability, such as
the global oil price and the global stock market, are the key resources of risk for
Norway.
After being in a repeating downturn for very nearly three years, development in the
Norwegian economy has grabbed. The downturn seems to have bottomed out toward
the finish of a year ago 2016, yet the upturn is delicate in that it gauge development
just marginally over pattern in the close term. Exceptionally expansionary financial and
money related approach, a powerless krone and solid development have facilitated
the downturn and fuelled the monetary turnaround. Moreover, driving forces from oil
speculation changed from unequivocally negative in the years 2014 to 2016 to feebly
positive in the principal half of 2017.
The downturn was driven by the fall in the oil cost in the second 50% of 2014. Oil
venture was at that point contracting in 2013 because of the mind-boggling expense
level, yet the fall raised when the oil cost dove from about USD 110 in the late spring
of 2014 to about USD 50 for every barrel toward the finish of that year. Close to the
9. 3
start of 2016, the oil cost was down to USD 30 for every barrel, except it bounced back
through 2016 to around USD 50 for each barrel. Additionally, the forward market
demonstrated that oil costs would keep on rising. The fall in oil speculation has
moderated in pace with the ascent in oil costs, and a slight increment has been
recorded for as far back as two quarters.
The krone deteriorated forcefully in pace with the fall in the oil cost, in this way going
about as a safeguard for the Norwegian economy. Though a euro cost just NOK 8.20 in
summer 2014, it cost around NOK 9.60 on January 2016, speaking to a krone
deterioration of around 17 for each penny. Estimated regarding both the exchange
weighted conversion scale list (the swapping scale of the Norwegian krone against
Norway`s 25 most vital exchanging accomplices) and the import-weighted krone
conversion scale (the conversion scale against the 44 nations we import most from)
the krone deteriorated 19 for each penny in a similar period. For those industry areas
that contend straightforwardly or in a roundabout way with outside organizations, this
devaluation implied a sharp change in aggressiveness. Lower costs additionally made it
less demanding for organizations that had beforehand conveyed products and
ventures to the oil business to adjust to new markets. For instance, shipyards that used
to construct seaward vessels are presently fabricating journey ships or different sorts
of vessel. In any case, the krone reinforced to some degree in connection to the euro
from the earliest starting point of 2016 and up early September this year, and we
anticipate that the swapping scale will expand tolerably to about NOK 9 toward the
finish of the projection time frame.
Financial strategy has likewise contributed by implication to checking the repeating
downturn, through the krone conversion standard. Norges Bank's key arrangement
rate had been 1.5 for each penny since the start of 2012, however was slowly lessened
from the finish of 2014, to 0.5 for every penny in spring 2016. From that point forward
it has stayed unaltered. The decrease in currency advertise rates has not been similarly
vast, in any case. While the key approach rate was cut by one rated point, currency
advertise rates were just decreased by around 0.8 rate point amid a similar period.
10. 4
Consequently money related approach has not been as expansionary as the key rate
cut may recommend.
The volume of oil area speculation plunged 33 for each penny from the second from
last quarter of 2013 to the final quarter of 2016. Sharp cost slices accomplished
through lower costs for venture items, combined with different measures to advance
efficiency, have made numerous improvement extends possibly gainful presently, even
with oil costs at the present direct level. The fall in oil speculation estimated in
consistent costs subsequently braked forcefully through 2016, and venture expanded
to some degree through the primary portion of this current year. The primer QNA
figures demonstrate volume development of 0.9 for each penny in the primary quarter
and 1.8 for every penny in the second quarter, and that the level in the second quarter
was just insignificantly lower than the second quarter a year ago. Estimated in current
costs, in any case, venture kept on falling up to the principal quarter of this current
year, and in the second quarter was 4.4 for every penny lower than in a similar quarter
a year ago.
11. 5
Literature Review
Many studies have been exercised around the foreign exchange risk exposure to the
asset pricing, where most of them concluded to a strong evidence of exposure, while a
large number of the studies reported the absence of statistically significant exposure.
A significant amount of studies are being examined from the financial and portfolio
manager in a worldwide level, to hedge their assets, liabilities and cash flows against
the foreign exchange risk exposure.
Solnik (1974), Adler and Dumas (1983) and Sercu (1980) demonstrate that the
covariance of assets with price returns ought to be an evaluated factor in the ICAPM.
Financial specialists from various nations confront diverse prices of goods and services
at which they consume their income. Notwithstanding the high market chance
premium, their model incorporates risk premia in light of the covariance of assets with
exchange rates, because of deviations from obtaining power equality. The market cost
of outside trade risk can be either positive or negative, contingent upon the level of
individual financial specialists' relative risk tolerance. Nonetheless, the discoveries
from the exact examinations in the zone do not demonstrate a concession to either
approach that can be utilized in estimating the presentation or the evaluating of the
remote exchange risk in stock returns. According to some researchers, Adam (2009),
Adler & Dumas, 1984; Froot, Scharfstein and Stein (1993), the exposure to the foreign
exchange rate can be reduced through hedging instruments such as futures and
forward contracts. Another aspect, Giddy & Dufey, 1995, supports that firms are also
subjected to nonlinear exposure because of the nonlinear relationship between its
cash flows and exchange rates. This kind of exposure can be also hedged with
nonlinear instruments such as options or portfolios of options.
Vassalou (2000) developed empirical models for relative variables and test the ICAPM
models such as Adler and Dumas (1983), Solnik (1974) and Sercu (1980). She used a
sample data of monthly stock returns over the period January 1973 to December 1990
for 10 counties, namely, Switzerland, the Netherlands, Japan, Australia, Canada,
France, Italy, Germany, the UK, and US to explore the possibility of explaining the
12. 6
differences in average stock returns by the exchange rate and foreign inflation risk
factors. The models used were APT, similar to asset pricing model, but under different
assumptions, related to the relevant risk factors. By decomposing the exchange rate
factor in a common component index, she captured the specific rate fluctuations by
measuring the common moves in all exchange rates in a residual component index. As
a result, she concluded that both the common and residual components of the foreign
exchange risk are usually priced in securities.
An interesting study examined also from Du (2009), who used the tracking portfolio
approach like Breeden et al. (1989), Lamont (2001) and Vassalou (2003) used too. The
main idea of this study was the assumption that the future foreign exchange rates
should take into account for stock returns, since future cash flows are those which
mainly have an impact on stock returns. Future exchange rates also affect the future
cash flows, so the potential movements of exchange rates are more rational for asset
pricing instead of current changes. The risk-free rate, the default premium, the term
premium and a wealth variable are also other independent variables that explain stock
returns, apart from future exchange rate fluctuations. Finally, he concluded that the
premium of the exchange rate risk is positive, while at the same time firms with high
book-to market ratio are more prompt to loadings on the foreign exchange factor.
In a different kind of study, Anatolyev (2008) investigated the factors that affect the
Russian stock market returns over the period 1995 to 2004, by emphasizing in the
development of these over time. He used a sample of 52 observations corresponding
to weekly data for 1 year, for two data sets, in a rolling predictive regression. He
concluded that in recent years, the impact of oil prices and foreign exchange rates on
Russian stock returns has significantly reduced. In another country concentrated study,
Sminou (2011) using data for the period 1993 to 2006, examined the impact of the
insertion of the Euro currency on stock markets and on country diversification within
the Eurozone countries. The results shown that the effect of the insertion of Euro is
not the same among Eurozone countries. Additionally, he proved that the advantages
of international diversification still exists even after the insertion of the Euro in the
markets. He also concluded that there is no high risk to the stock market because of
13. 7
the Euro exchange rate, so there is no reason to justify a risk premium as a result of
the currency union.
Muller and Verschoor (2006) did an empirical investigation regarding the relationship
among European companies’ stock returns and the movements in the currency values
of the EMU`s major trading partners. The sample data used consisted of 817 European
firms with international activities over the period 1988 to 2002. By using a two factor
regression model, they calculated the firm specific exchange rate sensitivity as the
result of the exchange rate movements on the value of a firm, in excess of the global
market`s fluctuations to foreign exchange rate movements. The empirical results
shown that the 13% of European countries with international activities had an
economically significant exposure effects to the Japanese Yen, 14% to the US Dollar
and 22% to the UK Pound. They concluded that a depreciating (appreciating) Euro
against foreign currencies, has a negative (positive) impact on European stock returns.
Although finance theory proposes a strong correlation between market stock returns
and foreign exchange rates, there are also many studies who suggest the opposite.
Some empirical studies, Choi & Prasad (1995), Jorion (1990), Jorion (1991), used a
linear model to validate the finance theory, but failed to find a strong exchange rate
exposure. Different estimation techniques of recent studies, Di Iorio & Faff, 2001;
Priestley & Ødegaard, 2007, also failed to conclude a significant foreign exchange
exposure. An argument for these findings should be that the exposure may be not
linear so it cannot be captured by linear models.
Jorion (1991), also conducted a study by using a two factor and a multi-factor model to
capture the significance of the associate variables in order to investigate the exchange
rate exposure by the presence of the foreign exchange risk premia. The study
examined for the US market over the period 1971-1987 and the factors used are the
market returns, the growth series of industrial production, the change in expected
inflation, the unexpected inflation, the risk premium and the default premium. The
foreign exchange factor regressed with the other variables in the multi-factor model.
As a result, it proved that there is no evidence to support the pricing of the exchange
14. 8
risk in the stock market, but there is only the industry specific relationship between
stock returns and foreign exchange risk. He found an insignificant exposure to foreign
exchange risk. A similar research, Amihud (1994), also concluded where there was no
significant exchange rate exposure for 32 largest exporting companies in US over the
period 1982-1988. In a similar outcome concluded Bartov and Bodnar (1994), whose
checked out the correlation between stock returns and contemporaneous and lagged
the changes in the value to the US dollar. The data used were for the period 1978 to
1990 for 208 US firms with international activity. In the single linear model, as
independent variable, used the lagged changes in the foreign exchange currency value
of US dollar and a constant against the dependent variable of stock returns. The
consistency with the Jorion`s (1991) outcome, proved by the results of the regression
which shown that there is a negligible affection to the stock returns from the
movements in the contemporaneous exchange rate.
On the contrary, there are studies, such as He and Ng (1998) who proven that the
foreign exchange risk is a priced factor in stock returns. The motivations of this study
stems from the work of Amihud (1994) and Bartov and Bodnar (1994) and examined
the foreign exchange exposure for Japanese multinational corporations. The examine
regressed the lagged returns of a trade weighted exchange index, which is built of nine
exchange rates between yen and nine major currencies and measures the price of
foreign currency and market returns against stock returns from 1979 to 1993. Similarly
to Jorion (1990) study, the sample used multinationals with an export ratio at 10% at
least. The results are robust across the two sub-periods and revealed that 25% out of
the 171 sample companies, had significant positive coefficients. Finally, as a
conclusion, the study suggested the existence of the exposure to a firm to foreign
exchange fluctuations which is affected by its export ratio and the hedging policy.
Lengthening of the Jorion (1991) studies, conducted by Griffin and Stulz (2001) which
examined whether the negative or positive shock is contagious between an industry in
a specific market and in the same industry in another market. Also examined if the
movements of exchange rates reflected on industries across the world. The study
focused on the separation of the industry and foreign exchange risk from the common
15. 9
market factor. The explanation they gave was that the depreciation of the currency
might be associated with the decision of the monetary policy, in order to boost the
economy, which has a positive impact on both firms and industries. The sample used
was over the period 1975 to 1997 for US, Japan, UK, Germany, France and Canada and
investigated the foreign exchange movements against the stock excess returns. The
outcome of the regression prove that the effects of industry factor have a strong
economic importance instead of the foreign exchange exposure. These findings are in
linear relationship with the theory of Jorion (1991) who supported that any potential
pricing for that exposure is very difficult to be detected.
Another study who concentrated at Australian΄s equity market, Iorio and Faff (2002),
presumed heterogeneous and inconclusive results. The data used, was for the period
1988 to 1998 in various versions of a two-factor model in order to price the foreign
exchange risk. The examined period split into four sub-periods and the results are that
the exposure of currency risk appeared only in two of the sub-periods. At these two
sub-periods, noticed that the Australian economy was weakness and uncertain and the
Australian dollar was weak too. A revolutionary study, Tai (1999), took place for the
Asia-Pacific countries and the USA and concluded that the fluctuations in the
uncovered interest parity is not due to the market participants but also to a time-
varying foreign exchange risk premium. He suggested that the investors should be
compensated because of the non-diversifiable foreign exchange risk. Alternative study
performed by Tai (2007), for six Asian emerging stock markets for the period of 1986
to 2004, in order to examine the asset returns and volatility by focusing on the pricing
of currency risk and market integration. By using a parsimonious multivariate GARCH-
in-mean approach, a dynamic version of the ICAPM, concluded that the foreign
exchange risk is a priced factor despite the fact that the estimated risk premium is
lower after the liberalization which indicates the reduction of the foreign exchange risk
and the cost of capital for the domestic firms.
In recent studies Zhao (2010), by using monthly data to a VAR and multivariate GARCH
model, analysed the dynamic relationship among exchange rate and stock price in
China over the period January 1991 to June 2009. The results shown that between the
16. 10
exchange rate and stock prices there is no a stable long-term equilibrium relationship.
Additionally, he proved that the information goes only from the exchange rate to stock
price which indicates that the mean effect is not bidirectional. Muller and Verschoor
(2007), by using a sample of 3634 Asian internationally active firms for the period 1993
to 2003, examined three tests. They tested whether there is a relationship between
stock returns and movements in foreign exchange rates, whether the explored
exchange risk exposure patterns are industry focused and whether the firm`s exchange
exposure is more transparent across growing time horizon. They found that 25% of
these firms faced a significant economic exposure to the US dollar, while the 22.5% to
the Japanese Yen. Their improvement was the indication that even if there is a time-
variation in simultaneous exposure effects at the individual firm level, the general
extent of the exposure is not sample dependent.
Carrieri and Majerbi (2006) deduced that the size and the sign of exchange risk
premiums is different among countries and regions. The tests which prove this result
was at market, portfolio and firm level by using a real exchange rate index. They also
include the hypothesis that the unconditional risk premium in emerging markets is not
significant due to the currency risk. The tests also concluded that the coefficients of
exchange risk pricing are higher compared to those estimated for similar frameworks
for developed markets. Antell and Vaihekoski (2007) conducts a test, using data of
European markets over the period 1970 to 2004, by using a conditional ICAPM for the
exposure of currency risk when it is priced in the Finish stock market. By using a
modified multivariate approach of GARCH model, they found that the currency risk is
not time-varying, although it is priced at Finnish market. For Finnish investors, the risk
in local and world market level found to be time-varying, while for US investors the risk
of local market is not significantly priced. Another study for Russian stock market,
Saleem and Vaihekoski (2008), tried to investigate whether currency risk is priced at.
They also used a modified multivariate approach of GARCH-in-Mean framework of De
Santis and Gérard (1998), and they concluded that the currency risk along with the
local and world market risks are priced In the Russian stock market.
17. 11
Doukas et al. (1999), examined a study by using a sample from the 1975 to 1995
consisting of 1079 traded firms on Tokyo Stock Exchange, to check whether the
exchange rate risk is priced in asset returns by using an inter-temporal asset pricing
procedure to test it, that allows the fluctuations of risk premium to be captured in
macroeconomic conditions. The regression proved a strong relationship among
contemporaneous stock returns and unpredictable Yen fluctuations. The results
demonstrate that the currency risk exposure indicates a significant risk premium for
both national -Japanese- high exporting and multinational companies. The same
findings confirmed in his next study, Doukas et al. (2003), where he found that the
exchange rate exposure is priced in a similar way at the industry level.
Another studies, presume to the use of nonlinear models to identify the exposure to
exchange rate. Williamson (2001), by analysing the industry of US, Japan and Germany,
argued the presence of nonlinear exposure to the foreign exchange rate. He inserted a
quadratic foreign exchange rate variable in the classical linear model, under the
assumption of not asymmetrically currency appreciation to stock returns. But this
assumption was also unrealistic due to the fluctuations of stock returns to the changes
in exchange rates. However, at the country market level, a nonlinear exposure
reported which was not asymmetric. The presence of a time varying exposure is
concluded through this mixed evidence. They argued that the number of cases of
significant exchange rate exposures has risen due to the use of nonlinear models.
However, the fluctuation of the stock returns is asymmetrically comparing to the size
of the exposure. An additional empirical study from Priestley and Ødegaard (2007),
indicated a nonlinear exchange exposure in 28 U.S. manufacturing industries which
captured by the different sign of the exposure in case of dollar appreciation and
depreciation. As a general conclusion, they claimed that the exchange rate exposure is
greater in case of extend international trade of the industries. A similar study approach
from Doidge, Griffin and Williamson (2006) examined, by using the portfolio approach
where examined both the nature and the significance of the exchange rate risk to the
value of the firms. This approach involves the sorting of the firms into zero investment
portfolios, to a long portfolio according to the firms with high international trade
activities and in another short portfolio for those with no international activity. In this
18. 12
method, the advantage compared to another studies, was that it allows foreign
exchange exposures to be both nonlinear and time varying. During periods of large
currency appreciations, smaller firms proved to be more prone to the exchange rate
risk exposure which is mostly linked with the international activity of a firm. The
explanation was that the firms with foreign activities have adopted a different financial
risk management strategy. This evidence suggests that the exchange rate exposure has
an economic impact on the value of the firms.
A joint test, using individual stock data for the period 1981 to 1989, was performed
from Choi and Rajan (1997) for market segmentation and currency risk pricing for
sever major countries outside of USA. They used a multifactor model which variables
were a currency risk factor to domestic and world market factors. They concluded that
many capital markets are partially segmented due to the indication that the structure
of asset returns factor is internationally heterogeneous. As a result, asset returns
significantly affected by the currency risk in domestic and world markets. A contrary
study examined by Kolari et al. (2008), over the period 1973 to 2002 between the
cross-section of US stock returns and foreign exchange rates. The findings demonstrate
that the stocks with lower returns than others, are more sensitive to the foreign
exchange risk exposure. Additionally, they found that the foreign exchange risk is
priced in the cross-section of US stocks. In contrast with the predictions of asset pricing
models, they proved that there is no linear relationship between expected returns and
foreign exchange exposure.
A Canadian study, Mohammad Al-Shboul & Sajid Anwar (2013), with the use of linear
model argued that when the Canadian dollar were floating, the value of the Canadian
firms were significantly affected by the exchange rate risk. This study used monthly
data for the period 2003 to 2010 and also concluded that the stock market in Canada is
partially segmented and the exchange rate risk is time varying. Using the same time
period, the researchers concluded to the existence of a long run relationship between
the exchange rate risk pricing and the interest rate and also that this relationship still
stable during global market return fluctuations. Another study, Adler & Dumas (1984),
Jorion (1991), Allayannis & Ofek (2001), which conducted for thirteen Canadian
19. 13
industry sectors, used weekly data from 2003 to 2011 in order to examine the
exposure of the exchange risk factor. This study considered both the pre and post
Global Financial Crisis periods and examined whether the exchange rate risk is priced
at Canadian industry sectors and concluded that the pricing of exchange rates is time
varying and that there is a long term relationship between exchange rates, term
structure and interest rate. A significant factor which react on firm value, is the
corporate foreign currency cash flows. The leading factors which affect foreign
currency cash flows are the exports, imports, foreign debt, cash flows of foreign
subsidiaries and foreign portfolio investments. Comparatively exposures may occurred
from the effect of foreign exchange rates fluctuations on prices and quantities which
have a significant impact on production costs and market shares. This study
contributed to the literature review in both ways due to the investigation of the
asymmetric effects, in sign and size, of exchange rate exposure on stock returns using
parametric and nonparametric tests.
Market Segmentation
Most of the countries worldwide and the regions in general, have barriers in their
exchanges such as political risk, legal issues, and business cycles which are the factors
to create market segments. So, even if stock investors want to move from one market
to another in order to maximize their expected returns where is available in other
markets, they “suffer” from the restriction created of market segmentation (Black,
1974). As the expected returns are influenced by global risk factors, the pricing of an
asset follow the same rules and address in all markets. The stock investors expected
the country-specific risk to be fully diversified, and encounter common risks by pricing
only the common risk factors in case of the stock market which is fully integrated. On
the other side, in case of equity markets, the expected returns should be priced by
global and domestic risk factors, because the determination of asset pricing varies
between countries and expected returns. In case of partially segmentation in a market,
investors should price again both the common and country-specific risk. Consequently,
a synthesis of local and global risk factors is expected to influence the expected
20. 14
returns. Nevertheless, the expected returns of a diversified world portfolio will be
different in case of local or global market risk factors, or in a combination of them.
Numerous studies, Jorion and Schwartz (1986), Mittoo (1992), Bekaert and Harvey
(1995), Choi and Rajan (1997), and Saleem and Vaihekoski (2008, 2010), scrutinized the
issue of market segmentation under including a foreign exchange risk factor into a
multifactor asset pricing model. In point of fact, as the countries absorbed in
international trade, the presence of segmentation does not exist. Only partial market
segmentation exists in case of an investor who influenced by both local and world
market risk factors. This implies that investors limited by specific barriers that impede
them for some investment opportunities in other markets with higher expected
returns.
21. 15
Methodology and data
By summarizing, only a few studies have focused on Norwegian`s market and none of
the available studies has considered the possibility of nonlinear and asymmetric
exchange rate exposure. This research aims to extend the existing literature by
providing a comprehensive analysis of the Norwegian case.
Data Description
The sample used for the purposes of this thesis, was all listed companies on the Oslo
Stock Exchange from 30/06/2008 to 30/06/2018. The data used was monthly stock
returns for the examined period, summing a total number of 12,221 observations. The
data used for the modeling are stock closing prices, stock returns, the 3-month
Treasury Bill of Norway as risk free rate, market indices prices and accounting data of
the sample firms, were collected from the Bloomberg and Lipper database.
The companies used as the main sample, are 100 companies listed at the Oslo Stock
Exchange since 2008. In order to avoid the biasness of all companies, the number of
historical data were limited under specific conditions. Companies which merged or
acquired during the examined period were excluded from the final sample. Also, the
companies which have been under suspension or delisted for a time period, excluded
from the initial sample. Additionally, companies with no available data information for
more than 6 years for the Market Capitalization and Book-to-Market ratio are also not
included in the sample.
Financial data used in order to separate the companies into portfolios according to
their Market Capitalization and Book-to-Market ratio. For the accounting data, were
used annually data for the sample period. Also, companies with negative Book-to-
Market ratio excluded from the sample, according to Fama and French model used.
22. 16
Methodological Issues
Following the methodology of Apergis et al. (2011), I estimated three models in order
to examine the sensitivity of stock returns to foreign exchange risk. The examined
period of the research is from 2008 to 2018. The purpose of this period is to observe
the relationship of stock returns to foreign exchange after the latest greater financial
crisis, which took place at 2008.
The first estimation made to verify the sensitivity of each stock to exchange rate
movements over the examined period. The correlation between stock returns and the
changes in the value of Norwegian Krone (NOK) captures the sensitivity of each stock
to foreign exchange.
By using the Fama and French five factor model,
(Ri-Rf)t = ai + bi(RM-Rf)t + siSMBt + hiHMLt + wiWMLt + fiFXt + εi Eq.(1)
The excess return of each stock was regressed against the foreign exchange return
which figurate the NOK Effective Exchange Rate. The other three factors captured the
size, the value and the momentum effects. Ri is the log returns of stock i, Rf is the log
returns of the risk-free rate, Rm is the log returns of the stock market index and (Ri-
Rf)t is the excess return of each stock i. The size effect is captured by the SMB factor
which is the log returns on a mimicking portfolio that is long in small size stocks and
short in on big size stocks. The value effect captured by the HML factor which is the log
returns on a mimicking portfolio that in long in high Book-to-Market ratio stocks and
short on low Book-to-Market ratio stocks. The momentum effect captured by the WML
factor which is the log returns on a mimicking portfolio that is long in winner stocks
and short in loser stocks. The FX factor captures the log returns of the NOK Effective
Exchange Rate and ei is the standard error.
The 3-month Treasury Bill of Norway is used as the risk-free rate of return. As a market
proxy the MSCI Norway index is used which is designed to measure the performance of
23. 17
the large and mid-cap segments of the Norwegian market. With 10 constituents, the
index covers approximately 85% of the free float-adjusted market capitalization in
Norway.
To measure the foreign exchange returns (FXt), the effective exchange rate of
Norwegian Krone is used, which is compiled by the ECB. It is a measure of the value of
Norwegian Krone currency against a weighted average of several foreign currencies
divided by a price deflator or index of costs. The trade weighted exchange trade (TWI)
calculated against of Norway`s main trading partners. It is a geometric average using
the OECD`s trade weights (Table 1).
The NOK effective exchange rate is set at the value of 100 at the first day of the
examined period (30/06/2008).
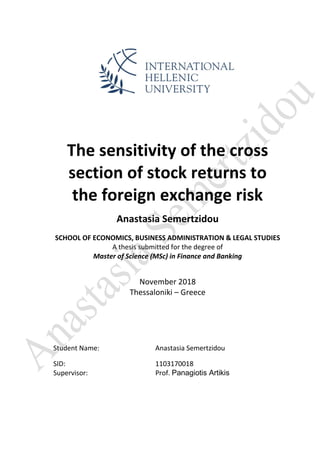
In the graph below, there are the movements of the NOK Effective Exchange Rate.
When the foreign exchange index goes up, the NOK is strengthening against the other
currencies and so it becomes more expensive for those who wants to exchange foreign
currency to NOK. By contrast, when it goes down, the NOK depreciated, so it is
competitive against the other foreign currencies and it is cheaper to exchange into
NOK. As it can be seen in Figure 1, during the examined period, the Effective Exchange
Rate of NOK indicates almost equally appreciated and depreciated course, implying
24. 18
that the coefficients of Fi should turn out to be positive when it is appreciated and turn
out to be negative when it is depreciated.
Fig.1 Effective Exchange Rate of NOK
Eq.(1) is estimated annually using monthly data and one year rolling periods which was
the beginning of July of each year, for example the first estimation period was from
July 2008 to June 2009 and by this procedure we obtained firm-specific values of the Fi
coefficients for 2008. The procedure was repeated accordingly for the next years until
2018 in order to create the full time series, as it can be seen in Table 2 below.
Table 2. Portfolio Construction Dates
Portfolio Construction Date Regress stock returns against SMB, HML, WML, Rm-Rf, FX
From To
30/06/2008 01/07/2008 30/06/2009
30/06/2009 01/07/2009 30/06/2010
30/06/2010 01/07/2010 30/06/2011
30/06/2011 01/07/2011 30/06/2012
30/06/2012 01/07/2012 30/06/2013
30/06/2013 01/07/2013 30/06/2014
30/06/2014 01/07/2014 30/06/2015
30/06/2015 01/07/2015 30/06/2016
30/06/2016 01/07/2016 30/06/2017
30/06/2017 01/07/2017 30/06/2018
25. 19
For each portfolio construction date, we estimated the firm-specific foreign exchange
exposure Fi from Eq.(1) and then the firms were ranked based on the value of their
coefficients into 10 portfolios, the 1st portfolio having the lower (negative) values and
the 10th having the higher (positive) values of the exposure in foreign exchange risk. In
the next step, a cross-sectional average of the returns was computed within each of
the 10 portfolios for each portfolio construction date as described (Table 2) above. The
last step involved, for each portfolio, the computation of an inter-temporal average of
the annual portfolio returns. To explain more, by using all annual total returns
associated with the portfolio ranked number 10 (firms with the most positive exposure
to foreign exchange risk), computed another average across time periods (by averaging
the average returns from 2008 to 2018). The procedure repeated for the rest
remaining portfolios. Portfolios 1 and 10 consist of stocks with the highest absolute
(positive or negative) foreign exchange exposure. Finally, calculated the return of the
hedge (zero-investment) portfolio as the value weighted monthly return of stocks in
portfolios 2 through 9 minus stocks in portfolios 1 and 10. To further examine the
exposure of firms to foreign exchange rates fluctuations, computed the average
Market Capitalization –in order to capture the firm size- and the average Book-to-
Market equity ratio and ranked accordingly for each portfolio (Table 3).
The next step of the methodology was to create the SFXI (sensitivity foreign exchange
minus insensitive) factor, which referred to the construction of a foreign exchange risk
factor in such manner as to capture the relationship between risk and expected
returns. The factor created as a zero-investment portfolio which has long position in
stocks that have the extreme negative or positive sensitivity to the foreign exchange
risk (portfolios ranked 1 and 10) and short position in all other stocks (portfolios
ranked 2 through 9). By regressing the SFXI factor, as a pricing factor of the model, the
expected result was to reduce the main pricing error of the other pricing models
examined (two-factor model, three-factor model, four-factor model).
To test this assertion, regressed 2 groups of linear regressions. On the first group,
regressed the excess returns of each of the 10 sensitivity based portfolios against (i)
the market risk premium, (ii) a Fama-French three factor model and (iii) a Fama-
26. 20
French-Carhart four factor model. Then, the same procedure repeated for the second
group of regressions, by including the SFXI factor to each pricing model and
recalculated the intercepts of the 10 foreign exchange sensitivity portfolios.
Group 1:
(Ri-Rf)t = ai + bi(RM-Rf)t + εi Eq.(2)
(Ri-Rf)t = ai + bi(RM-Rf)t + siSMBt + hiHMLt + εi Eq.(3)
(Ri-Rf)t = ai + bi(RM-Rf)t + siSMBt + hiHMLt + wiWMLt + εi Eq.(4)
Where (Ri-Rf) are the excess returns of each of the 10 sensitivity portfolios, Rf are the
log returns of the risk-free asset, RM are the log returns of the stock market index,
SMB are the log returns of the size mimicking portfolio, HML are the log returns of the
value mimicking portfolio, WML are the log returns of the momentum mimicking
portfolio and εi is the standard error.
Group 2:
(Ri-Rf)t = ai + bi(RM-Rf)t + fiSFXIt + εi Eq.(5)
(Ri-Rf)t = ai + bi(RM-Rf)t + siSMBt + hiHMLt + fiSFXIt + εi Eq.(6)
(Ri-Rf)t = ai + bi(RM-Rf)t + siSMBt + hiHMLt + wiWMLt + fiSFXIt + εi Eq.(7)
Where SFXI are the log returns of the foreign exchange pricing factor.
Through the estimation of these two groups’ regressions, it is easier to observe the
change in the explanatory power of the independent variables and in the explanatory
power of the asset pricing models.
27. 21
Empirical Analysis
Prior to the methodological approach, it is useful to mention that there is no need to
do unit root tests for the variables excess returns of sample stocks, market excess
return, SMB, HML, WML, SFXI because they are stationary by construction.
In line with the methodology described above, the sample firms were ranked
according to the value of their foreign exchange exposure (fi) into 10 portfolios, with
the companies with the highest negative exposure are ranked in portfolio 1 while
those with the highest positive exposure are ranked in portfolio 10. The foreign
exchange sensitivity exposure coefficient captures the daily movement of the excess
return of a stock when the effective exchange rate of the NOK index rises by 1%.
Foreign Exchange
Sensitivity Portfolio
Average FX
sensitivity (fi) in %
Average Annual
Raw Return
Average MCAP
(in million €)
Average
BE/ME
1 -2.7833 -36.06% 1 662.82 2.8256
2 -1.1356 -11.36% 2 474.10 4.0546
3 -0.7775 -13.53% 3 667.20 1.6012
4 -0.4684 -19.27% 2 281.11 1.5365
5 -0.1312 -1.81% 81 886.53 1.1462
6 0.3109 2.24% 6 931.23 1.0831
7 0.5888 3.68% 23 495.91 1.4090
8 0.9992 5.79% 5 203.15 0.8995
9 1.4942 -1.71% 9 010.86 1.5423
10 3.0329 -26.16% 1 301.69 1.4995
(2U9)-(1U10) 26.614%
Table 3. Raw returns of 10 portfolios based on foreign exchange sensitivity
Under the assumption of equally weighted firms into each portfolio.
The significance level is at 5%.
The negative foreign exchange coefficient exposure indicates that as the effective
exchange rate index declines, the NOK also underestimated against the currencies
basket, and so the daily price performance of the sample firms increases. As a result,
the Norwegian exporting companies would receive more domestic currency -NOK- for
a certain amount of foreign currencies when the Norwegian Krone underestimated
against other currencies, so they are positively affected when NOK depreciates. So,
companies which ranked in the first five portfolios are seems to be mainly exporters.
28. 22
On the contrary, the companies who ranked into the last five portfolios, with the
positive foreign exchange coefficient exposure, indicates that when the effective
exchange index increases, the NOK appreciated against the currency basket and so the
daily price performance of these companies also increases. As an impact, the
Norwegian importing companies needed to pay less NOK for a certain amount of
foreign exchange when the NOK exchange rate increases against other currencies, they
are positively affected when the NOK appreciates. Thus, companies on portfolios 6 to
10, which have a positive foreign exchange exposure, seems to be importers.
As it can be seen in the Figure 2 below, the foreign exchange sensitivity is nonlinear
with the returns (U shape), as it could be expected. The result reveals from the fact
that even the portfolio 1 and 10 have the highest absolute value in foreign exchange
exposure, the annual raw returns are not moving respectively and exhibits the lowest
levels.
Furthermore, the large companies in terms of market capitalization, appeared to have
lower, in absolute values, foreign exchange sensitivity -for example portfolio 5 and 7-
while the smaller companies are the ones that have the higher foreign exchange
sensitivity. This indicates that there is linear relationship, in terms of market
capitalization, between the size of the company and the foreign exchange exposure.
Actually, is observed that the larger companies have the lower foreign exchange
exposure which seems that these companies hedge effectively a large part of their
foreign exchange exposure.
In a similar approach, is evidenced that the companies with the highest foreign
exchange exposure are also the ones with the higher Book-to-Market equity ratio as
well.
Eventually, it must be mentioned that average raw returns of the combined portfolio
(containing the portfolios 1 and 10 with the most foreign exchange sensitive stocks), is
lower than those of the remaining portfolios by 26.614%.
29. 23
Fig.2 Annualized average returns of FX sensitivity of 10 portfolios
Considering the previous results, companies with the higher foreign exchange
sensitivity are the ones with the lower size and the higher Book-to-Market ratio which
is an indicator that the foreign exchange exposure of the companies should be
considered as a pricing factor in an asset pricing model. In order to ensure and validate
the results, it constructed a foreign exchange zero-investment risk portfolio (SFXI)
which take long position in stocks that have the absolute higher sensitivity to foreign
exchange risk and short positions in all other stocks.
To further investigate the research and to verify the results, I regressed the excess
returns of the 10 portfolios firstly, against a one-factor model with the market risk
premium as the independent factor and secondly, against a two-factor model with the
market risk premium and the SFXI as the independent factors.
On the table below (Table 4), there is the regression between the excess returns and
the market risk premium and the results shows that the coefficients are positive and
statistical significant at the 5% significance level for all foreign exchange sensitivity
portfolios (except portfolio 3), as it was expected. The results indicate that when the
market risk premium increases by 1%, the foreign exchange sensitivity portfolios are
also expected to increase from 0.44% to 1.15%. Moreover, the coefficients of the
30. 24
constant term are also positive and statistical significant in most of the regressions. To
deepen further, given the low R2 in most of the portfolios, it captures the fact that the
market factor cannot interpret alone the returns of the foreign exchange sensitivity
portfolios. Further diagnostical tests are also applied in order to investigate the
absence of model misspecification. As the values of the Durbin Watson statistic are
almost equal to 2, this indicates that there is no autocorrelation. The values which are
between 1.5 and 2.5, for this sample size, seems to be also normal. Both tests are
performed in the 2nd lagged order.
(Ri-Rf)t = ai + bi(RM-Rf)t + εi
Portfolio a b R²-bar DW Test LM Test
(1) 0.150879 0.442858 0.414263 1.804345 3.53543
[4.425205] [2.659421]
(2) 0.011034 0.661054 0.503612 1.595825 2.888276
[0.599265] [3.185207]
(3) 0.039053 -0.003098 0.00008 1.958679 0.959615
[2.038658] [-0.008909]
(4) 0.034286 0.93005 0.530297 2.03832 1.091684
[1.026097] [3.360066]
(5) -0.024406 0.880821 0.274133 1.931975 0.022476
[-1.168961] [1.943356]
(6) 0.005441 1.049787 0.58988 1.818831 1.307837
[0.301245] [3.792508]
(7) 0.007047 1.111162 0.937722 2.087517 1.152716
[0.677774] [12.27076]
(8) 0.032521 1.036872 0.865708 1.964903 1.171993
[1.850007] [8.028977]
(9) -0.003204 1.158234 0.76527 1.718093 0.851622
[-0.194315] [5.709822]
(10) -0.000393 0.94385 0.834119 1.977558 4.071289
[-0.016177] [7.091137]
Table 4. Univariate regressions of excess return against market risk premium
The significance level is at 5%.
Ri−Rf is the foreign exchange sensitivity portfolio excess return, RM−Rf is the market risk premium.
Durbin Watson and LM is the serial correlation diagnostic test.
In the next step, are summarized the results of the bivariate model (Table 5). The
coefficients of the market risk premium factor are still in the same range but with a
higher significance level – the t-statistics are higher is absolute values than in the null
hypothesis at 5% significance level. Contrariwise, the foreign exchange risk factor is
31. 25
negative in all of 10 portfolios with also high statistical significance which stem from
the high foreign exchange sensitivity portfolios. Consequently, when the SFXI factor
increases by 1%, it is expected that the excess returns of all of the 10 portfolios will be
decreased by 1%. In terms of adjusted coefficient of determination, the bivariate
model for all portfolios seems to be better fitted than the one-factor model, which
means that both the market risk premium and the SFXI factor are explanatory variables
of the excess returns movements. There is still no autocorrelation in the coefficients,
which indicates that the fluctuations of the past returns do not predict the future
movements of the returns. Thus, it does not violated the assumption of instance
independence.
Portfolio a b f R²-bar DW Test LM Test
(1) 0.074805 0.502457 -1.068937 0.679087 1.792182 1.005309
[1.939965] [3.813589] [-2.725248]
(2) -0.035989 0.357664 -1.469977 0.880237 2.018639 3.051981
[-2.768361] [2.940094] [-5.320025]
(3) 0.001168 0.147727 -0.88177 0.877527 1.229091 3.921527
[0.137494] [1.139306] [-8.030247]
(4) 0.004631 0.702517 -1.340182 0.875627 2.217741 3.105931
[0.242822] [4.477899] [-4.998904]
(5) -0.002155 0.832643 -1.119463 0.894581 1.695627 2.8095
[-0.241412] [4.570107] [-7.278021]
(6) -0.014525 0.955814 -0.905857 0.911161 1.657604 0.443695
[-1.524568] [6.987178] [-5.705079]
(7) 0.008224 0.994441 -0.476274 0.946792 2.001956 0.172393
[0.808259] [7.703333] [-1.238582]
(8) 0.010218 0.929712 -1.180752 0.925099 2.245428 4.394359
[0.632271] [8.506805] [-2.671408]
(9) -0.012319 1.053051 -1.10384 0.966121 1.764468 1.248312
[-1.833245] [12.76431] [-7.304544]
(10) -0.019638 0.956803 -1.100452 0.985523 1.782354 1.119734
[-2.513646] [23.07248] [-9.701857]
Table 5. Bivariate regressions of excess return against market risk premium and the FX risk factor
(Ri-Rf)t = ai + bi(RM-Rf)t + fiSFXIt + εi
The significance level is at 5%.
Ri−Rf is the foreign exchange sensitivity portfolio excess return, RM−Rf is the market risk premium, SFXIt
the realized return on the portfolio that is long on stocks with high foreign exchange sensitivity and
short on stocks with low foreign exchange sensitivity. Durbin Watson and LM is the serial correlation
diagnostic test.
32. 26
To further investigate the research, the next step involves the regression of the excess
returns of the 10 portfolios against a three factor (Table 6) and a five factor (Table 7)
Fama-French models. The new factors are the SMB and the HML.
Most of the SMB coefficients are negative (6 out of 10 portfolios) which indicates that
there is a negative relationship between the returns of the foreign exchange sensitivity
portfolios and the size risk factor. But for those 4 portfolios with the positive
coefficients, is appeared that there are portfolios including large-cap firms, means that
the size factor interprets an important part of the variation in the average return of
shares and it represents a potential risk factor in stock returns which is linked to the
foreign exchange exposure of firms. Also, there is no illustration for the portfolios 1
and 10, the ones with the highest absolute foreign exchange sensitivity, regarding the
size effect on the foreign exchange risk. Thus, the size of these firms is not related to
the foreign exchange sensitivity. On the other side, for those with the negative SMB
coefficients, indicate that the SMB factor is not a strong risk factor in stock returns,
and so it does not linked with the foreign exchange exposure of the firms.
For the HML factor, it is identified that all the portfolios have a negative relationship
with the HML portfolio which involves that there is no explanatory power of this factor
to the average excess returns. Since, the three factor Fama-French model exhibits to
be fitted better that the one-factor model with a higher explanatory power.
33. 27
Portfolio a b s h R²-bar DW Test LM Test
(1) 0.132951 0.59194 -0.020792 -0.014495 0.608244 1.706756 1.016994
[4.066549] [3.478649] [-1.737668] [-1.341921
(2) 0.002484 -0.069196 -0.027251 0.012569 0.762803 2.004886 0.854589
[0.168379] [-0.225107] [-2.940672] [1.980486]
(3) 0.040937 0.462082 -0.037638 -0.019834 0.6660066 2.15105 2.327729
[3.280168] [1.751604] [-3.450541] [-3.354098]
(4) -0.010542 0.952429 -0.010695 -0.023822 0.630824 1.854888 1.947197
[-0.234382] [3.173463] [-0.599787] [-1.452545]
(5) -0.027894 0.994139 0.0138 -0.002201 0.350746 2.006233 1.70172
[-1.192717] [1.976618] [0.944742] [-0.298358]
(6) -0.000664 1.115293 0.020045 -0.005239 0.765736 1.979607 0.051432
[-0.032440] [4.203239] [2.356927] [-0.610096]
(7) 0.00534 1.162516 -0.011602 -0.001662 0.955993 1.984982 4.437474
[0.434667] [12.86056] [-1.731535] [-0.246030]
(8) 0.013917 0.98579 0.012952 -0.011974 0.915366 1.987805 3.18975
[0.756899] [8.052715] [1.576775] [-1.43665]
(9) -0.007779 1.230432 0.012433 -0.007897 0.83169 1.579132 4.308494
[-0.409711] [6.268231] [1.0119457] [-1.26306]
(10) -0.001235 0.965208 -0.006309 -0.012125 0.847293 1.91797 4.839301
[-0.046791] [6.542720] [-0.201874] [-0.827327]
Table 6. Multivariate regressions of the Fama-French model
(Ri-Rf)t = ai + bi(RM-Rf)t + siSMBt + hiHMLt + εi
The significance level is at 5%.
Ri−Rf is the foreign exchange sensitivity portfolio excess return, RM−Rf is the market risk premium, SMB
is the realized return on a portfolio that is long on small sized firms and short on big sized firms and HML
is the realized return on the portfolio that is long on high BE/ME equity stocks and short on low BE/ME
equity stocks. LM is the serial correlation diagnostic test.
The empirical results of the three factor Fama-French model along with the foreign
exchange risk factor are shown in the table below (Table 7). The results of the
coefficients of the three factors are remain quite stable except the two more positive
signs in the SMB coefficients. The SFXI factor appears with negative coefficients for all
portfolios with a range of -0.27 to -1.31 and also with a high significance level which
interpreted as when the return of the SFXI factor increases by 1%, the excess returns
of all the portfolios will be increased from 0.27% to 1.31%.
The significance level of determination is extreme high for all portfolios, indicating that
all the explanatory factors contain additional information in the risk factors and so
they should not be omitted of the model. The normality in still remaining regarding the
appearance of autocorrelation in the coefficients.
34. 28
Portfolio a b s h f R²-bar DW Test LM Test
(1) 0.064853 0.623604 -0.016721 -0.014252 -0.978902 0.824508 2.996241 7.52126
[1.969044] [5.10188] [-1.927964] [-1.843922] [-2.937066]
(2) -0.029522 0.144608 -0.010503 0.004551 -1.169963 0.902748 2.848086 8.762838
[-2.06873] [0.654522] [-1.27293] [0.905572] [-3.173809]
(3) 0.011264 0.296677 -0.016035 -0.007906 -0.668067 0.93993 2.203816 4.852068
[1.459067] [2.409401] [-2.565191] [-2.316738] [-5.649823]
(4) -0.0108 0.78629 0.0063 -0.009597 -1.318755 0.903207 2.019447 3.468907
[-0.438653] [4.666511] [0.600834] [-1.006846] [-4.438311]
(5) -0.002187 0.856558 0.005305 -0.003063 -1.097295 0.917296 2.441799 5.711665
[-0.226292] [4.439826] [0.929655] [-1.087033] [-6.924773]
(6) -0.013657 0.993968 0.012623 -0.004591 -0.775525 0.978633 2.000047 2.140673
[-2.010645] [11.43919] [4.373635] [-1.655305] [-8.351431]
(7) 0.005121 1.090089 -0.009512 -0.002448 -0.270998 0.958374 1.731925 7.190621
[0.400817] [7.359949] [-1.233695] [-0.343349] [-0.632708]
(8) -0.002056 0.863703 0.014921 -0.005941 -1.15589 0.966238 2.416008 4.653227
[-0.15393] [9.511786] [2.674391] [-1.002472] [-3.247711]
(9) -0.013208 1.095012 0.005266 -0.003707 -1.004696 0.978016 2.088983 0.717136
[-1.789942] [13.96822] [1.090906] [-1.487552] [-6.825887]
(10) -0.020643 0.957284 0.004986 -0.004177 -1.086873 0.98786 1.79208 0.427214
[-2.504799] [21.52364] [0.524611] [-0.927139] [-9.002844]
Table 7. Multivariate regressions of the Fama-French model with the FX risk factor
(Ri-Rf)t = ai + bi(RM-Rf)t + siSMBt + hiHMLt + fiSFXIt + εi
The significance level is at 5%.
Ri−Rf is the foreign exchange sensitivity portfolio excess return, RM−Rf is the market risk premium, SFXIt
the realized return on the portfolio that is long on stocks with high foreign exchange sensitivity and
short on stocks with low foreign exchange sensitivity, SMB is the realized return on a portfolio that is
long on small sized firms and short on big sized firms and HML is the realized return on the portfolio that
is long on high BE/ME equity stocks and short on low BE/ME equity stocks. Durbin Watson and LM is the
serial correlation diagnostic test.
As the final step of the research, it should be regressed the excess returns of each
portfolio against the four and the five factor Fama-Frenc-Carhart models which contain
the market risk premium, SMB, HML, WML and SFXI factors. The results of both
regressions are in the tables below (Table 8 and 9).
On table 8, the results of the coefficients for the 10 portfolios of the market risk
premium, SMB and HML are remain quite stable as compared to the results of the
three factor Fama-French model (Table 6). There are only some changes in the signs of
the HML coefficients but with no statistical significance. The addition of the
momentum factor exhibits a decrease in the adjusted coefficients of determination in
some of the cases. However, there is no statistical significance it its coefficients.
35. 29
The gradually regression of each model, provides insights of the incremental power of
the explanation factors contained in each regression (Table 9). There is a relative
stability in terms of sign, size and statistical significance for the market risk premium,
the SMB, HML and WML as compared to the four factor model. By including the
foreign exchange risk factor in the model, the explanatory power of the model
increased as the high level of the R2 proves. The coefficients of the SFXI factor are
negative for the 10 portfolios, with a high statistical significance power. The constant
term appears with mixed positive and negative values with no statistical significance –
except for the first portfolio. According to Merton (1973), in order a multifactor model
to be considered as asset pricing model, the constant term of that model should be
equal to zero or statistically significant. So, as the conclusion, although the foreign
exchange risk factor increase the predictability of the model, it does not appear to
explain fully the variability of the stock returns.
36. 30
Portfolio a b s h w R²-bar DW Test LM Test
(1) 0.151444 0.624194 -0.015749 0.000398 0.005482 0.632738 1.876116 2.830539
[3.49491] [3.42306] [-1.09230] [0.01626] [0.68328]
(2) 0.006092 0.023123 -0.026861 0.007578 -0.005799 0.801906 1.594727 1.693597
[0.41344] [0.07449] [-2.96501] [1.00849] [-1.17550]
(3) 0.055916 0.703687 -0.03784 -0.033311 -0.010948 0.751253 2.442757 3.549884
[3.71866] [2.43422] [-3.75980] [-3.24348] [-1.54885]
(4) 0.022033 0.915838 -0.001234 0.003193 0.014766 0.734651 2.561328 4.174853
[0.48671] [3.35585] [-0.07201] [0.14463] [1.65500]
(5) -0.029041 0.987973 0.013993 -0.001757 0.000809 0.350903 1.967335 1.928354
[-0.77540] [1.77011] [0.85846] [-0.13126] [0.04112]
(6) 0.000425 1.144407 0.020693 -0.002537 -0.00614 0.794179 2.093448 2.091342
[0.02071] [4.27773] [2.42094] [-0.28086] [-0.98355]
(7) 0.007612 1.134635 -0.010864 0.002687 0.003936 0.957436 2.067551 6.291818
[0.55431] [10.2275] [-1.50773] [0.23560] [0.48716]
(8) 0.010118 1.018536 0.01023 0.004268 0.012462 0.936509 1.958673 1.482013
[0.58804] [8.8291] [1.30945] [0.32477] [1.52678]
(9) -0.011849 1.275701 0.015532 -0.008521 -0.005048 0.838031 1.825338 5.322441
[-0.55429] [5.71336] [1.10208] [-1.27865] [-0.52350]
(10) 0.006322 0.900463 -0.00048 -0.010648 -0.01277 0.850127 2.672 6.772948
[0.18155] [3.80246] [-0.01304] [-0.66364] [-0.36382]
Table 8. Multivariate regressions of the Fama-French-Carhart model
(Ri-Rf)t = ai + bi(RM-Rf)t + siSMBt + hiHMLt + wiWMLt + εi
The significance level is at 5%.
Ri−Rf is the foreign exchange sensitivity portfolio excess return, RM−Rf is the market risk premium, SMB
is the realized return on a portfolio that is long on small sized firms and short on big sized firms, WML is
the realized return on the portfolio that is long on high winner stocks and short on loser stocks and HML
is the realized return on the portfolio that is long on high BE/ME equity stocks and short on low BE/ME
equity stocks. Durbin Watson and LM is the serial correlation diagnostic test.
37. 31
Portfolio a b s h w f R²-bar DW Test LM Test
(1) 0.088322 0.684871 -0.00726 0.012095 0.009686 -1.111225 0.897019 1.869107 8.625661
[2.989163] [6.495596] [-0.851584] [0.844308] [2.055415] [-3.924017]
(2) -0.027038 0.154576 -0.011284 0.003828 -0.001323 -1.109238 0.904407 2.771782 7.965948
[-1.580037] [0.647837] [-1.231703] [0.656774] [-0.322686] [-2.536458]
(3) 0.015957 0.355497 -0.017242 -0.011332 -0.002261 -0.632052 0.942771 2.082563 5.16504
[1.34766] [2.106933] [-2.480386] [-1.56599] [-0.545738] [-4.480962]
(4) -0.012037 0.785224 0.006193 -0.01041 -0.000559 -1.338218 0.903297 2.209541 5.908539
[-0.384074] [4.303174] [0.542664] [-0.694153] [-0.074503] [-3.23476]
(5) 0.003883 0.886846 0.004252 -0.005338 -0.004128 -1.106667 0.921335 2.943065 8.786885
[0.259872] [4.214448] [0.674422] [-1.054747] [-0.55505] [-6.596113]
(6) -0.013657 0.993969 0.012623 -0.004591 -1.72E-07 -0.775522 0.978633 2.165348 3.345372
[-1.841849] [10.41658] [3.970615] [-1.454477] [-0.0000737] [-7.196911]
(7) 0.007164 1.069651 -0.008981 0.001484 0.003516 -0.254294 0.959516 1.839902 8.101137
[0.494494] [6.466899] [-1.080395] [0.121584] [0.411429] [-0.555174]
(8) -0.001833 0.891551 0.013544 0.000242 0.005274 -1.023446 0.969357 1.923346 6.909131
[-0.133388] [8.915299] [2.255044] [0.024223] [0.781516] [-2.536128]
(9) -0.012895 1.090777 0.004985 -0.00364 0.000414 -1.008547 0.978057 2.057319 0.581373
[-1.517056] [11.64546] [0.851094] [-1.316771] [0.105304] [-6.187702]
(10) -0.011768 0.880467 0.011949 -0.002389 -0.015145 -1.091683 0.991843 2.288056 4.652462
[-1.31459] [14.74682] [1.278493] [-0.579498] [-1.711641] [-10.2098]
Table 9. Multivariate regressions of the Fama-French-Carhart model with the Fx risk factor
(Ri-Rf)t = ai + bi(RM-Rf)t + siSMBt + hiHMLt + wiWMLt + fiSFXIt + εi
The significance level is at 5%.
Ri−Rf is the foreign exchange sensitivity portfolio excess return, RM−Rf is the market risk premium, SFXIt
the realized return on the portfolio that is long on stocks with high foreign exchange sensitivity and
short on stocks with low foreign exchange sensitivity, SMB is the realized return on a portfolio that is
long on small sized firms and short on big sized firms, WML is the realized return on the portfolio that is
long on high winner stocks and short on loser stocks and HML is the realized return on the portfolio that
is long on high BE/ME equity stocks and short on low BE/ME equity stocks. Durbin Watson and LM is the
serial correlation diagnostic test.
38. 32
Conclusions
The foreign exchange risk factor come into being the most important policy variable.
Numerous studies have been committed during the last two decades, in order to
present empirical evidence with regard to the effects of exchange rate movements to
the firms and industries. Still none of the studies have found a benchmark approach to
measure the foreign exchange exposure since it is the main risk factor that firms have
to deal with. In order to shed light on the empirical findings, I considered the case of
Norway in finding a methodological specification to measure the foreign exchange
exposure. Only a few studies have investigated the presence of foreign exposure in
Norway, especially the role of that risk after the Global Financial Crisis of 2008. By
making use of monthly data from 2008 to 2018, the research captured the effects of
foreign exchange risk in 100 Norwegian listed companies. It considered linear
exchange rate exposures which failed to provide a strong evidence of exposure.
The main purpose of this research was to argue if the foreign exchange risk is an asset
pricing factor by investigating the effect that a foreign exchange factor portfolio has in
explaining the cross sectional variation of stock returns. The empirical results shows
that the foreign exchange risk has a significant explanatory power in the cross-section
of the Norwegian stock returns.
In the first step of the methodology, was estimated the sensitivity of the stocks returns
to foreign exchange movements and the allocation of the stocks according to their
foreign exchange risk exposure. The findings reveal that stocks with high absolute
foreign exchange exposure have the lower stock returns. This argue that firms with
high exchange rate exposure have been expertise in dealing with all type of risks.
Norwegian firms have developed sufficient hedging strategies. Moreover besides that,
it was shown that the small size firms and those with high Book-to-Market ratio are
those with the higher foreign exchange sensitivity.
The last part of the methodology involves the linear regression of the foreign exchange
risk portfolio to investigate if it captures the movements of the cross sectional stock
39. 33
returns. The procedure followed, examines the explanatory power on the independent
variables and on the asset pricing models. The results shown that the market risk
premium, the size and the value factors of the model remained almost stable between
the regressed linear models as in the sign, the size and the significance level, while the
momentum factor failed to follow a specified pattern. Nevertheless, the explanatory
power of the models was significantly increased whenever the foreign exchange factor
was including in the regressions.
Financial and portfolio managers worldwide operate on the belief that the foreign
exchange risk in non-diversifiable and so they contribute huge amounts in several
hedging instruments in order to protect their investment positions. The findings of this
research, suggest that the foreign exchange risk factor should be taken into account
from financial analysts so as to evaluate correctly the portfolios which have invested in
Norwegian securities. From the investors point of view, should be taken into account
that the small size Norwegian companies is a riskier investment as they appear not to
hedge their foreign exchange positions. Since the foreign exchange risk is an important
asset pricing factor, investors who concentrated in Norwegian market should also take
it into consideration when estimating the required rate of return of a company.
40. Bibliography
Adam, T. (2009). Capital expenditures, financial constraints, and the use of options.
Journal of Financial Economics, 92(2), 238-251.
Adler, M., & Dumas, B. (1984). Exposure to currency risk: Definition and
measurement. Financial Management, 13(2), 41-50.
Adler, M., Dumas, B., 1983. International portfolio choice and corporate finance: a
synthesis. Journal of Finance 38, 925-984.
Adler, M., Dumas, B., 1984. Exposure to currency risk: definition and measurement.
Financial Management 13, 41-50.
Allayannis, G., & Ofek, E. (2001). Exchange rate exposure, hedging and the use of
foreign currency derivatives. Journal of International Money and Finance, 20, 273-
296.
Al-Shboul, M., & Anwar, S. (2014a). Pricing of the currency risk in the Canadian
equity market. Research in International Business and Finance, 30(1), 173-194.
Al-Shboul, M., & Anwar, S. (2014b). Time-varying exchange rate exposure and
exchange rate risk pricing in the Canadian equity market. Economic Modelling, 37,
451-463.
Amihud, Y., 1994. Exchange rates and the valuation of equity shares. In: Amihud,
Y., Levich, R.M. (Eds.), Exchange Rates and Corporate Performance. Irwin, New
York, NY, pp. 49-59.
Anatolyev, S., 2008. A 10-year retrospective on the determinants of Russian stock
returns. Research in International Business and Finance 22, 56-67.
Antell, J., Vaihekoski, M., 2007. International asset pricing models and currency
risk: evidence from Finland 1970–2004. Journalof Banking and Finance 31 (9),
2571-2590.
Bartov, E., Bodnar, G.M., 1994. Firm valuation, earnings expectations, and the
exchange rate exposure effect. Journal of Finance 44, 1755-1785.
Bekaert, G., Harvey, C., 1995. Time-varying world market integration. Journal of
Finance 50 (2), 403-444.
41. Black, F., 1974. International capital market equilibrium with investment barriers.
Journal of Financial Economics 1, 337-352.
Breeden, D.T., Gibbons, M.R., Litzenberger, R.H., 1989. Empirical tests of the
consumption oriented CAPM. Journal of Finance 44, 231-262.
Brooks, R., Di Iorio, A., Faff, R. W., Fry, T., & Joymungul, Y. (2010). Asymmetric and
time variation in exchange rate exposure: An investigation of Australian stock
returns. International Journal of Commerce and Management, 20(4), 276-295.
Carrieri, F., Majerbi, B., 2006. The pricing of exchange risk in emerging stock
markets. Journal of International Business Studies 37, 372-391.
Chen, N., Roll, R., Ross, S.A., 1986. Economic forces and the stock market. Journal
of Business 59, 383-403.
Choi, J. J., & Prasad, A.M. (1995). Exchange risk sensitivity and its determinants: A
firm and industry analysis. Financial Management, 24(3), 77-89.
Choi, J.J., Rajan, M., 1997. A joint test of market segmentation and exchange risk
factor in international capital markets. Journal of International Business Studies 28,
29-49.
De Santis, G, Gerard, B., 1998. How big is the premium for currency risk? Journal of
Financial Economics 49, 375-412.
De Santis, G., Gérard, B., 1998. How big is the premium for currency risk? Journal of
Financial Economics 49 (3), 375-412.
Di Iorio, A., & Faff, R. (2001). The effect of intervolving on the foreign exchange
exposure of Australian stock returns. Multinational Finance Journal, 5(1), 1-33.
Doidge, C., Griffin, J., &Williamson, R. (2006). Measuring the economic importance
of exchange rate exposure. Journal of Empirical Finance, 13, 550-576.
Doidge, C., Griffin, J., Williamson, R., 2006. Measuring the economic importance of
exchange rate exposure. Journal of Empirical Finance 13, 550-576.
Doukas, J.A., Hall, P.H., Lang, L.H.P., 1999. The pricing of currency risk in Japan.
Journal of Banking and Finance 23, 1-20.
Doukas, J.A., Hall, P.H., Lang, L.H.P., 2003. Exchange rate exposure at the firm and
industry level. Financial Markets, Institutions and Instruments 12, 291-347.
Du, D., 2009. Does exchange rate risk matter for asset pricing, Working Papers
Series 10-01, Northern Arizona University, pp. 1-20.
42. Dumas, B., Solnik, B., 1995. The world price of foreign exchange risk. Journal of
Finance 50, 445-479.
Giddy, I. H., & Dufey, G. (1995). Uses and abuses of currency options. Journal of
Applied Corporate Finance, 8(3), 49-57.
Griffin, J.M., Stulz, R.M., 2001. International competition and exchange rate shocks:
a cross-country industry analysis of stock returns. Review of Financial Studies 14,
215-241.
He, J., Ng, L.K., 1998. The foreign exchange exposure of Japanese multinational
corporations. Journal of Finance 53, 733-753.
Iorio, A.D., Faff, R., 2002. The pricing of foreign exchange risk in the Australian
equities market. Pacific-Basin Finance Journal 10, 77-95.
Jorion, P., 1991. The pricing of exchange rate risk in the stock market. Journal of
Financial and Quantitative Analysis 26, 363-376.
Jorion, P., Schwartz, E., 1986. Integration vs. segmentation in the Canadian stock
market. Journal of Finance 41 (3), 603-614.
Kolari, J.W., Moorman, T.C., Sorescu, S.M., 2008. Foreign exchange risk and the
cross-section of stock returns. Journal of International Money and Finance 27,
1074-1097.
Lamont, O.A, 2001. Economic tracking portfolios. Journal of Econometrics 105, 161-
184.
Levi, M.D. (1994). Exchange rates and the valuation of firms. In Y. Amihud, & R. M.
Levich (Eds.), Exchange rates and corporate performance, Vol. IL. (pp. 37-48)
Homewood: Irwin.
Mittoo, U.R., 1992. Additional evidence on integration in the Canadian stock
market. Journal of Finance XLVII (5), 2035-2054.
Mohammad Al-Shboul, Sajid Anwar, 2013. Foreign exchange rate exposure:
Evidence from Canada. Journal of Elsevier.
Mohammad Al-Shboul, Sajid Anwar, 2013. Pricing of the currency risk in the
Canadian equity market. Journal of Elsevier.
Muller, A., & Verschoor, W. F. C. (2006). European foreign exchange risk exposure.
European Financial Management, 12(2), 195-220.
Muller, A., Verschoor, W.F.C., 2006. European foreign exchange risk exposure.
European Financial Management 12, 95-220.
43. Muller, A., Verschoor, W.F.C., 2007. Asian foreign exchange risk exposure. Journal
of the Japanese and International Economies 21, 16-37.
Nicholas Apergis, Panagiotis Artikis, John Sorros, 2011. Asset pricing and foreign
exchange risk. Journal of Elsevier.
Odongo Kodongo, Kalu Ojah, 2011. Foreign exchange risk pricing and equity market
segmentation in Africa. Journal of Elsevier.
Priestley, R., & Ødegaard, B.A. (2007). Linear and nonlinear exchange rate
exposure. Journal of International Money and Finance, 26(6), 1016-1037.
Saleem, K., Vaihekoski, M., 2010. Time-varying global and local sources of market
and currency risks in Russian stock market. International Review of Economics and
Finance 19 (4), 686-697.
Sercu, P., 1980. A generalization of the international asset pricing model. Revue de
l Association Francaise de Finance 1, 91-135.
Smimou, K., 2011. Transition to the Euro and its impact on country portfolio
diversification. Research in International Business and Finance 25, 88-103.
Solnik, B., 1974. An equilibrium model of the international capital market. Journal
of Economic Theory 8, 500-524.
Tai, C., 2007. Market integration and currency risk in Asian emerging markets.
Research in International Business and Finance 21, 98-117.
Tai, C.-S., 1999. Time-varying risk premia in foreign exchange and equity markets:
evidence from Asia-Pacific countries. Journal of Multinational Financial
Management 9, 291-316.
Vassalou, M., 2000. Exchange rate and foreign inflation risk premiums in global
equity returns. Journal of International Money and Finance 19, 433-475.
Vassalou, M., 2003. News related to future GDP growth as a risk factor in equity
returns. Journal of Financial Economics 68, 47-73.
Williamson, R. (2001). Exchange rate exposure and competition: evidence from the
automotive industry. Journal of Financial Economics, 59, 441-475.
Zhao, H., 2010. Dynamic relationship between exchange rate and stock price:
evidence from China. Research in International Business and Finance 24, 103-11.