Download to read offline

![The scientific heritage No 60 (2021) 3
BIOLOGICAL SCIENCES
HYDROGEN PRODUCTION FROM CELLULOSIC MATERIALS BY NATURAL MICROBIAL
ASSOCIATION FROM SOIL ENRICHED BY CLOSTRIDIUM AND BACILLUS MICROORGANISMS
Drapoi D.
Postgraduate student, Department of Ecobiotechnology and Bioenergetics, Biotechnology and Biotechnics
Faculty, National Technical University of Ukraine «Igor Sikorsky Kyiv Polytechnic Institute»
Golub N.
PhD, professor of Ecobiotechnology and Bioenergetics Department, Biotechnology and Biotechnics
Faculty, National Technical University of Ukraine «Igor Sikorsky Kyiv Polytechnic Institute»
DOI: 10.24412/9215-0365-2021-60-1-3-8
Abstract
Study of hydrogen production from renewable raw materials using biological methods is relevant because it
does not have adverse effects on the environment. The aim of this work is to study hydrogen yield by natural
microbial associations enriched by microorganisms of Clostridium and Bacillus genera. Natural microbial associ-
ations from soil and from a lake have been isolated; their ability to ferment cellulose with molecular hydrogen
evolution has been investigated. Natural microbial association obtained from soil proved to be the most effective
as it is dominated by 2 microorganism genera – Clostridium and Bacillus. It has been shown that additional en-
richment of natural microbial associations by the microorganisms of Clostridium and Bacillus genera with a ratio
1:2.5 increases hydrogen yield by 48% and hydrogen content reaches 87.5% in the resulting biogas. This approach
enables a reduction in substrate processing time.
Keywords: natural microbial association, hydrogen, cellulose, agricultural waste, Clostridium, Bacillus.
Introduction. Progressing shortage of fossil fuels
and environmental pollution by their production waste
requires searching for renewable environmentally
friendly energy sources. More than 80% of energy is
currently obtained from fossil fuels, which leads to
gradual climate change, global warming, rapid deple-
tion of natural resources [7]. Therefore, almost all
countries are looking for alternative, renewable energy
sources, such as biofuels, which can be obtained from
renewable raw materials.
Existing methods of hydrogen production are
power-consuming processes; all technologies, except
for water electrolysis and biomass gasification, require
fossil fuels as the source of hydrogen [13].
Promising is the use of renewable raw materials,
such as agricultural waste, as a substrate for hydrogen
production. This way, the yield of hydrogen from
crushed stalks and cobs of corn under mesophilic
conditions is 16.1 –20.4 mmol H2/kg [3].
According to the sources, high hydrogen yield
during cellulose fibers decomposition was achieved by
the pure culture of microorganisms Clostridium
thermocellum under thermophilic conditions and was
11.2 mmol H2 per kg of substrate [4]. However, most
of the current research is focused on the use of
microbial associations and co-cultivation systems,
which increases yield and rate of hydrogen production
compared to the pure culture. According to the sources,
hydrogen yield in case of an isolated strain use was 0.96
– 1.07 mmol H2 per g of cellulose [6] and in case of a
microbial association use – 1.6 – 2.18 mmol H2 per g of
cellulose [2]. Other studies have shown that fermenting
cellulose substrates by an association dominated by
microorganisms Thermoanaerobacterium
thermosaccharolyticum and Clostridium under
thermophilic conditions gives hydrogen yield of 7.22
mmol H2/g of carboxymethylcellulose at a
concentration of 0.25 g/dm3
[9]. Use of a microbial
association of the genera Enterococcus and Clostridium
for the fermentation of wheat straw in a two-stage
process allowed to obtain 79.5 cm3
of H2 per g of
substrate [12]. Fermentation of cellulose-containing
raw materials by the natural microbial association
under mesophilic conditions gives hydrogen yield of
61.3 cm3
H2/g of substrate with cellulase activity of
0.19 mmol/min·ml [11].
Use of associations of different species and genera
of microorganisms has a number of advantages:
• wide range of different substrates use;
• log phase of growth delay reduction;
• resistance to external fluctuations of waste
composition and system stability;
• higher hydrogen yield [8].
This paper identifies promising microbial
associations for hydrogen production and investigates
the effectiveness of the process in case of enriching the
natural microbial association by hydrogen-producing
microorganisms of Clostridium and Bacillus genera.
The objective was to study hydrogen yield with
the natural microbial association enriched by the
microorganism of Clostridium and Bacillus genera.
The research was split into the following tasks:
• Identify the most effective natural microbial
association of cellulose destructors and molecular
hydrogen producers;
• Identify the dominant microorganism genera
in the association;
• Study the fermentation process and the
resulting gas mixture composition in case of the natural
soil microbial association enriched by the dominant
microorganisms isolated from it.
Material and methods. Soil samples and silt from
a lake were used to obtain the microbial association of
cellulose destructors and molecular hydrogen](https://image.slidesharecdn.com/4axkfdo5rhmoyfvz6nh1-signature-e616dfddf0f780ceeda51d3bfa80bfe9124d0eec8e413093eaaa458e2a67433f-poli-210404190825/85/The-scientific-heritage-VOL-1-No-60-2021-3-320.jpg)
![4 The scientific heritage No 60 (2021)
producers. Weighing of soil samples was performed
using technical scales T-200.
To prepare the inoculum, 5 g of soil was added to
250 cm3
of distilled water. To inactivate the methano-
gens, the soil suspension was kept in a water bath at
90°C for one hour. The ratio of inoculum to medium
was 1:5.
Cultivation was performed in 300 cm3
vials filled
by 70% with inoculum, water and a specific substrate,
which were sealed with a rubber stopper and a screw
clamp. The process was performed under anaerobic
mesophilic conditions at 30-35°C, in a dry air
thermostat TC-80M (MEDLABORTEKHNIKA,
Odesa, Ukraine), in a batch mode. The degree of
anaerobicity of the medium was monitored by the color
change of resazurin (CP) solution (0.15 g/dm3
), which
was added in an amount of 1 cm3
/dm3
.
Filter paper (white tape) was used for control as a
source of cellulose. To prevent nutrient deficiency in
the control experiment, the following was added into a
vial containing 200 cm3
of tap water: 0.2 g of KH2PO4;
0.2 g NH4NO3; 0.1 g MgSO4·7H2O; 0.01 g CaCO3 [5].
For substrate a mixture of corn and sunflower
waste was used in a ratio of 1:1. It was pre-grinded to
sizes of 3-5 mm and pre-treated with 20% alkali
solution: the grinded substrate was placed into a beaker,
poured with 100 cm3
of 20% NaOH solution and left
for 3 hours at room temperature with periodic stirring.
The solution was drained and the solid residue was
washed with distilled water until achieving neutral pH.
The composition of the gas synthesized in the
process of microbial destruction was determined by the
standard methods of gas chromatography [1] using a
gas chromatograph LHM-5MD (EXPERIMENTAL
FACTORY CHROMATOGRAPH, Moscow, Russia).
The temperature of the columns, the evaporator and the
detector - 50°C. Carrier gas - argon, gas flow rate - 30
cm3
/min. The volume percentage of H2, CO2, N2 and O2
in the gas mixture was calculated based on the
calibration data. Coefficients for calculation: K(H2) =
0.00142, K(N2) = 0.0065, K(O2) = 0.005, K(CO2) =
0.029, K(CH4) = 0.0026.
For selective isolation of the association, that
effectively decomposes cellulose with the release of
molecular hydrogen, chemically defined liquid
Omelianski growth medium was used with the follow-
ing composition, g: (NH4)3PO4 - 1,0; K2HPO4 - 1.0;
MgSO4 - 0.5; NaCl - 0.1; CaCO3 - 2.0; FeSO4 - 2 drops
of 1% solution; peptone - 0.6; distilled water - 1000
cm3
.
To isolate axenic colonies of anaerobic
microorganisms, a standard streaking process was used
[10] in petri dishes in an anaerostat. Medium
composition, g/cm3
: K2HPO4 - 30; KH2PO4 - 2; MgSO4
-1; NH4Cl - 1; CaCO3 - 0.1; FeCl2 - 0.4; agar - 15; mi-
crocrystalline cellulose powder - 10. The medium was
sterilized by autoclaving for 20 minutes at 50.65 kPa,
121°C. After sterilization, 2 drops of indicator (resaz-
urin (CP)) were added to visually control the environ-
ment’s redox potential. 15 cm3
of agar medium was
added to petri dishes and spreaded by a microbiological
loop using streaking technique. After loading the dishes
into a container, 30-50 g of calcined (1h at 100°C)
granulated (d = 2–4 mm) silica gel (CP) to avoid
condensation. The air was replaced with argon by a 3-
fold cycle of "evacuation-filling with argon". One cycle
consists of evacuation at a pressure of 202.6 kPa for 5
minutes and then filling the anaerostat with argon to
balance the atmospheric pressure. Inert gas argon
(DSTU 10157-79, first grade) containing O2 at a
concentration not exceeding 0.002% was used in the
work.
Cell morphology was studied by light microscopy
using an XSP-139TP microscope (ULAB SCIENTIFIC
INSTRUMENTS CO. LTD, Jiangsu, China) with a
magnification of 1000x. Gram staining was performed
according to the common method [5].
To increase the yield of hydrogen, the natural
association from soil was enriched with
microorganisms of Bacillus and Clostridium genera
isolated from the same association. To achieve that,
microorganisms of Clostridium genus were re-inocu-
lated from the petri dishes in the anaerostat to a liquid
Omelianski growth medium, and microorganisms of
Bacillus genus were re-inoculated onto nutrient broth
and cultivated to increase biomass.
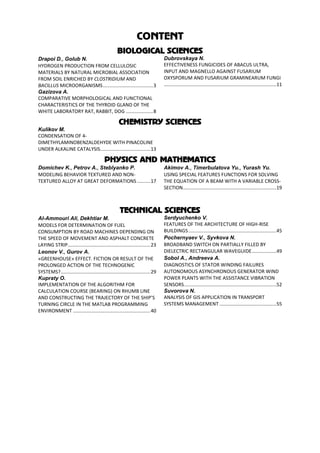
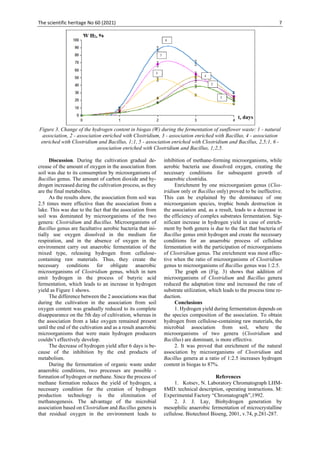
Results. During the cultivation of natural associa-
tions from soil and from a lake using filter paper as the
only source of carbon, the gas-phase composition
changed over time. The vials were sealed with air to
inhibit the development of methanogenic microorgan-
isms for which oxygen is toxic. Because of that, ini-
tially the nitrogen content was the same as in the air;
over time its percentage concentration in the gas-phase
decreased, due to the increase of other gases (H2 and
CO2). The amount of oxygen over time decreased to
complete absence in the association from soil. The
amount of carbon dioxide and hydrogen increased dur-
ing the cultivation process. The hydrogen yield after 6
days is 2.5 times higher when using the association
from soil than when using the association from a lake
(Table 1).](https://image.slidesharecdn.com/4axkfdo5rhmoyfvz6nh1-signature-e616dfddf0f780ceeda51d3bfa80bfe9124d0eec8e413093eaaa458e2a67433f-poli-210404190825/85/The-scientific-heritage-VOL-1-No-60-2021-4-320.jpg)
![8 The scientific heritage No 60 (2021)
3. Y. Liu, P. Yu, X. Song, Y. Qu. Hydrogen
production from cellulose by co-culture of Clostridium
thermocellum JN4 and Thermoanaerobacterium
thermosaccharolyticum GD17. Int J Hydrogen Energy,
2008, v. 33, p. 2927-2933.
4. A. Moreau, D. Montplaisir, R. Sparling, S.
Barnabé. Hydrogen, ethanol and cellulase production
from pulp and paper primary sludge by fermentation
with Clostridium thermocellum. Biomass and
Bioenergy, 2015, v. 72, p. 256–262.
5. Netrusov, А. I., Egorova, М. А., Zakharchuk,
L. М. Practicum on microbiology: Textbook for
students. M: Akademiya, 2005.
6. T. A. D. Nguyen, J. P. Kima, M. S. Kim, Y.K.
Oh, S. J. Sim. Optimization of hydrogen production by
hyperthermophilic eubacteria, Thermotoga maritime
and Thermotoga neapolitana in batch fermentation. Int.
J. Hydrogen Energy, 2008, v. 33, p. 1483-1488.
7. M. Ni, D. C. Leung, M. H. Leung, K.
Sumathy. An overview of hydrogen production from
biomass Fuel Process Technol, 2006, v. 87(5), p. 461-
472.
8. V. L. Pachapur, S. J. Sarma, S. K. Bra, Y. Le
Bihan, G. Buelna, M. Verma. Biological hydrogen
production using co-culture versus mono-culture
system. Environmental Technology, 2015, v. 138, p.
2225–2232.
9. A. F. Saripan, A. Reungsang. Simultaneous
saccharification and fermentation of cellulose for bio-
hydrogen production by anaerobic mixed cultures in
elephant dung. Hydrogen Energy, 2014, v. 39 (17), p.
9028–9035.
10. Schlegel, H. G. General microbiology.
Moscow: Mir, 2006.
11. S. Xueqing, K. Dong-Hoon, S. Hang-Sik, J.
Kyung-Won. Effect of temperature on continuous
fermentative hydrogen production from Laminaria
japonica by anaerobic mixed cultures. Bioresource
Technology, 2013, v. 144, p. 225–231.
12. I. Valdez-Vazquez, M. Pérez-Rangel, A.
Tapia, G. Buitrón, C. Molina, G. Hernández, L.
Amaya-Delgado. Hydrogen and butanol production
from native wheat straw by synthetic microbial
consortia integrated by species of Enterococcus and
Clostridium. Fuel, 2015, v. 159, p. 214–222.
13. W. Zittel, R. Wurster. Hydrogen in the Energy
Sector, Int. J. Hydrogen Energy, 2006, v. 8, p. 322-337.
СРАВНИТЕЛЬНАЯ МОРФОФУНКЦИОНАЛЬНАЯ ХАРАКТЕРИСТИКА ЩИТОВИДНОЙ
ЖЕЛЕЗЫ БЕЛОЙ ЛАБОРАТОРНОЙ КРЫСЫ, КРОЛИКА И СОБАКИ
Газизова А.И.
Казахский агротехнический университет имени Сакена Сейфуллина, кафедра биологических наук,
доктор биологических наук, профессор
COMPARATIVE MORPHOLOGICAL AND FUNCTIONAL CHARACTERISTICS OF THE
THYROID GLAND OF THE WHITE LABORATORY RAT, RABBIT, DOG
Gazizova A.
Kazakh agrotechnical University named after S. Seifullin, department of biological sciences doctor of bio-
logical Sciences, Professor Ph.D.
DOI: 10.24412/9215-0365-2021-60-1-8-10
Аннотация
В статье рассматриваются сравнительная анатомия щитовидной железы белой лабораторной крысы,
кролика, собаки. Дана морфологическая характеристика щитовидной железы. Подробно даны результаты
исследования щитовидной железы на макро-микроскопическом уровне. Выявлены наиболее значимые
морфологические показатели щитовидной железы у исследуемых животных.
Abstract
The article deals with the comparative anatomy of the thyroid gland of the white laboratory rat, rabbit, dog.
Given the morphological characteristics of the thyroid gland. The results of the study of the thyroid gland at the
macro-microscopic level are given in detail. The most significant morphological parameters of the thyroid gland
in the studied animals were revealed.
Ключевые слова: морфология, анатомия, щитовидная железа, эндокринология, гормон, грудная
полость, крыса, кролик, собака, доли, эпителий, кровеносные сосуды.
Keywords: morphology, anatomy, thyroid, endocrinology, hormone, chest cavity, rat chest, rabbit, dog,
share, epithelium, blood vessels.
Совокупность эндокринных желез образует
эндокринную систему, в которой можно выделить
несколько составляющих частей. Эндокринные же-
лезы выделяют гормоны неспосредствен , но в
кровь, межклеточную жидкость, лимфу. Эндокрин-
ные железы подразделяются на группы. По морфо-
логической связи с центральный нервной системы,
делятся на центральные (гипоталамус, гипофиз,
эпифиз) и периферические –щитовидая, половые,
надпочечных и т.д. [1,2,3].
Щитовидная железа образуется из экто-
дермального эпителия непарного срединного выро-
ста вентральной стенки передней кишки. Эпители-
алные клетки формируют сложную систему тяжей.
Из мезенхимы развивается соединительная ткань,](https://image.slidesharecdn.com/4axkfdo5rhmoyfvz6nh1-signature-e616dfddf0f780ceeda51d3bfa80bfe9124d0eec8e413093eaaa458e2a67433f-poli-210404190825/85/The-scientific-heritage-VOL-1-No-60-2021-8-320.jpg)
![The scientific heritage No 60 (2021) 9
которая покрывает зачаток снаружи и врастает в
него. Щитовидная железа расположена в области
шей по обеим сторонам, трахей, позади щитовид-
ного хряща. На строение и функцию щитовидной
железы огромное влияние оказывают факторы
окружающей среды, в связи с чем патологию щито-
видной железы рассматривают как маркер экологи-
ческого неблагополучия.
Щитовидная железа имеет исключительно
обильное кровоснабжение по сравнению с другими
органами. Объемная скорость кровотока в щито-
видной железе составляет около 5 мл/г в минуту.
Эндокринные железы, и в частности щитовидная
железа играют большую роль в нейрогуморальной
регуляции, в процессах развития и роста, возраст-
ной изменчивости и адаптации организма к различ-
ным фактором внутренней и внешней среды. Щи-
товидная железа имеет вид бабочки, крылья кото-
рой представлены правой и левой долями,
соединительными перешейком. Сама масса железы
построена из соединительнотканного состава и же-
лезистой инкретирующей части. Остов одевает ор-
ган в виде оболочки от которой внутрь отходит ряд
перегородок, проходящих между группами желези-
стых образований формируя дольки железы. Выяв-
ление закономерностей и видовых особенностей
организации желез эндокринного аппарата и струк-
турных эквивалентов их функционального состоя-
ния представляет одну из фундаментальных про-
блем не только морфологии, но и эндокринологии.
Щитовидная железа иннервируется постганглио-
нарными волокнами симпатической нервной си-
стемы. Щитовидные нервы образуют сплетения во-
круг сосудов, подходящих к железе. Считают, что
эти нервы выполняют вазомоторную функцию. В
иннерваций щитовидной железы участвует также
блуждающий нерв, несущий парасимпатические
волокна к железе [4,5].
Щитовидная железа секретирует тиреоидные
гормоны. Тиреоидные гормоны необходимы для
нормального роста и развития0 регулируют частоту
сердечных сокращений и сократимость миокарда,
влияют на моторику кишечника и почечную экс-
крецию воды, а так же модулируют энергозатраты,
теплопродукцию и вес тела. В щитовидной железе,
присутствуют и парафолликулярные С-клетки, ко-
торые вырабатывают кальцитонин. Вырабатывае-
мой железой гормон тироксин ускоряет процессы
окисления в организме, тирокальцитонин регули-
рует содержание кальция.
Гистологически щитовидная железа состоит из
фолликулов и соединительной стромы, сформиро-
ванной из коллагеновых и эластических волокон с
проходящими в ней кровеносными, лимфатиче-
скими сосудами и нервами. Структурной единицей
щитовидной железы является фолликул , которой
представляет собой замкнутое образование округ-
лой формы. В полости фолликула находится веще-
ство - коллоид, продуциремый эпителиальными
или А-клетками. Помимо А-клеток как по эмбриге-
незу, так и по выполняемый им функции. Этими
клетками вырабатывается кальцитонин которой яв-
ляется основным гормональным факторам в регу-
ляции обмна кальция и фосфора в организме.
Материалы и методы исследования щитовид-
ный железы у ряда животных в сравнительным ас-
пекте. Материалом для исследования щитовидные
железы полученные от клинический здоровых жи-
вотных в количестве 15 голов, из них 4 собак, 5 кро-
ликов, 6-белых лабораторных крыс половозрелого
возраста. Материал для исследования был взят в
клинике КазАТУ им. С. Сейфуллина и ветеринар-
ных клиниках г. Нур-Султана. Использовались бес-
породные белые крысы обоих полов. На период ис-
следования вес крыс составлял от 250 до 320 г. Воз-
раст исследуемых животных устанавливали по
записи журнала в связи с контролируемым вы-ра-
щиванием данных видов животных. Проводилась
самотометрия животных, включающая определе-
ние длины и масса тела. Использовали метод пре-
парирования. После проведения методики препари-
рования орган взвешивался, линейно измерялся,
фотографировали и схематично зарисовывался.
Следующим шагом исследования- щитовидная же-
леза промывалась и для фиксации помещали в
начале в 2 % раствор формалина на 3-5 суток. Затем
для окончательной фиксации и длительного хране-
ния переносили материал в 10% раствор форма-
лина. Материал для гистологического исследова-
ния брали после фиксации.
Результаты исследований. Нами при проведе-
нии научно-исследовательской работы были обна-
ружены заметные внешние сходства щитовидной
железы. Особенно у собаки и кролика сходства в
долях размерах которое наблюдалась при изучении
щитовидный железы в сравнительом аспекте.
Щитовидная железа у собак незаменима в био-
химических и обменных процессах в организме.
Нарушение её функции обуславливает различные
болезни как в щитовидной железы, так и в области
глаз. Чаще всего собаки болеют гипотиреозом. Эта
недостаточная активность щитовидной железы, что
приводит к дефициту в организме ее гормона и раз-
рушению железы. У собак железа имеет вид минда-
лины.
Доли соединены тонким перешейком, но по-
следний нередко отсутствует. В исключительных
случаях он бывает вытянут в длинную дугу до
входа в грудную полость. У кроликов щитовидная
железа состоит из двух долей, расположена боко-
вых и нижней части трахей. Масса 0,1 г, цвет ко-
ричнево-красный. Железа находится в грудной по-
лости на уровне 1-3-го реберного хряща. У моло-
дых кроликов она хорошо выражена, имеет длину
2,5 см., ширину 2 см , толщину 4 мм. Ее гормон спо-
собствует отложению извести, росту костей и поло-
вых органов. У крыс щитовидная железа начинает
закладываться на 14 сутки, также из выпячивания
вентральной стенки глотки. В процессе развития
становиться эндокриной. Масса на момент рожде-
ния составляет 12-13 мг. Щитовидная железа крыс
имеет бледно оранжевый цвет, состоит из двух от-
носительно симметричных долей. Доли щитовид-
ной железы уплощенной, удлиненной формы. При-
чем эти доли железы обособлены друг от друга и не
содержат першейка. Доли железы покрыты фибриз-
ной капсулой , которая рыхло соединена с адвента-
циальной оболочкой гортани и трахей ,находя-
щихся позади органа. Для крыс так же как и для
всех млекопитающих характерны половые отличия
органа, у самок железы больше по размеру, чем у
самцов.
При изучении гистологических препаратов мы
выяснили, что щитовидная железа имеет дольчатое](https://image.slidesharecdn.com/4axkfdo5rhmoyfvz6nh1-signature-e616dfddf0f780ceeda51d3bfa80bfe9124d0eec8e413093eaaa458e2a67433f-poli-210404190825/85/The-scientific-heritage-VOL-1-No-60-2021-9-320.jpg)
![The scientific heritage No 60 (2021) 11
ЭФФЕКТИВНОСТЬ ФУНГИЦИДОВ АБАКУС УЛЬТРА, ИНПУТ И МАГНЕЛЛО В
ОТНОШЕНИИ ГРИБОВ FUSARIUM OXYSPORUM И FUSARIUM GRAMINEARUM
Дубровская Н.Н.
Среднерусский филиал Федерального государственного бюджетного научного учреждения «Феде-
ральный научный центр имени И.В. Мичурина», научный сотрудник
Россия, Тамбовская область, п. Новая жизнь
EFFECTIVENESS FUNGICIDES OF ABACUS ULTRA, INPUT AND MAGNELLO AGAINST
FUSARIUM OXYSPORUM AND FUSARIUM GRAMINEARUM FUNGI
Dubrovskaya N.
Middle Russian branch Federal State Scientific Institution
“I.V. Michurin Federal Scientific Center”,
researcher
Russia, Tambov region, v. Novaya zhizn
DOI: 10.24412/9215-0365-2021-60-1-11-12
Аннотация
Изучено влияние фунгицидов Абакус Ультра, Инпут и Магнелло на развитие видов грибов Fusarium
graminearum и F. oxysporum. Эксперименты проводились с применением метода агаровых пластин. Пол-
ностью (на 100 %) ингибировал развитие колоний изучаемых видов грибов фунгицид Инпут. Препараты
Магнелло и Абакус Ультра оказали существенное влияние на вид гриба Fusarium graminearum. Их биоло-
гическая эффективность составила 94 – 100 %. В отношении вида гриба Fusarium oxysporum этот показа-
тель был значительно ниже – 74,4 – 79,9 %. Показана целесообразность применения метода агаровых пла-
стин для оценки эффективности средств защиты растений.
Abstract
The influence of the fungicides Abacus Ultra, Input and Magnello on the development of the fungal species
Fusarium graminearum and F. oxysporum was studied. The experiments were carried out using the agar plate
method. The fungicide Input completely (by 100 %) inhibited the development of colonies of the studied fungal
species. Preparations of Magnello and Abacus Ultra had a significant impact on the type of fungus Fusarium
graminearum. Their biological effectiveness was 94 – 100 %. For the fungus Fusarium oxysporum, this indicator
was significantly lower – 74,4 – 79,9 %. The expediency of using the agar plate method for evaluating the effec-
tiveness of plant protection products is shown.
Ключевые слова: фунгициды, грибы Fusarium graminearum и F. oxysporum, метод агаровых пластин,
биологическая эффективность.
Keywords: fungicides, fungi Fusarium graminearum and F. oxysporum, agar plate method, biological effi-
cacy.
Фузариоз колоса – это инфекционное заболе-
вание, при поражении которым зерно пшеницы ста-
новится непригодным для пищевых и фуражных
целей. Главная опасность данного заболевания со-
стоит в том, что грибы рода Fusarium при своей
жизнедеятельности продуцируют различные мико-
токсины, чрезвычайно опасные для человека и
сельскохозяйственных животных. Партии зерна,
содержащие эти вещества выше предельно допу-
стимых концентраций, подлежат выбраковке и уни-
чтожению. Помимо этого, при поражении колоса
фузариевыми грибами, семена в нём образуются
неполновесные, щуплые, что негативно сказыва-
ется на продуктивности посевов пшеницы [3,4].
Ввиду широкой распространённости грибов рода
Fusarium в природе, они вызывают различные забо-
левания и у других культурных растений. В Цен-
трально-Чернозёмном регионе (ЦЧР) с раститель-
ного материала и зерна пшеницы было выделено в
чистую культуру и идентифицировано 19 видов фу-
зариев [1,2]. Многие из них, в том числе виды
Fusarium graminearum и F. oxysporum встречались
достаточно часто. Следует отметить, что в умерен-
ном климате средней полосы России и в частности
– Центральном Черноземье, фузариоз колоса и
зерна развивается преимущественно в скрытой
форме [6]. Визуальные признаки заболевания про-
являются крайне редко. Его возможно обнаружить
только при проведении микологического анализа.
Полностью устойчивых к фузариозу колоса сортов
пшеницы пока не создано. По этой причине для за-
щиты посевов культуры от данного заболевания
применяются различные химические препараты.
Однако, не все фунгициды обладают высокой эф-
фективностью против грибов рода Fusarium. Мно-
гие виды проявляют резистентность к химическим
препаратам. В связи с этим, существует необходи-
мость в испытании фунгицидов против отдельных
видов фузариев, с целью выявления наиболее дей-
ственных средств. Подобные испытания возможно
проводить как в полевых, так и в лабораторных
условиях. В последнем случае на скрининг препа-
ратов затрачивается значительно меньше времени и
финансовых расходов. Но окончательные испыта-
ния должны проводиться в полевых условиях, на](https://image.slidesharecdn.com/4axkfdo5rhmoyfvz6nh1-signature-e616dfddf0f780ceeda51d3bfa80bfe9124d0eec8e413093eaaa458e2a67433f-poli-210404190825/85/The-scientific-heritage-VOL-1-No-60-2021-11-320.jpg)
![12 The scientific heritage No 60 (2021)
растениях пшеницы. Лабораторные эксперименты
носят лишь предварительный, оценочный характер
действия фунгицидов на возбудителей фузариоза.
В то же время, они позволяют выявить препараты,
обладающие наибольшей эффективностью в отно-
шении того или иного вида патогена. Цель наших
исследований состояла в оценке биологической эф-
фективности фунгицидов против видов грибов
Fusarium graminearum и F. oxysporum, вызывающих
фузариоз колоса пшеницы.
В качестве материала исследований
использовалась чистые культуры вышеназванных
видов грибов. В лабораторных экспериментах
применялся метод агаровых пластин [5]. Данный
метод был модифицирован применительно к
изучению эффективности фунгицидов в отношении
грибов рода Fusarium. Он заключается в
следующем: на поверхность агаровой пластины в
чашке Петри наносится водная суспензия конидий
изучаемого вида гриба (0,5 мл) и раствор
фунгицида (0,5 мл). Количества препарата
пересчитывается на площадь агаровой пластины,
исходя из его нормы расхода. После инкубации в
термостате при температуре 24,5-25,0°С в течение
3-7 суток (в зависимости от вида) проводится
подсчет колоний гриба. В контрольном варианте
вместо раствора фунгицида на поверхность
агаровой пластины наносится стерильная вода.
Биологическая эффективность испытываемых
средств рассчитывалась по общепринятой
формуле. По величине этого показателя оценивали
влияние фунгицида на изучаемый вид гриба. В
проводимых экспериментах использовалась
искусственная питательная среда Чапека. В опытах
испытывались препараты Абакус Ультра, Инпут и
Магнелло.
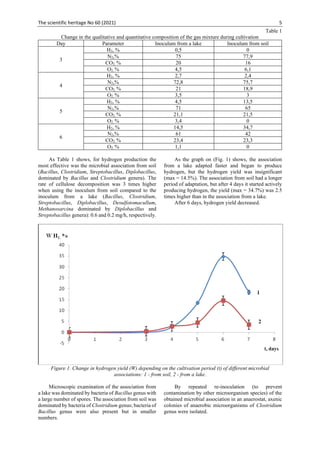
Проведенные исследования показали, что не
все препараты обладают одинаковой эффективно-
стью в отношении изучаемых видов грибов (таб-
лица 1). Наиболее действенным (биологическая эф-
фективность 100 %) был фунгицид Инпут. Он пол-
ностью ингибировал развитие колоний грибов
Fusarium oxysporum и F. graminearum. Препарат
Магнелло оказался наиболее эффективным (100 %)
против гриба Fusarium graminearum. В отношении
другого вида – гриба Fusarium oxysporum, данный
показатель был существенно ниже и составил 74,4
%. Последнее свидетельствует о резистентности
данного вида гриба к препарату. Фунгицид Абакус
Ультра проявлял относительно высокую (94,0 %)
эффективность против гриба Fusarium graminearum.
В отношении вида Fusarium oxysporum данный по-
казатель находился на среднем уровне и составил
79,9 %. Здесь также заметно проявление резистент-
ности этого вида гриба к препарату Абакус Ультра.
Таблица 1
Эффективность фунгицидов в отношении видов грибов Fusarium oxysporum и F. graminearum
Фунгицид,
норма расхода
Вид гриба
Fusarium oxysporum Fusarium graminearum
Количество
колоний, шт.
Биологическая
эффективность, %
Количество
колоний, шт.
Биологическая
эффективность, %
Контроль 199 - 168 -
Абакус Ультра СЭ, 1,5 л/га 40 79,9 10 94,0
Инпут КЭ, 1 л/га 0 100,0 0 100,0
Магнелло КЭ, 1 л/га 51 74,4 0 100,0
Таким образом, применение метода агаровых
пластин позволило провести оценку биологической
эффективности фунгицидов в отношении видов
грибов, вызывающих фузариоз колоса пшеницы.
Выявлен препарат (Инпут), полностью ингибирую-
щий развитие колоний грибов Fusarium oxysporum
и F. graminearum. Полученные результаты могут
быть использованы при испытании фунгицидов в
полевых условиях и дальнейшего применения в
производстве.
Список литературы
1. Бучнева Г.Н. Грибы рода Fusarium на пше-
нице в Центрально-Черназёмном регионе России //
Вестник защиты растений, 2004. № 3. С. 46-50.
2. Кобыльская Г.В. Видовой состав и биологи-
ческие особенности грибов рода Fusarium, парази-
тирующих на пшенице в ЦЧЗ России / Г.В. Кобыль-
ская, Г.И. Кобыльский // Актуальные проблемы им-
мунитета и защиты сельскохозяйственных культур
от болезней и вредителей: Тезисы докладов между-
народной научно-практической конференции (11-
14 сентября 2007 г.). – Одесса, 2007. С. 44.
3. Пересыпкин В.Ф. Сельскохозяйственная фи-
топатология: учебник. – Москва: Агропромиздат,
1989. 480 с.
4. Пидопличко Н.М. Грибы – паразиты куль-
турных растений. Определитель. Грибы несовер-
шенные. – Киев: «Наукова думка», 1977. Том 2. 300
с.
5. Чекмарев В.В. Методика определения био-
логической эффективности фунгицидов в отноше-
нии грибов рода Fusarium и их резистентности к хи-
мическим препаратам / В.В. Чекмарев, Ю.В. Зеле-
нева, Г.Н. Бучнева, О.И. Корабельская, Н.Н.
Дубровская, В.А. Левин, В.Ф. Фирсов. – Тамбов:
Принт-Сервис, 2015. 61 с.
6. Шипилова Н.П. Видовой состав и биоэколо-
гические особенности возбудителей фузариоза се-
мян зерновых культур / Автореферат диссертации
на соискание учёной степени кандидата биол. наук.
– Санкт – Петербург, 1994. 22 с.](https://image.slidesharecdn.com/4axkfdo5rhmoyfvz6nh1-signature-e616dfddf0f780ceeda51d3bfa80bfe9124d0eec8e413093eaaa458e2a67433f-poli-210404190825/85/The-scientific-heritage-VOL-1-No-60-2021-12-320.jpg)
![The scientific heritage No 60 (2021) 13
CHEMISTRY SCIENCES
КОНДЕНСАЦИЯ 4-ДИМЕТИЛАМИНОБЕНЗАЛЬДЕГИДА С ПИНАКОЛИНОМ В
УСЛОВИЯХ ЩЕЛОЧНОГО КАТАЛИЗА
Куликов М.А.
ORCID: 0000-0001-8944-9522
Кандидат химических наук, доцент, заведующий кафедрой Химическая технология и экология Бе-
резниковского филиала ФГБОУ ВО «Пермский национальный исследовательский политехнический уни-
верситет»
CONDENSATION OF 4-DIMETHYLAMINOBENZALDEHYDE WITH PINACOLINE UNDER
ALKALINE CATALYSIS
Kulikov M.
ORCID: 0000-0001-8944-9522
Candidate of Chemical Sciences, Associate Professor, Head of the Department of Chemical Technology
and Ecology of the Berezniki Branch of Perm National Research Polytechnic University
DOI: 10.24412/9215-0365-2021-60-1-13-16
Аннотация
В статье приводятся результаты исследований, направленных на синтез и изучение физико-химиче-
ских свойств диметиламино-замещенного бензальпинаколина. Предложена методика синтеза и очистки
целевого продукта. Свойства соединения изучены с использованием дифференциального термического
анализа, ИК и УФ спектроскопии. По результатам квантовохимических расчетов показаны особенности
молекулярной геометрии.
Abstract
The article presents the results of studies aimed at the synthesis and study of the physicochemical properties
of dimethylamino-substituted benzalpinacoline. A method for the synthesis and purification of the target product
is proposed. The properties of the compound were studied using differential thermal analysis, IR and UV spec-
troscopy. Based on the results of quantum chemical calculations, the features of the molecular geometry are shown.
Ключевые слова: пинаколин, реакция Кляйзена-Шмидта, щелочной катализ, дифференциальный
термический анализ, ИК и УФ спектроскопия, молекулярная геометрия.
Keywords: pinacoline, Claisen-Schmidt reaction, alkaline catalysis, differential thermal analysis, IR and UV
spectroscopy, molecular geometry.
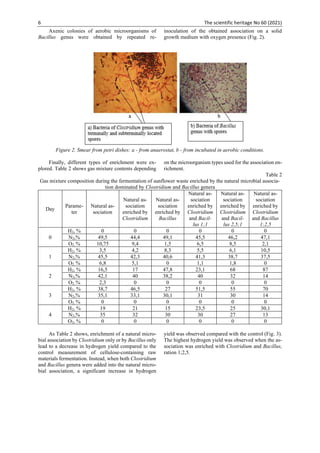
В настоящее время интересным направлением
развития органического синтеза является получе-
ние новых материалов с комплексом ценных при-
кладных свойств. Одним из таких соединений вы-
ступает бензальацетон. На его основе получают ге-
тероциклические [1] и карбоциклические [2]
соединения. Производные бензальацетона инте-
ресны в медицине [3], для получения ароматиче-
ских добавок [4,5] и других областях [6-9]. Влиять
на свойства бензальацетона можно введением заме-
стителей в бензольное кольцо, а также варьирова-
нием природы углеводородного радикала при кар-
бонильной группе.
Представленная работа продолжает исследова-
ния производных бензальацетона [10-13] и посвя-
щена синтезу и изучению свойств диметиламино-
замещенного бензальпинаколина – 1-[4-(димети-
ламино)фенил]-4,4-диметилпентен-1-она-3 (I). На
рис. 1 представлен химизм получения соединения
(I).
(CH3)2N
CHO
H3C C C
O
CH3
CH3
CH3
+
(CH3)2N
CH CH C
O
C
CH3
CH3
CH3
I
Рис. 1 – Химическая схема синтеза
В основу синтеза положена известная мето-
дика получения незамещенного бензальпинако-
лина [14] с некоторыми изменениями.
В 10 см3
этилового спирта растворяют 8 ммоль
4-диметиламинобензальдегида и 8 ммоль пинако-
лина. К раствору добавляют 4 см3
10 %-ного рас-
твора NaOH. Смесь перемешивают 8 часов на маг-
нитной мешалке при комнатной температуре и
оставляют на ночь. На следующий день реакцион-
ную массу выливают в смесь 10 см3
дистиллирован-](https://image.slidesharecdn.com/4axkfdo5rhmoyfvz6nh1-signature-e616dfddf0f780ceeda51d3bfa80bfe9124d0eec8e413093eaaa458e2a67433f-poli-210404190825/85/The-scientific-heritage-VOL-1-No-60-2021-13-320.jpg)
![14 The scientific heritage No 60 (2021)
ной воды и 10 г льда. Образовавшийся осадок от-
фильтровывают, промывают водой до нейтральной
реакции и высушивают в сушильном шкафу при 50
С. Очистку соединения проводят методом коло-
ночной хроматографии на оксиде алюминия. В ка-
честве растворителя и елюента используют ацетон.
Выход очищенного продукта составил 75 %.
Синтезированное соединение (I) представляет
собой порошок оранжевого цвета, растворимый в
полярных органических растворителях. Свойства
соединения изучены методами дифференциального
термического анализа, ИК, УФ спектроскопии, а
также по результатам квантовохимических расче-
тов. Для обработки полученных результатов ис-
пользовано оригинальное программное обеспече-
ние.
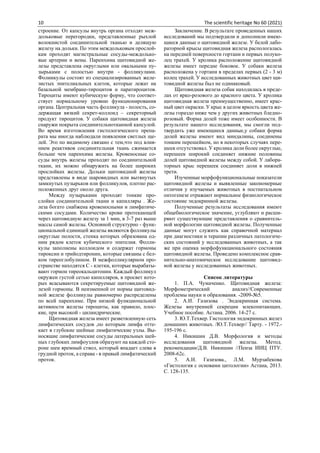
Дифференциальный термический анализ
(ДТА) проведен на установке Термоскан-2 в темпе-
ратурном диапазоне 25-600 С при скорости
нагрева пробы 20 град/мин. На термограмме (рис.
2) явно выделяются два эндотермических эффекта.
Первый эффект (76 С) отвечает за плавление об-
разца, второй (339 С) показывает температуру, при
которой происходит термодеструкция вещества.
Рис. 2 – Результаты ДТА
ИК спектральный анализ выполнен на Фурье
спектрометре ФСМ 1201 в таблетках KBr. Обра-
ботка спектра проведена с использованием инфор-
мационно-поисковой системы ZAIRTM
по ИК спек-
троскопии и литературных источников [15-17]. В
спектре присутствуют характеристические полосы,
отвечающие колебаниям атомов и связей в моле-
куле. Положение полос и их отнесение приведены
в таблице 1.
Таблица 1
Основные характеристические полосы в ИК спектре
Положение полос, см-1
Отнесение
3088 st СН бензольных колец
2908 st СН метильной группы
2819 st СН в диметиламино-группе
1661 st C=O, сопряженной с этиленовой связью
1601 st С=С
1482 st бензольного кольца
1373 метильной группы
1232 трет-бутильной группы
813 oop СН в 1,4-замещенном бензоле
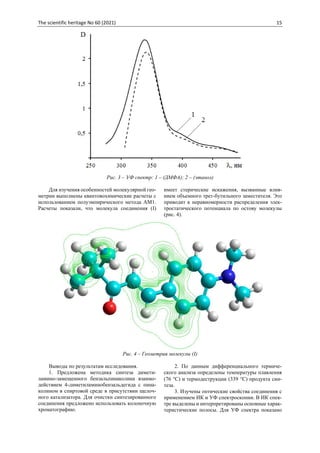
УФ спектры получены на спектрофотометре
EcoView УФ-3200 в интервале длин волн 275-500
нм, толщина светопоглощающего слоя 10 мм, кон-
центрация рабочих растворов 10–5
моль/дм3
, рас-
творители – этанол и диметилформамид (ДМФА).
УФ спектр соединения (I) в ДМФА имеет ос-
новное поглощение при 338 нм (lg 5,38), отвечаю-
щее →* электронным переходам в сопряженной
системе молекулы. При переходе от ДМФА к эти-
ловому спирту наблюдается слабое батохромное
смещение максимума поглощения до 342 нм (lg
5,33).](https://image.slidesharecdn.com/4axkfdo5rhmoyfvz6nh1-signature-e616dfddf0f780ceeda51d3bfa80bfe9124d0eec8e413093eaaa458e2a67433f-poli-210404190825/85/The-scientific-heritage-VOL-1-No-60-2021-14-320.jpg)
![16 The scientific heritage No 60 (2021)
влияние природы растворителя на положение спек-
трального максимума.
4. По результатам квантовохимических расче-
тов установлено, что остов молекулы имеет стери-
ческие искажения, вызванные трет-бутильным за-
местителем.
Список литературы
1. Миронович Л.М., Федяев В.С. Кинетика
циклоконденсации производных пиразоло[5,1-
С][1,2,4]триазина с бензальацетоном // Известия
Юго-Западного государственного университета.
Серия: Техника и технологии. – 2018. – Т.8 –
№1(26). – С.134-141.
2. Носова Н.В., Вагапов А.В., Гейн В.Л., Гейн
Л.Ф., Слепухин П.А. Синтез и строение 3-арил-2,4-
дибензоил-5-гидрокси-5-метилциклогексанонов и
2-бензоил-5-гидрокси-5-метил-3-фенилциклогек-
санона // Журнал общей химии. – 2018. – Т.88. –
Вып.5. – С.759-763.
3. Носова Н.В., Соколов А.А., Гейн О.Н., Гейн
В.Л., Янкин А.Н., Данилов С.Е., Дмитриев М.В.
Синтез и анальгетическая активность N,6-диарил-
4-гидрокси-4-метил-2-оксоциклогексан-1-карбок-
самидов и продуктов их дегидратации // Журнал
общей химии. – 2020. – Т.90. – Вып.9. – С.1315-1325
(DOI: 10.31857/S0044460X20090012).
4. Wang Ch., Zheng P., Chen P. Construction of
synthetic pathways for raspberry ketone production in
engineered Escherichia coli // Applied Microbiology
and Biotechnology. – 2019. – V.103. – Iss.9. – P.3715-
3725 (DOI: 10.1007/s00253-019-09748-5).
5. Milke L., Mutz M., Marienhagen J. Synthesis of
the character impact compound raspberry ketone and
additional flavoring phenylbutanoids of biotechnologi-
cal interest with Corynebacterium glutamicum // Mi-
crobial Cell Factories. - 2020. – V.19. – Iss.1 (DOI:
10.1186/s12934-020-01351-y).
6. Wang J., Qin R., Xiong W., Liu D., Feng J.
Asymmetric Hydrogenation of Benzalacetone Cata-
lyzed by TPPTS-Stabilized Ru in Ionic Liquids // Syn-
thesis and Reactivity in inorganic metal-organic and
nano-metal Chemistry. – 2015. – Vol.45. – Iss.6. –
P.834-838.
7. Tajabadi J., Bakavoli M., Gholizadeh M.,
Eshghi H. A mechanistic insight into the effect of pi-
peridine as an organocatalyst on the [3+2] cycloaddi-
tion reaction of benzalacetone with phenyl azide from
a computational study // Organic & biomolecular
Chemistry. – 2016. – Vol.14. – Iss.30. – P.7324-7333.
8. Wang H., Zhu H.-W., Guo R.-R., Hu Q.-L.,
Zeng Sh., Lu J.-X. Computational and Experimental
Study on Electrocarboxylation of Benzalacetone //
Asian Journal of organic Chemistry. – 2017. – Vol.6. –
Iss.10. – P.1380-1384.
9. Wang H., Zhu H.-W., Guo R.-R., Hu Q.-L.,
Zeng Sh., Lu J.-X. Computational and Experimental
Study on Electrocarboxylation of Benzalacetone //
Aaian Journal of organic Chemistry. – 2017. – V.6. –
Iss.10. – P.1380-1384 (DOI: 10.1002/ajoc.201700233).
10. Куликов М.А. Диметиламино-замещенный
метилстирилкетон и его производные // Вестник
технологического университета. – 2020. – Т.23. –
№2. – С.9-13.
11. Куликов М.А. Конденсация 4-диметилами-
нобензальдегида с несимметричными метилалкил-
кетонами // Norwegian Journal of development of the
International Science. – 2019. – №35. – Vol.2. – P.6-
11.
12. Куликов М.А. Электронные спектры погло-
щения алкилстирилкетонов и их производных //
Norwegian Journal of development of the International
Science. – 2021. – №53. – Vol.1. – P.3-6 (DOI:
10.24412/3453-9875-2021-53-1-3-6).
13. Куликов М.А. Исследование свойств заме-
щенных алкилстирилкетонов и их азометиновых
производных методом дифференциального терми-
ческого анализа // Вестник технологического уни-
верситета. – 2019. – Т.22. – №12. – С.12-14.
14. Синтезы органических препаратов. Сбор-
ник 1 / Пер с англ. А.Ф. Плате, под ред. Б.А. Казан-
ского. – Москва: Издатинлит, 1949. – с.79.
15. Преч Э., Бюльманн Ф., Аффольтер К. Опре-
деление строения органических соединений. Таб-
лицы спектральных данных. – М.: Мир; БИНОМ.
Лаборатория знаний, 2006. – 438 с.
16. Larkin P. Infrared and Raman Spectroscopy:
principles and spectral interpretation. – Elsevier, 2011.
– 228 p.
17. Tasumi M., Sakamoto A. Introduction to Ex-
perimental Infrared Spectroscopy. Fundamentals and
Practical Methods. – Wiley, 2015. – 389 p.](https://image.slidesharecdn.com/4axkfdo5rhmoyfvz6nh1-signature-e616dfddf0f780ceeda51d3bfa80bfe9124d0eec8e413093eaaa458e2a67433f-poli-210404190825/85/The-scientific-heritage-VOL-1-No-60-2021-16-320.jpg)
![The scientific heritage No 60 (2021) 17
PHYSICS AND MATHEMATICS
MODELING BEHAVIOR TEXTURED AND NON-TEXTURED ALLOY AT GREAT
DEFORMATIONS
Domichev K.
Kiev International University, professor
Chair of Computer Science
Candidate of technical sciences
Petrov A.
Dnieper National University named after Oles Honchar,
Senior researcher,
Chair of Theoretical and Computer Mechanics, PhD
Steblyanko P.
University of Customs and Finance, professor,
Chair of Cybersecurity and Information Technology
Doctor of Physical and Mathematical Sciences
DOI: 10.24412/9215-0365-2021-60-1-17-18
Abstract
The paper investigates influence of large deformations (up to about 15%) arising from the plastic deformation
of martensite on mechanical behavior of textured and non-textured alloy. The problem is considered in a geomet-
rically nonlinear formulation.
Experimental results show that with increasing plastic deformation, the residual deformation increases and
the phase deformation curves of the conversion stress from martensite to austenite become steeper and less obvi-
ous.
The paper proposes an analytical-numerical approach to describe diagram of material during unloading start-
ing from an arbitrary point of the active site. The approximation of the curve on the corresponding sections of the
diagrams is realized by means of a stressed spline.
Keywords: large deformations, pseudo-elastic-plasticity, spline functions, functional materials, geometric
nonlinearity.
The work is devoted to the study of structural ele-
ments made of functionally inhomogeneous materials
at large deformations. Functionally inhomogeneous
materials or intellectual materials are widely used in
science and technology. One of the representatives of
this class of materials are materials with shape memory
or materials with the property of pseudo-elastic-plastic-
ity. Their physical or mechanical properties are very
different from the behavior of conventional structural,
heat-resistant or tool materials. Mechanical behavior
largely depends on external conditions (temperature,
pressure) and the history of their change.
Materials with shape memory (MPF) are able to
accumulate deformation at low temperatures under
load, and after heating to fully or partially restore it.
Such materials include primarily alloys in which re-
verse martensitic transformations develop under ther-
mal or mechanical action. These alloys can be the basis
of composite materials, to a greater or lesser extent ca-
pable of restoring shape.
A similar phenomenon of shape change is ob-
served in polymeric materials. However, the nature of
deformation in them and the conditions of its creation
and implementation are significantly different from al-
loys with shape memory.
The main mechanism in these processes is the in-
verse martensitic transformation between the phases of
the solid, which can occur with a relatively small
change in temperature. This conversion can be caused
by a change in temperature or a change in voltage.
Materials that have the properties of shape
memory, pseudo-elasticity and pseudo-elastic-plastic-
ity usually include the following: NiTi AgCd, AuCd,
CuAlNi, CuSn, CuZn, FePt, MnCu, FeMnSi, CoNiAl,
CoNiGa, NiPe , NiTiNb, NiMnGa.
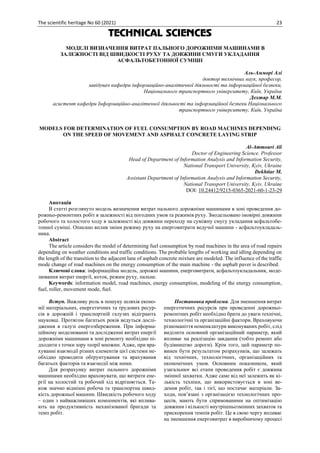
Investigation of the influence of large defor-
mations (up to about 15%), which arise from plastic de-
formation of martensite, on the mechanical behavior of
textured and non-textured alloy. The schematic dia-
gram of the material before and after the phase trans-
formation is shown in Figure 1. Note that in [1] the be-
havior of pseudo-elastic-plastic material at defor-
mations up to 6% was studied. In this case, residual
deformations during unloading were absent. The corre-
sponding problems of thermomechanics for shape
memory alloys were considered in a geometrically lin-
ear formulation.
In [4], the issue of modeling pseudo-elastic-plastic
bodies with deformations up to 6% using geometric
nonlinearity was investigated.
Experimental results show that with increasing
plastic deformation, the residual deformation increases
and the phase deformation curves of the transformation
stress from martensite to austenite become steeper and
less obvious [2].
Analytical-numerical approach to describe the di-
agram of material during unloading starting from an ar-
bitrary point of active site. The experimental results
shown in Figure 2 were used as a basis. The curve was
approximated in the corresponding section by means of
a stressed spline [3].](https://image.slidesharecdn.com/4axkfdo5rhmoyfvz6nh1-signature-e616dfddf0f780ceeda51d3bfa80bfe9124d0eec8e413093eaaa458e2a67433f-poli-210404190825/85/The-scientific-heritage-VOL-1-No-60-2021-17-320.jpg)
![18 The scientific heritage No 60 (2021)
Figure: 1. Schematic diagram of material for textured and non-textured alloy (with deformations up to 6%)
Figure: 2. Diagram of material for active release when unbound for textured and non-textured alloy (with defor-
mations up to 14%)
Conclusions. The influence of large deformations
(up to about 15%) arising from plastic deformation of
martensite on the mechanical behavior of textured and
non-textured alloy is studied in this work. A schematic
diagram of the material before and after the phase trans-
formation is constructed.
Similar problems were solved in a geometrically
linear formulation with deformations up to 6%. Exper-
imental results show that with increasing plastic defor-
mation, the residual deformation increases and the
phase strain curves of the conversion stress from mar-
tensite to austenite become steeper and less obvious.
The paper proposes an analytical-numerical ap-
proach to describe the diagram of the material during
unloading starting from an arbitrary point of the active
site. The experimental results shown in Figure 2 and the
approximation of the curve in the corresponding sec-
tion by means of a stressed spline were used as a basis
[3].
References
1. Steblyаnko P. Phenomenological Model of
Pseudo-Elastic-Plastic Material Under Nonstationary
Combining Loading/ P. Steblyanko, Y. Chernyakov, A.
Petrov, V. Loboda // Structural Integrity, Volume 8,
Theoretical, Applied and Experimental Mechanics,
Springer Verlag, 2019.- P. 205-208.
2. Wang X.M. Micromеchanical modelling of
the effect of plastic deformation on the mechanical be-
haviour in pseudoelastic shape memory alloys. / X.M.
Wang, B.X. Xu, Z.F. Yue // International Journal of
Plasticity 24, 2008. - P. 1307–1332.
3. Стеблянко П.А. Мeтоды расщепления в
пространственных задачах теории пластичности /
П.А. Стeблянко. – Киев: Наукова думка, 1998. –
304с.
4. Petrov A. Development of the method with en-
hanced accuracy for solving problems from the theory
of thermo-psevdoelastic-plasticity / А. Petrov, Yu.
Chernyakov, P. Steblyanko, K. Demichev, V. Hay-
durov // Eastern-European Journal of Enterprise Tech-
nologies. 2018. Vol. 4/7 (94). P. 25–33.](https://image.slidesharecdn.com/4axkfdo5rhmoyfvz6nh1-signature-e616dfddf0f780ceeda51d3bfa80bfe9124d0eec8e413093eaaa458e2a67433f-poli-210404190825/85/The-scientific-heritage-VOL-1-No-60-2021-18-320.jpg)
![The scientific heritage No 60 (2021) 19
ИСПОЛЬЗОВАНИЕ СПЕЦИАЛЬНЫХ ФУНКЦИЙ ДЛЯ РЕШЕНИЯ УРАВНЕНИЯ БАЛКИ С
ИЗМЕНЯЮЩИМСЯ СЕЧЕНИЕМ
Акимов А.А.
Тимербулатова Ю.И.
Юраш Ю.С.
Стерлитамакский филиал БашГУ,
Стерлитамак, Россия
USING SPECIAL FEATURES FUNCTIONS FOR SOLVING THE EQUATION OF A BEAM WITH A
VARIABLE CROSS-SECTION
Akimov A.
Timerbulatova Yu.
Yurash Yu.
Sterlitamak branch of the Bashkir state University,
Sterlitamak, Russia
DOI: 10.24412/9215-0365-2021-60-1-19-22
Аннотация
В статье рассматриваются краевые задачи для уравнения колебаний балки с изменяющимся сечением.
Подобный тип задач решается с использованием специальных функций типа Бесселя. В работе проведен
обзор работ на собственные значения для дифференциального уравнения колебаний балки с изменяю-
щимся сечением, построены общие решения для различных случаев. Решена задача колебаний неравно-
мерной колонны под действием собственного веса.
Abstract
The article deals with boundary value problems for the equation of vibrations of a beam with a changing
cross-section. This type of problem is solved using special functions of the type Bessel. In this paper, an overview
of the eigenvalues for the differential equation of vibrations of a beam with a variable cross-section built is carried
out, and General solutions for various cases are constructed. The problem of oscillations of an uneven column
under the action of its own weight is solved.
Ключевые слова: уравнение колебаний балки, функция Бесселя, специальные функции, колебания
колонны.
Keywords: equation of beam vibrations, a Bessel function, special functions, vibrations of the column.
Рассмотрим балку постоянной ширины и ли-
нейно изменяющейся толщины
ℎ = ℎ1 +
(ℎ0−ℎ1)𝑥
𝐿
,
где ℎ1 – толщина в сечении 𝑥 = 0, ℎ0 толщина
в сечении 𝑥 = 𝐿, где 𝐿 длина балки. Для конической
балки площадь сечения и момент инерции задаются
следующим образом
𝐼 =
𝑏ℎ3
12
=
𝑏[ℎ1𝐿 + (ℎ0−ℎ1)𝑥]3
12𝐿3
,
𝐴 = 𝑏ℎ = 𝑏[ℎ1 + (ℎ0−ℎ1)𝑥/𝐿].
Тогда уравнение, описывающее колебание ко-
нической балки будет иметь вид
𝐸
𝑑2
𝑑𝑥2
{
𝑏[ℎ1𝐿 + (ℎ0−ℎ1)𝑥]3
12𝐿3
𝑑2
𝑢
𝑑𝑥2
}
− 𝜌𝑏𝜔2
[ℎ1 +
(ℎ0−ℎ1)𝑥
𝐿
] 𝑢
= 0. (1)
Введем новую переменную
𝑧 = ℎ1 +
(ℎ0−ℎ1)𝑥
𝐿
.
Уравнение (1) примет вид
𝑑2
𝑑𝑧2
{𝑧3
𝑑2
𝑢
𝑑𝑧2
} = 𝑘4
𝑧𝑢, (2)
где
𝑘4
=
12𝜌𝜔2
𝐿4
𝐸(ℎ0−ℎ1)4
.
Решение уравнения (2) будем искать в виде
степенного ряда
𝑢 = ∑ 𝑧𝑛+𝛾
∞
𝑛=0
. (3)
Подставляя (3) в (2), получим общее решение
уравнения (2)
𝑢(𝑥) =
[𝐶1𝐽1(2𝑘√𝑧) + 𝐶2𝐼1(2𝑘√𝑧) + 𝐶3𝑌1(2𝑘√𝑧) + 𝐶4𝐾1(2𝑘√𝑧)]
√𝑧
, (4)
где 𝐽1, 𝐼1, 𝑌1, 𝐾1 – функция Бесселя, модифици-
рованная функция Бесселя, функция Ханкеля,
функция Макдональда. Решение (4) было впервые
получено в работе [1].
Свободные колебания балки с переменным се-
чением описываются уравнением
𝑑2
𝑑𝑥2
{𝐷(𝑥)
𝑑2
𝑢
𝑑𝑥2
} − 𝜌𝐴𝜔2
𝑢 = 0. (5)
Это уравнение можно переписать следующим
образом](https://image.slidesharecdn.com/4axkfdo5rhmoyfvz6nh1-signature-e616dfddf0f780ceeda51d3bfa80bfe9124d0eec8e413093eaaa458e2a67433f-poli-210404190825/85/The-scientific-heritage-VOL-1-No-60-2021-19-320.jpg)
![20 The scientific heritage No 60 (2021)
𝜉𝑚
𝑑4
𝑢
𝑑𝜉4
+ 2𝑚𝜉𝑚−1
𝑑3
𝑢
𝑑𝜉3
+ 𝑚(𝑚 − 1)𝜉𝑚−2
𝑑2
𝑢
𝑑𝜉2
− Ω2
𝜉𝑚
𝑢 = 0, (6)
где
𝜉 =
𝑥
𝐿
, Ω2
=
𝜌𝐴𝜔2
𝐿4
𝐸𝐼0
.
Умножая уравнение (6) на 𝜉4−𝑚
и, полагая 𝜃 =
4 − 𝑚 + 𝑛, получим
𝜉4
𝑑4
𝑢
𝑑𝜉4 + 2𝑚𝜉3
𝑑3
𝑢
𝑑𝜉3 + 𝑚(𝑚 − 1)𝜉2
𝑑2
𝑢
𝑑𝜉2 − Ω2
𝜉𝜃
𝑢 = 0, (7)
Введем следующие обозначения
𝑣 =
Ω2
𝜉𝜃
𝜃4
, 𝐿𝑢 = 𝑢
𝑑
𝑑𝑢
.
Тогда, уравнение (7) примет вид
𝐿𝑢 (𝐿𝑢 −
1
𝜃
) (𝐿𝑢 −
2 − 𝑚
𝜃
) (𝐿𝑢 −
3 − 𝑚
𝜃
) 𝑢 − 𝑢𝑣 = 0. (8)
Уравнение (8) представляет собой обобщенное
гипергеометрическое уравнение [3]. Общим реше-
нием этого уравнения является линейная комбина-
ция линейно независимых гипергеометрических
функций
𝑢1 = 0𝐹3 (– 1; −𝑏1, 𝑏2, 𝑏3; 𝑣), (91)
𝑢2 = 𝑣1−𝑏1
0𝐹3 (– 1; 2 − 𝑏1, 𝑏2−𝑏1 + 1, 𝑏3−𝑏1
+ 1; 𝑣), (92)
𝑢3 = 𝑣1−𝑏2
0𝐹3 (– 1; 𝑏1 − 𝑏2 + 1, 2 − 𝑏2, 𝑏3−𝑏2
+ 1; 𝑣), (93)
𝑢4 = 𝑣1−𝑏3
0𝐹3 (– 1; 𝑏1−𝑏3 + 1, 𝑏2−𝑏3
+ 1, 2 − 𝑏3; 𝑣), (94)
где
𝑏1 =
3 − 𝑚 + 𝑛
𝜃
, 𝑏2 =
2 + 𝑛
𝜃
, 𝑏3 =
1 + 𝑛
𝜃
.
0𝐹3 (𝑎1, 𝑎2, … , 𝑎𝑝; 𝑏1, 𝑏2, … 𝑏𝑞; 𝑣)
= ∑ [∏(𝑎𝑖)𝑛𝑢𝑛
𝑝
𝑖=1
] [∏(𝑏𝑗)𝑛𝑛!
𝑞
𝑗=1
]
−1
.
∞
𝑛=1
Функции (9) будут либо не определены, либо
не будут линейно независимыми, если 𝑏1, 𝑏2, 𝑏3 це-
лые числа или разность любых двух из них целое
число. Для этих случаев в решениях появляются ло-
гарифмические члены. Подробный вывод подоб-
ных решений методом Фробениуса были представ-
лены в работе [4]. В работе [1] были рассмотрены
следующие четыре случая: (а) когда два коэффици-
ента равны (это происходит, если 𝑚 = 1 или 𝑚 =
2 или 𝑚 = 4, откуда следует 𝑏1 = 𝑏3); (b) когда
один из коэффициентов равен единице (действи-
тельно, при 𝑚 = 2 или 𝑚 = 3, значение 𝑏1 или 𝑏3
равно единице; (c) когда 𝑏1 является отрицатель-
ным целым числом или нулем (это происходит, ко-
гда 𝜃 является обратным к положительному целому
числу); (d) когда разность двух коэффициентов есть
целое число (например, комбинация 𝑚 = 3 и 𝑛 =
1 дает 𝑏1 = 1/2 и 𝑏3 = 3/2, которые имеют раз-
ность равную единице.) Некоторые частные случаи
можно получить из общей формулы (9). Для одно-
родной балки, т. е. 𝑚 = 𝑛 = 0, 𝜃 = 4 и 𝑏1 = 3/4,
𝑏2 = 2/4, 𝑏3 = 1/4 гипергеометрические функции
сводятся к известному решению
𝑢(𝑥) = 𝐶1 sin(𝑘𝑥) + 𝐶2 cos(𝑘𝑥) + 𝐶3𝑐ℎ(𝑘𝑥)
+ 𝐶4𝑠ℎ(𝑘𝑥).
Другой частный случай возникает при 𝑚 −
𝑛 = 2 или 𝜃 = 2 и включает в себя клиновидные
и конусообразные балки. В этом случае решение
сводится к функциям Бесселя [2] :
𝐽𝜈(𝑥) =
(
𝑥
2
)
𝜈
Γ(1 + 𝜈) 0𝐹1 (– ; 1 + 𝜈; −
𝑥2
4
),
𝐼𝜈(𝑥) =
(
𝑥
2
)
𝜈
Γ(1 + 𝜈) 0𝐹1 (– ; 1 + 𝜈, ;
𝑥2
4
).
Последний частный случай относится к балке
с постоянной толщиной и линейно изменяющейся
шириной. Здесь 𝑚 = 𝑛 = 1, и 𝑏1 = 3/4, 𝑏2 = 3/4,
𝑏3 = 1/2. Так как значения 𝑏1, 𝑏2 равны, то реше-
ния 𝑢1, 𝑢2 совпадают, и решение 𝑢2 будет иметь вид
𝑢2 = 𝑢1𝑙𝑛𝑥 − 4𝑥
1
4 [
44
5 ∙ 42 ∙ 3
(
1
5
+
1
3
+
1
2
) 𝑢
+
44
9 ∙ 82 ∙ 7
44
5 ∙ 42 ∙ 3
(
1
9
+
1
7
+
1
5
+
1
9
+
1
7
+
1
5
) 𝑢2
+ ⋯ ].
Уравнения, описывающие процесс колебаний
неоднородных балок, являются уравнениями с пе-
ременными коэффициентами. Такие уравнения мо-
гут возникнуть и для однородного случая, напри-
мер при моделировании изгиба вертикальной ко-
лонны под влиянием собственного веса.
Рассмотрим колонну, один из концов которой за-
креплен, а второй свободен. Уравнение в этом слу-
чае имеет вид
𝐷(𝑥)𝑤𝑥𝑥 = 𝑀(𝑥), (10)
где 𝑀(𝑥) – изгибающий момент под действием
собственного веса колонны. Известно, что значение
𝑀(𝑥) определяется формой сечения колонны и
уравнение (10) принимает следующий вид
𝑑
𝑑𝑥
(𝐷(𝑥)𝑤𝑥𝑥) + 𝑞(𝐿 − 𝑥)𝑤𝑥 = 0. (11)
Если коэффициент изгибной жесткости 𝐷(𝑥)
является константой, то получим дифференциаль-
ное уравнение с постоянными коэффициентами
𝐷𝑤𝑥𝑥𝑥 + 𝑞(𝐿 − 𝑥)𝑤𝑥 = 0. (12)
Введем новую переменную
𝑥 = 𝐿 − √
9𝐷𝑧2
4𝑞
,
3
тогда
𝑤𝑥 = −√
3𝑞𝑧
2𝐷
3
𝑤𝑧,
𝑤𝑥𝑥 = √
9𝑞2
4𝐷2
3
(
𝑤𝑧
3𝑧3
+ √𝑧2
3
𝑤𝑧𝑧),
𝑤𝑥𝑥 = √
9𝑞2
4𝐷2
3
(
𝑤𝑧
3𝑧1/3
+ √𝑧2
3
𝑤𝑧𝑧),
𝑤𝑥𝑥𝑥 =
3𝑞
2𝐷
(
𝑤𝑧
𝑧
− 𝑤𝑧𝑧 − 𝑧𝑤𝑧𝑧𝑧).
В новых координатах уравнение (12) примет вид
𝑤𝑧𝑧𝑧 +
𝑤𝑧𝑧
𝑧
+ (1 −
1
9𝑧2
) 𝑤𝑧 = 0. (13)
Уравнение (13) является уравнением Бесселя,
относительно функции 𝑤𝑧, общее решение кото-
рого можно записать как
𝑤𝑧 = 𝐶1𝐽1/3(𝑧) + 𝐶2𝐽−
1
3
(𝑧). (14)](https://image.slidesharecdn.com/4axkfdo5rhmoyfvz6nh1-signature-e616dfddf0f780ceeda51d3bfa80bfe9124d0eec8e413093eaaa458e2a67433f-poli-210404190825/85/The-scientific-heritage-VOL-1-No-60-2021-20-320.jpg)
![The scientific heritage No 60 (2021) 21
Так как конец 𝑥 = 0 по условию жестко за-
креплен, получим следующие граничные условия:
𝑤(𝐿) = 𝑤𝑧(𝐿) = 0 (15).
Так как верхний конец свободен, то
lim
𝑧→0
(𝑤𝑧(𝑧) + 3𝑧𝑤𝑧𝑧(𝑧)) = 0 (16).
Следуя Dinnik [5], рассмотрим граничное усло-
вие при 𝑥 = 𝐿. Для малых значениях 𝑧, пренебрегая
слагаемыми степени больше единицы, запишем ре-
шение (14) в виде
𝑤𝑧 = 𝐷1𝑧1/3
+ 𝐷2𝑧−1/3
, (17)
где 𝐷1, 𝐷2 новые константы, пропорциональ-
ные 𝐶1, 𝐶2 соответственно. Подставляя (16) в гра-
ничное условие верхнего конца колонны, получим
𝐷1 = 𝐶1 = 0.
Граничное условие для нижнего конца ко-
лонны дает
𝐶2𝐽−
1
3
(
2
3
√
𝑞𝐿3
𝐷
) = 0.
Поскольку решение должно быть нетривиаль-
ное, то получаем
2
3
√
𝑞𝐿3
𝐷
= 𝛼𝑛,
где 𝛼𝑛 – корни трансцендентного уравнения
𝐽−1/3(𝛼) = 0. Таким образом, критическая
нагрузка, при которой наступают колебания, равна
𝑞кр =
9𝐷𝛼1
2
4𝐿3
.
Рассмотрим теперь случай, когда нижний ко-
нец колонны 𝑥 = 0 закреплен, а верхний имеет
скользящую заделку. Тогда будет выполняться гра-
ничное условие (15) и условие
lim
𝑧→0
𝑧1/3
𝑤𝑧(𝑧) = 0.
В этом случае, так как 𝑤𝑧 выражается через
функции Бесселя, запишем результат в виде следу-
ющего ряда
𝑧
1
3𝑤𝑧(𝑧) =
𝐶1𝑧2/3
21/3Γ(4/3)
(1 −
3𝑧2
16
+ ⋯ )
+
𝐶321/3
21/3Γ(4/3)
(1 −
3𝑧2
8
+ ⋯ ).
Из последнего равенства сразу следует, что
𝐶2 = 0. И для того чтобы решение было нетриви-
альным, положим
𝐽1/3 (
2
3
√
𝑞𝐿3
𝐷
) = 0.
Откуда
𝑞кр =
9𝐷𝛼1
2
4𝐿3
,
где 𝛼𝑛 – корни трансцендентного уравнения
𝐽1/3(𝛼) = 0.
Пусть теперь конец 𝑥 = 0 по-прежнему за-
креплен, а верхний конец находится под действием
сжимающей нагрузки P. В этом случае уравнение
(12) примет вид
𝐷𝑤𝑥𝑥𝑥 + 𝑞(𝐿∗
− 𝑥)𝑤𝑥 = 0, (18)
где
𝐿∗
=
𝑞𝐿 + 𝑃
𝑞
,
может быть определена, как эффективная
длина колонны. Как и в первом случае, когда один
конец защемлен, а второй свободен, получим общее
решение
𝑤𝑧 = 𝐶1𝐽1/3(𝑧) + 𝐶2𝐽−1/3(𝑧), (19)
𝑧 =
2
3
√
𝑞(𝐿∗ − 𝑥)3
𝐷
.
Тогда граничные условия на нижнем конце ко-
лонны примут вид
𝑧 =
2
3
√
𝑞(𝐿∗)3
𝐷
= 𝑧𝐿, 𝑤(𝐿∗) = 𝑤𝑧(𝐿∗) = 0. (20)
На верхнем конце колонны будем иметь соот-
ветственно
𝑧 =
2
3
√
𝑞(𝐿∗ − 𝐿)3
𝐷
= 𝑧𝑢, 𝑤𝑧(𝑧𝑢) + 3𝑧𝑤𝑧𝑧(𝑧𝑢) = 0,
где 𝑧𝐿, 𝑧𝑢 представляют значения 𝑧, взятые на
нижнем и верхнем основании соответственно. Гра-
ничные условия приводят к следующим уравне-
ниям
𝐶1𝐽1/3(𝑧𝐿) + 𝐶2𝐽−1/3(𝑧𝑢) = 0,
𝐶1𝐽−2/3(𝑧𝐿) − 𝐶2𝐽2/3(𝑧𝑢) = 0.
С учетом требований нетривиальности реше-
ния, получаем
𝐽1/3(𝑧𝐿)𝐽2/3(𝑧𝑢) + 𝐽−1/3(𝑧𝑢)𝐽−2/3(𝑧𝐿) = 0.
Если теперь верхнее основание колонны
жестко закрепить, тогда необходимо принять силу
реакции N. Тогда уравнение (12) примет вид
𝐷𝑤𝑥𝑥𝑥 + 𝑞(𝐿 − 𝑥)𝑤𝑥 = 𝑁 (21)
или в новых переменных
𝑤𝑧𝑧𝑧 +
𝑤𝑧𝑧
𝑧
+ (1 −
1
9𝑧2
) 𝑤𝑧 = −
2𝑁
3𝑞𝑧
. (22)
Общее решение уравнения (22) дается форму-
лой (14). Будем искать частное решение уравнения
(22) в виде
𝑑𝑤
𝑑𝑧
= 𝐵0 + 𝐵1𝑧 + ⋯ + 𝐵𝑛𝑧𝑛
+ ⋯.
Подставляя в уравнение (22) и приравнивая ко-
эффициенты при одинаковых степенях, получим,
что частное решение имеет вид
𝐶(𝑧)
= −
6𝑁𝑧
𝑞
[
1
9 ∙ 12 − 1
−
(3𝑧)2
(9 ∙ 12 − 1)(9 ∙ 32 − 1)
+ ⋯
+
(−1)𝑛(3𝑧)2𝑛
(9 ∙ 12 − 1)(9 ∙ 32 − 1) … [9 ∙ (2𝑛 + 1)2 − 1]
+ ⋯ ].
Общее решение уравнения (22) будет иметь
вид
𝑤 = 𝐶1𝐴(𝑧) + 𝐶2𝐵(𝑧) + 𝐷(𝑧) + 𝐶3,
где
𝐴(𝑧) = ∫ 𝐽1/3(𝑧)𝑑𝑧, 𝐵(𝑧) = ∫ 𝐽−1/3(𝑧)𝑑𝑧, 𝐷(𝑧)
= ∫ 𝐶(𝑧)𝑑𝑧.
Пусть колонна жестко закреплена с обоих кон-
цов. Тогда из граничных условий
𝑤(𝐿) = 𝑤𝑧(𝐿) = 𝑤(𝐿) = 𝑤𝑧(𝐿) = 0 (23)
следуют следующие соотношения](https://image.slidesharecdn.com/4axkfdo5rhmoyfvz6nh1-signature-e616dfddf0f780ceeda51d3bfa80bfe9124d0eec8e413093eaaa458e2a67433f-poli-210404190825/85/The-scientific-heritage-VOL-1-No-60-2021-21-320.jpg)

![24 The scientific heritage No 60 (2021)
і в результаті призводить до здешевлення кінцевої
продукції – ділянки дороги.
Аналіз останніх досліджень та публікацій.
Питанням організації виробництва та економії ма-
теріальних, виробничих та енергетичних ресурсів
при проведенні дорожніх робіт з ремонту та будів-
ництва автомобільних доріг присвячені роботи Ка-
ніна О. П. [1, 2], Дехтяр М. М. [3].
У зв`язку з великими обсягами вхідної інфор-
мації, необхідними для натурних досліджень витра-
тами людських, фінансових і матеріальних ресур-
сів, використовується інформаційне, імітаційне та
математичне моделювання.
При моделюванні використовуються актуальні
дані про транспортно-експлуатаційні показники ав-
томобільних доріг загального користування та шту-
чних споруд, прогнози щодо складу та інтенсивно-
сті транспортних потоків, результати розрахунків
кошторисні пропозиції, чинні галузеві аналітичні
комплекси, наприклад - Системи управління ста-
ном покриття (СУСП), Аналітичної експертної сис-
теми управління мостами (АЕСУМ)) [2] та резуль-
тати роботи програмного забезпечення з виявлення
потенційно небезпечних місць та ділянок доріг
(PTV Vissim) [4]. Основні поняття математичної
статистики, методів і моделей задач, що мають най-
більше застосування на практиці для аналізу транс-
портних задач з наведенням комп’ютерних алгори-
тмів та їх чисельної реалізації викладені в роботах
Данчука В. Д., Прокудіна Г. С., Цуканова О. І. та
Цимбал Н. М. [5], Аль-Амморі А. Н. [6]
При дослідженні праць науковців з питань ор-
ганізації будівництва та ремонту доріг було визна-
чено, що питанням організації дорожньо-ремонт-
них робіт з урахуванням елементів енергозбере-
ження приділяється недостатня увага. В основному
досліджуються можливості оптимізації технологіч-
них параметрів, застосування новітніх технологій
та матеріалів при проведенні дорожньо-ремонтних
та дорожньо-будівельних робітах.
Основна частина. Використання новітніх
комп`ютерних технологій та автоматизованих
систем сприяє підвищенню якості будівництва,
ремонту та утриманню автомобільних доріг і
наближає їх стан до європейського рівня по
екологічній безпеці та безпеці руху.
В зв’язку з широкою номенклатурою можли-
вих варіантів видів робіт та методів їх виконання
доцільно для знаходження оптимальних організа-
ційних рішень використовувати теорію множин [7].
При вирішенні задачі оптимального розподілу
виробничих ресурсів з точки зору теорії множин іс-
нують обмеження за рівнем рішення системи мно-
жин «ресурсів», що підлягають розподілу і множин
«споживачів». Ідея цієї схеми авторами, частково,
запозичена з роботи П. І. Сорокіна [8] і адаптована
до задач представлених в дослідженні (Рисунок 1).
До підмножин множини «споживачів» - відно-
сяться:
- множина об’єктів на фронті робіт:
1 2
{ , ,..., }
nz
Z z z z
= (1)
- множина видів робіт на об’єкті: зняття зно-
шеного шару дорожнього одягу, підготовка підсти-
льного шару, укладання асфальтобетону, його ущі-
льнення і т. ін.:
1 2
{ , ,..., }
kr
RR rr rr rr
=
(2)
- множину методів виконання видів робіт та
технологій, які можуть застосовуватись:
1 2
{ , ,..., }
mm
MV mv mv mv
= (3)
Рисунок 1. Структура моделі системи «споживачі-ресурси»](https://image.slidesharecdn.com/4axkfdo5rhmoyfvz6nh1-signature-e616dfddf0f780ceeda51d3bfa80bfe9124d0eec8e413093eaaa458e2a67433f-poli-210404190825/85/The-scientific-heritage-VOL-1-No-60-2021-24-320.jpg)
![The scientific heritage No 60 (2021) 27
- час знаходження котка на смузі ущіль-
нення
1
.
k
ущ
см
V
l
та
2
.
k
ущ
см
V
l
, год;
- час, коли коток виходить за межу смуги
ущільнення на довжину бази перед початком та пі-
сля закінчення ущільнення
k
mp
k
x
V
l
.
.
2
год;
- час переходу на суміжну смугу ущільнення
( )
k
mp
m
i
k
x
V
l
.
1
1
.
−
=
год;
- час переходу на суміжну смугу укладання
k
mp
пер
V
l
.
год;
- час, який витрачає робітник на переклю-
чення швидкостей при маневрах tпер, год.
Отже, формула, за якою визначається час, не-
обхідний для ущільнення однієї смуги ущільнення
буде мати такий вигляд:
+
+
+
=
=
=
=
= k
j
пер
k
mp
k
j
j
k
x
k
k
j
j
ущ
см
k
j
j
ущ
см
ущ t
V
l
V
l
V
l
t
1
.
1
.
2
3
.
1
3
1
.
1
.
2
(20)
Блок 12. Згідно формулою (21) визначається
час ущільнення смуги укладання разом з переходом
на суміжну:
+
+
+
+
=
= =
−
= =
= =
= = m
і
k
j
пер
k
mp
пер
k
mp
i
m
i
k
j
j
k
x
k
i
m
i
k
j
j
ущ
см
k
m
і i
j
j
ущ
см
к
заг t
V
l
V
l
V
l
V
l
t
1 1
.
.
1
1 1
.
2
1 3
.
1
1
3
1
.
.
2
(21)
Блок 13. За формулою (22) знаходиться час
вступу в технологічний процес наступного котка:
om
tm
ущ
om
tm
поч t
t ,
1
.
)
1
(
,
1
2
=
+
+
. (22)
Блок 14. Визначення часу роботи асфальтоук-
ладальника (23):
−
=
= =
p
tm
q
om
om
tm
поч
зм
зм
ay t
Т
T
2 1
,
. .(23)
Блок 15. Визначення часу вступу кожної доро-
жньої машини (від першої до останньої) в дію про-
тягом технологічних процесів. Роботи можуть про-
водитись на декількох смугах укладання, в залеж-
ності від кількості задіяної техніки. Для розрахунку
цього значення додаються строки початку вступу в
дію кожної машини.
Блок 16. Для знаходження сумарного часу по-
чатку роботи кожного котка на протязі зміни визна-
чається кількість повних циклів від початку роботи
першого котка до закінчення роботи останнього ко-
тка (подія може відбуватись на декількох смугах).
Блок 17. Час роботи асфальтоукладальника за
зміну визначається з (23).
Блок 18. Визначається кількість смуг укла-
дання, які улаштовує асфальтоукладальник за зміну
за формулою 24. Знаходиться як відношення зага-
льного часу знаходження асфальтоукладальника на
дорожньо-ремонтній ділянці до часу укладання од-
нієї смуги.
ау
заг
ау
зм
t
T
z
.
.
= (24)
Блок 19. Виводяться результати розрахунків,
отриманих в результаті роботи програми. Вони
включають в себе такі значення (вони змінюються
в залежності від погодних факторів, обраної дов-
жини смуги укладання та підбору механізованої
бригади):
- кількість смуг укладання за зміну;
- час, який знаходяться дорожні машини на
ділянці;
- довжина холостого та робочого ходу доро-
жніх машин за зміну;
- час, витрачений дорожніми машинами на
холостий та робочий хід за зміну;
- довжина змінної захватки.
У випадку, якщо організаційно доцільно вико-
ристовувати два асфальтоукладальники, то в Блоці
4 для асфальтоукладальника не потрібно визначати
довжину траєкторії холостого ходу (11, 12) і фор-
мула (13) прийме вигляд
ay
p
ау l
D .
= (25)
Через технічну та технологічну необхідність
другий асфальтоукладальник (за технологічної ка-
рти) повинен вступати в роботу після того, як пер-
ший уклав близько 30 м асфальтобетону.
В блоці 9 довжина траєкторії руху котка при
переході на суміжну смугу укладання (17) буде до-
рівнювати нулю.
Блок 20. Розрахунок витрат пального дорож-
німи машинами
Для розрахунку індивідуальної норми витрат
палива дорожньої машини і-го типорозміру
пропонується формула [9]:
Ні= geiNeiCі10-3
(кг/маш.-год) (26)](https://image.slidesharecdn.com/4axkfdo5rhmoyfvz6nh1-signature-e616dfddf0f780ceeda51d3bfa80bfe9124d0eec8e413093eaaa458e2a67433f-poli-210404190825/85/The-scientific-heritage-VOL-1-No-60-2021-27-320.jpg)
![28 The scientific heritage No 60 (2021)
де gei - питомі витрати пального при номінальній потужності двигуна машини і-ї марки, г/кВтч
(приймають згідно даних інструкції з експлуатації двигуна);
Nei - номінальна потужність двигуна машини tm-ї марки, кВт (приймають відповідно даних
згідно положень інструкції з експлуатації машини);
10-3
- коефіцієнт переведення грамів в кілограми.
Розрахунок нормативного коефіцієнту змінення витрат палива в залежності від завантаження машин
розраховується згідно формули:
Сі= Kдв і KдN і KTN і KTЗ і (27)
де KTN - коефіцієнт, що враховує змінення питомих витрат палива в залежності від ступеню
використання двигуна відповідно до потужності;
Kдв - коефіцієнт використання двигуна відповідно часу використання;
KдN - коефіцієнт використання двигуна відповідно до потужності;
KТЗ - коефіцієнт, що враховує витрати палива на запуск та регулювання роботи двигуна, а також
щозмінне технічне обслуговування машин на початку зміни (KТЗ=1, 015 – для машин з
потужністю двигуна меншою за 100 кВт; KТЗ=1,03- для машин з потужністю двигуна 100
кВт та більше)
Рисунок 2. Індивідуальні норми витрат палива асфальтоукладальником в залежності від робочої швид-
кості та довжини смуги укладання за зміну, кг/зм.
В результаті опрацювання інформаційних та
математичних моделей, було побудовано діаграму,
на якій відображено зміну норм витрат палива в за-
лежності від робочої швидкості та довжини смуги
укладання за зміну. Аналізуючи діаграму, можна
зробити висновок, що при збільшені довжини
смуги укладання витрати пального зменшуються.
Також на графіку видно, що мінімальна індивідуа-
льна витрата пального - при мінімальній швидкості
руху асфальтоукладальника та максимальній дов-
жині змінної захватки.
Список літератури
1. Канін О. П. Інформаційно-аналітична сис-
тема управління дорожнім господарством на основі
веб-технології / О. П. Канін // Автомобільні дороги
і дорожне будівництво. – 2016. – Вип. 95. – С. 129-
142. – URL:
http://publications.ntu.edu.ua/avtodorogi_i_stroitelstv
o/95/129-142.pdf
2. Канін О.П. Сутність та призначення інфор-
маційно-аналітичної системи управління дорожнім
господарством України [Текст] / О.П. Канін, А.М.
Харченко // Управління проектами, системний ана-
ліз і логістика: Науковий журнал. Вип. 9. – К.: НТУ,
2012. – С. 71-78.
3. Dekhtiar M. Informative design of processes
that take place in the zone of co-operation of transport
streams and zone of repair for translation/Slovakia.
Slovak international scientific journal. 2020.
No45.VOL.2.
4. Беспалов Д. Нужно ли транспортное микро-
моделирование или и без него все ясно/ Д. Беспа-
лов. URL: https://bespalov.me/tag/ptv-vissim/
5. Данчук В. Д. Комп’ютерні технології ста-
тистичного аналізу на транспорті: навч. посібник /
В. Д. Данчук, Г. С. Прокудін, О. І. Цуканов, Н. М.
Цимбал. Київ.: НТУ, 2013 – 276 с.
6. Данчук В. Д. Компьютерные и информа-
ционные технологии: уч. пособие/ В. Д. Данчук, А.
Н. Аль-Аммори, Е.В. Тимченко, А. Е. Клочан, Х. А.
Аль-Аммори. К. : НТУ, 2018.– 156 с.
7. Семченко А. И. О задаче оперативно-кале-
ндарного планирования эксплуатации парка машин](https://image.slidesharecdn.com/4axkfdo5rhmoyfvz6nh1-signature-e616dfddf0f780ceeda51d3bfa80bfe9124d0eec8e413093eaaa458e2a67433f-poli-210404190825/85/The-scientific-heritage-VOL-1-No-60-2021-28-320.jpg)
![The scientific heritage No 60 (2021) 29
в подразделениях механизации строительства/ А.
И. Семченко. Оптимальное использование ресур-
сов строительства АСУС / Ред. кол. П. И. Сорокин
(науч. ред.) –Воронеж :Изд-во Воронежского ун-та,
1980. – 163 с.
8. Сухиничев В. П. Модель функционирова-
ния комплектов машин для строительства дорог из
горячих асфальтобетонных смесей / Повышение
эффективности использование трудовых, энергети-
ческих и материальных ресурсов при эксплуатации
дорожных машин / В. П. Сухиничев, Е. С. Локшин.
Сб. науч. тр./МАДИ; Редкол А. М. Шейнин (отв.
ред.) и др. – М, 1987. – С. 96-102.
9. Методические указания по расчету норм
расхода бензина и дизельного топлива на работу
строительно-дорожных машин [разраб. Киселевым
М. М и др.], М. :ЦНИИОМТП, 1990. – 45 с.
«ПАРНИКОВЫЙ» ЭФФЕКТ. ВЫМЫСЕЛ ИЛИ СЛЕДСТВИЕ ПРОЛОНГИРОВАННОГО
ДЕЙСТВИЯ ТЕХНОГЕННЫХ СИСТЕМ?»
Леонов В.Е.
доктор технических наук, профессор
Херсонская государственная морская академия
Херсон, Украина
ORCID: https://orcid.org/0000-0001-5590-8807
Гуров А.А.
доцент, капитан дальнего плавания
Херсонская государственная морская академия,
Херсон, Украина
ORCID: https://orcid.org/0000-0002-1977-2815
«GREENHOUSE» EFFECT. FICTION OR RESULT OF THE PROLONGED ACTION OF THE
TECHNOGENIC SYSTEMS?
Leonov V.
Dr. of Technical Sciences, professor
Kherson State Maritime Academy, Kherson, Ukraine
ORCID: https://orcid.org/0000-0001-5590-8807
Gurov A.
associate professor, Deep Sea Captain.
Kherson State Maritime Academy, Kherson, Ukraine
ORCID: https://orcid.org/0000-0002-1977-2815
DOI: 10.24412/9215-0365-2021-60-1-29-39
Аннотация
В статье приведены научно-технические публикации по прогрессирующему изменению климата на
планете, обусловленное повышением среднегодовой температуры атмосферного воздуха, морской океа-
нической среды и как следствие сопровождающееся нарушением, а в отдельных случаях разрушением
природных экосистем, биотических сообществ, биом. Возможная причина изменения климата на планете
– «парниковый» эффект. Мнения ученых и экспертов по вопросу «парникового» эффекта на планете и его
последствий разделились на диаметрально – противоположные: 1) есть «парниковый» эффект, 2) нет «пар-
никового» эффекта. И это противоречие на наш взгляд вполне объяснимо. Действительно провести иссле-
дования в глобальном масштабе в трех экологических нишах окружающей среды невозможно. Поэтому
исследователями предлагаются различные модели, адекватность которых проверить в глобальном мас-
штабе окружающей среды, космоса невозможно. Несмотря на противоречивость взглядов на «парнико-
вый» эффект, можно констатировать, что последствия повышения среднегодовой температуры воздуш-
ного бассейна, морской океанической среды весьма отрицательные и прогнозируемо катастрофические.
Нами проведен анализ и расчетные исследования в течение последних 60-ти лет, характеризующихся
наиболее интенсивным потреблением углеводородного сырья невозобновимого характера, по накоплению
диоксида углерода-маркера «парникового» эффекта-в трех нишах окружающей среды. Из результатов
проведенных исследований напрашивается вывод о конгруэнтности роста эмиссии диоксида углерода ан-
тропогенного характера в воздушном бассейне и повышения среднегодовой температуры воздушного бас-
сейна, можно предположить и повышения среднегодовой температуры морской среды, в зависимости от
времени. Как выйти из создавшейся ситуации необратимого характера-пути имеются, сложнее с приня-
тием решения общепланетарного масштаба. Приведены примеры реализации научно-исследовательских
работ по снижению эмиссии компонентов «парниковых» газов на морском транспорте, что позволит ре-
шить двухвекторную задачу-повысить экономическую эффективность морских грузоперевозок и обеспе-
чить экологическую безопасность морских грузоперевозок.](https://image.slidesharecdn.com/4axkfdo5rhmoyfvz6nh1-signature-e616dfddf0f780ceeda51d3bfa80bfe9124d0eec8e413093eaaa458e2a67433f-poli-210404190825/85/The-scientific-heritage-VOL-1-No-60-2021-29-320.jpg)
![30 The scientific heritage No 60 (2021)
Abstract
The article presents scientific and technical publications on the progressive climate change on the planet,
caused by an increase in the average annual temperature of atmospheric air, marine oceanic environment and, as
a consequence, accompanied by the disruption, and in some cases destruction of natural ecosystems, biotic com-
munities, biomes. A possible cause of climate change on the planet is the "greenhouse" effect. The opinions of
scientists and experts on the issue of the "greenhouse" effect on the planet and its consequences were divided into
diametrically opposed ones: 1) there is a "greenhouse" effect, 2) there is no "greenhouse" effect. And this contra-
diction, in our opinion, is quite understandable. Indeed, it is impossible to conduct research on a global scale in
the three ecological niches of the environment. Therefore, researchers offer various models, the adequacy of which
is impossible to verify on a global scale of the environment, space. Despite the contradictory views on the "green-
house" effect, it can be stated that the consequences of an increase in the average annual temperature of the air
basin and the marine oceanic environment are very negative and predictably catastrophic. We have carried out an
analysis and computational studies over the past 60 years, characterized by the most intensive consumption of
hydrocarbon raw materials of a non-renewable nature, by the accumulation of carbon dioxide, a marker of the
"greenhouse" effect, in three environmental niches. From the results of the studies carried out, a conclusion sug-
gests itself about the congruence of the growth of anthropogenic carbon dioxide emissions in the air basin and the
increase in the average annual temperature of the air basin, it is possible to assume an increase in the average
annual temperature of the marine environment, depending on time. How to get out of this situation of irreversible
nature - there are ways, it is more difficult to make a decision on a planetary scale. The examples of the imple-
mentation of research work to reduce the emission of components of "greenhouse" gases in marine transport, which
will solve the two-vector task - to increase the economic efficiency of sea freight and ensure the environmental
safety of sea freight.
Ключевые слова: «парниковый» эффект, техногенные системы, морской транспорт, диоксид угле-
рода, температура, окружающая среда, морская, океаническая среда, экономическая эффективность, эко-
логическая безопасность, решение проблем, планета, зависимость, компоненты «парниковых» газов, су-
доходство.
Keywords: "greenhouse" effect, man-made systems, marine transport, carbon dioxide, temperature, environ-
ment, marine, oceanic environment, economic efficiency, environmental safety, problem solving, planet, depend-
ence, components of "greenhouse" gases, shipping.
Introduction.
The technogenic systems, in particular marine
transport, are the basic «suppliers» of components of
«greenhouse» gases, such substances and connections
as dioxide of carbon, hydrocarbons, nitrous oxide,
organic mineral dust, soot, pairs of water behave to that.
Opinions of scientists and experts through
question of planetary «greenhouse» effect are
diametrically opposite. And it, in our view, under itself
has basis. Really, to answer a simple question, whether
there is a «greenhouse» effect on a planet or he is not
present, necessary to have the reliable materials got as
a result of research works. To conduct experiments in
the global scale of planet and space in the direction of
study of «greenhouse» effect on the modern stage is not
possible. Therefore this work is conducted on the
offered hypothetical models. The methods of
mathematical design, on the basis of that preferentially
drawn conclusion about of presence or nonpresence of
«greenhouse» effect on Earth, are used in calculation
researches. A lack of any offered models of
«greenhouse» effect is the absence and/or impossibility
of verification of them on adequacy in the real terms of
experiment on a planet and in space.
Analysis of publications of the examined
question in fact.
In works [1-8] the detailed analysis over of
possible reasons of origin and consequences of
«greenhouse» effect is brought.
Scientists from the Californian University in
Irwine (USA) reported about the threat of flood for 400
million persons from a rise in temperature,
«greenhouse» effect [9]. The melting glaciers of
Greenland considerably heaved up the level of the
World ocean - for two months he increased on 2,2 mm.
Reason, melting became that a more than 600 milliard
of tons of ice. These processes were accompanied by a
too warm summer 2019 year. The last year was most
warm in all history of Arctic. It was shown by
calculations, that ice in Greenland began to melt
sevenfold quicker, than it was in 1990th.
The content of carbon dioxide in the Earth's
atmosphere in August 2019 increased by three points
relative to the same indicator in 2018, which means that
humanity cannot reduce CO2 emissions into the
atmosphere and slow down global warming, said the
National Aeronautics and Space Administration
(NASA, USA) [10].
The specialists of NASA confirmed exactness of
the recently obtained data on the temperature of air
layer at the surface of sea, dry spell, and ice sheet by
means of satellite Aqua, testifying to the rapid global
warming (information over is brought in a press-release
on Eurek Alert). According to the model calculations of
scientists, if no measures are taken to reduce
greenhouse gas emissions, then by the end of the 21st
century the temperature of seawater in the upper layer
2,000 m thick will rise by 0.78C. It will promote the
level of world ocean only due to thermal by volume
expansion on additional a 30 cm in addition to getting
up of level of marine aquatorium of coastline from a
melting glaciers. The increasing of temperature of
marine environment and air pool will provoke more
severe storms, hurricanes and extreme fallouts.
The scientists of Toronto University (Canada)
found out that rise in temperature of climate in a region](https://image.slidesharecdn.com/4axkfdo5rhmoyfvz6nh1-signature-e616dfddf0f780ceeda51d3bfa80bfe9124d0eec8e413093eaaa458e2a67433f-poli-210404190825/85/The-scientific-heritage-VOL-1-No-60-2021-30-320.jpg)
![The scientific heritage No 60 (2021) 31
Yukon on the north-west of Canada became the
strongest after more, than ten thousand years
(information over is brought in a press-release on Eurek
Alert). Researchers believe that warming on Earth
could destabilize permafrost, leading to even greater
emissions of methane and carbon dioxide, the main
components of «greenhouse» gases.
In work [11] scientists propose to spray aerosols
into the atmosphere of the air basin so as to reduce
warming by 50%. The idea itself is not new, but it has
been criticized. Researchers have created a
geoengineering model for targeting the Earth's climate
with aerosol spraying in the stratosphere. In the model
of scientists, sulfur dioxide was considered as an
aerosol. It is noted that this measure will not solve the
problem of global warming in general, but can only be
considered as part of an integrated approach.
As a comment of authors of this article to work
[11]:
1) from where to take in the enormous amounts of
planetary scale dioxide of sulphur as a protective
aerosol?
2) dioxide of sulphur in the stratospheric layer of
atmosphere will be exposed to oxidization by an active
oxidant by ozone to the sulphuric anhydride, and
sulphuric anhydride at co-operating with the pairs of
water, contained in atmospheric air, will result in
formation of sulphuric acid.
As a result, not deciding the problem of the global
warming of Earth, this suggestion will lead and to
strengthening two other global problems - to
destruction of «ozone layer» of planet and
intensification of «acid» rains.
The transport sector accounted for 22% of global
carbon dioxide emissions in 2010 [12], including the
shipping sector in 2013 accounting for 2.2% of global
CO2 emissions compared to 2.7% of CO2 emissions in
2008 (IMO, 2014 ).
In work [13] materials on carbon dioxide
emissions from public transport are given: in Sydney
(Australia), the level of carbon dioxide emissions per
passenger-kilometer was, g: 188 for an average car, 120
for a bus, 105 for a train ride, 171-by light rail. CO2
emissions from each chain were approximated by the
sum of emissions from all stages of the trip.
Results - one cannot do without reducing
technogenic (manmade systems) emissions of
components of "greenhouse" gases, one cannot solve
the global problem of climate warming on planet Earth.
Raising of task and possible ways of decision of
global problem of «greenhouse» effect.
By us, in order of discussion, for the last 60 years
an analysis [14], calculation researches, is conducted
on the accumulation of dioxide of carbon - basic
component of «greenhouse» gases on a planet. This
period of time was accepted coming from that exactly
he is characterized by the most intensive consumption
of hydrocarbon raw material of unrenewable character
(oil, natural gas, coal, slates) and, accordingly, most
emission of dioxide of carbon in an atmosphere and
environment. The results of researches are shown on a
figure 1.
Figure 1 - Change in the concentration of carbon dioxide and the average annual increase in atmospheric air
temperature depending on time (years):](https://image.slidesharecdn.com/4axkfdo5rhmoyfvz6nh1-signature-e616dfddf0f780ceeda51d3bfa80bfe9124d0eec8e413093eaaa458e2a67433f-poli-210404190825/85/The-scientific-heritage-VOL-1-No-60-2021-31-320.jpg)
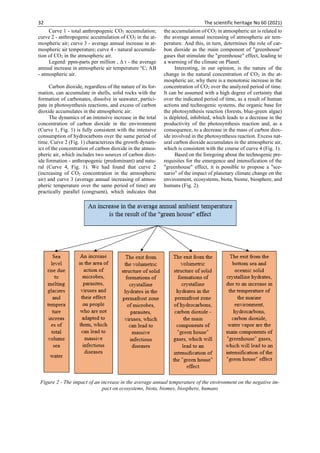
![The scientific heritage No 60 (2021) 33
The certainly offered model (Fig.2) has
hypothetical character, but in her basis indirect
confirmations of the climatic phenomenon lie from data
of change of some meteorological parameters of
environment for the long period of time.
In 2015 the international climatic summit of COP-
21 took place in Le Bourget (France), that was
sanctified to the problem of rise in temperature of
climate on a Planet and development of ways of
overcoming of this crisis. More than 137 states of the
world signed final Protocol of this summit. The USA is
the most meaningful consumer of hydrocarbon raw
material of unrenewable character and separate
countries the less meaningful in a plan consumptions of
hydrocarbon raw material did not sign final Protocol of
climatic summit, releasing itself from financial
expenses, nature protection measures. It follows from
this that greater part of the states of the world is
disturbed by the global warming and his consequences.
In Kyoto and Parisian Protocols on issue of
«greenhouse» effect on a Planet a Shipping and
Aviation were not plugged into final formulation of
Agreement.
International Marine Organization, International
Organization of Civil Aviation, made enough an effort,
that this error never repeated in future. Both these
international organizations draw line on the change of
eco law in part of toughening of requirements to
emitters of the technogenic systems, including the
Shipping and Aviation, on the basic components of
«greenhouse» gases. It is necessary to mark that some
Shipping and Aviation Companies are fully satisfied
with that Agreement «went round them a side», as they
fear additional material and financial charges on
introduction of measures with the purpose of providing
of the ecological safety related to the risk of
intensification of «greenhouse» effect.
It should be noted that certain steps on business of
defence of environment are nevertheless done. For
example, for the sea and river vessels an additional
certificate is entered on protecting of air space from
contamination from ship engines, that is IAPP -
International Air Pollution Prevention Certificate.
Fulfillment of requirements of this Certificate by sea
and river vessels undoubtedly brings the contribution to
defence of ecology.
«A navigation needs some progressive eco law, -
J. Carnerap Bang considers, senior expert on a climate
in the Danish company Maersk Group - it must be
universal, independent of flag and controlled by
International Marine Organization. Conception of
COP-21 must become a starting point for his making.
First, in the preliminary variant of the Parisian
agreement COP-21, 200 countries-participants worked
on that, the Navigation and Aviation were mentioned,
but this division of Agreement was abolished
afterwards. It is necessary to mark that this Division did
not contain concrete binding prescripts, just appeal to
pay attention to problems of maritime and aviation
vessels, but even in such kind could have influence on
both industries» [14].
Really, this just professional's opinion, responds
conception of ecological safety on the whole, the
Shipping and Aviation are in the first ten on a
contribution to the «greenhouse» effect and integral
contamination of planet, as a result of functioning of the
manmade systems.
From 1990 to 2010 mass of emission of harmful
toxic components and connections in Aviation
increases on 80 %, and in a Shipping - on 40 %.
Rapid development of these industries of the
manmade system can increase this contribution to the
«greenhouse» effect to 40 % in general balance even to
2050.
So insolvency of ignoring of Shipping and
Aviation in a rise of temperature of climate on Earth.
Besides material wastes, the Shipping and
Aviation distinguish the considerable level of energy
wastes - thermal, noise, vibration, electromagnetic
fields, ultrasonic and infrasonic radiations, radio
frequencies of all levels and spectrums, satellite
navigational, radar and radio contamination.
«A Parisian agreement will be specified and
finished off, − considers P. Khinchliff, Secretary
general of the International Chamber of Shipping
(ICS). - I am quite sure that on some stage we will carry
the opinion to the countries-founders and will enter a
necessary to us paragraph in a document».
In accordance with the analysis and calculations of
marine cargo transportation conducted by us a modern
marine transport expends an about 1 billion tons per
year of hydrocarbon ship fuel, that corresponds to
emission an about 3,2 billion tons per year of carbon
dioxide.
It is necessary to mark that in 2019 the total
emissions of dioxide of carbon - result of action of the
manmade systems is made 40 billion tons. At the same
time only from a Shipping, including ports and port
facilities, the emissions of carbon dioxide made an
about 4,5 billion tons per year.
Thus, deposit on the whole Shipping industries as
manmade system in a general «greenhouse» effect (on
dioxide of carbon) is 11,3 %. Possible to assume that in
an Aviation approximately the same size on a
contribution to the «greenhouse» effect. In the total on
the Shipping and Aviation part in a general
«greenhouse» effect is more than 22 %, and with it it is
necessary to be considered at prognostication of
development of intensity of «greenhouse» effect on a
Planet.
To eliminate emission of components of
«greenhouse» gases - dioxide of carbon, hydrocarbons,
mineral dust, soot is impossible when use of
hydrocarbon materials.
On the basis of our calculation researches it is
possible to establish executed, that emission of dioxide
of carbon is a consequence of processing of
hydrocarbon material. Emission of dioxide of carbon at
processing (incineration) settled accounts as general on
equalization:
е∑СО2 = едоб
СО2 + етр.
СО2 + епер.
СО2 + есж
СО2, (1)
где едоб
СО2, етр.
СО2, епер.
СО2, есж
СО2 – accordingly,
the emission of carbon dioxide during the extraction of
carbon dioxide, its transportation, processing and](https://image.slidesharecdn.com/4axkfdo5rhmoyfvz6nh1-signature-e616dfddf0f780ceeda51d3bfa80bfe9124d0eec8e413093eaaa458e2a67433f-poli-210404190825/85/The-scientific-heritage-VOL-1-No-60-2021-33-320.jpg)
![34 The scientific heritage No 60 (2021)
combustion, g СО2 - equivalent / kg of reference fuel,
and as a result of only combustion of hydrocarbon–
есж
СО2-.
Results over of calculations are brought on a
figure 3.
From a figure 3 follows that emission of carbon
dioxide, both general and only as a result of
incineration, goes down in a row «coal → fuel oil →
natural gas → hydrogen». As an oxidant when
incineration of hydrocarbon raw materials was used the
air.
Figure 3 - Emissions of carbon dioxide depending on the type of fuel burned
In case of incineration of hydrogen in the stream
of oxygen emission of dioxide of carbon at incineration
is equal to the zero, and general emission of dioxide of
carbon is equal 833 g СО2 - equivalent / kg of reference
fuel. (fig. 3).
Resource-saving technologies allow, from one
side, to bring down the specific consumption of
hydrocarbon raw material per conditional ton of having
special purpose products, and from other - to bring
down the emission of material and level of energy
wastes of the manmade systems.
Technical suggestions, that will allow to bring
down emission of dioxide carbon and, accordingly,
bring down the action of «greenhouse» effect, are
below given:
1. Development and realization of low-waste, re-
source-saving technologies, allowing to bring down
formation of material wastes and, as a result, bring
down the emission of dioxide of carbon.
2.Extraction, concentration, collection, translation
in the liquid aggregate state, storage and transporting of
the liquefied dioxide of carbon.
3. Chemical conversion of dioxide carbon by the
method of the catalytic hydrogenization in methanol
[14] and on the basis of methanol production of the
plastic masses, urea-formaldehyde resins, hydrocar-
boxylic acids, fertilizers, pharmaceutical products,
high-octane components of motor fuel, hydrogen, eth-
ylene, protein-vitamin concentrate, hydrate inhibitor
when mining of hydrocarbon gases.
In the Kherson State Marine Academy (a scientific
leader is professor Leonov V.Ye.) research,
experienced and experienced-industrial works are
conducted on development of resource-saving,
ecologically safe technologies and use of
nonhydrocarbon raw material for providing of
functioning of the manmade systems.
A pool of the Black sea is the powerful source of
unconventional energy resources, namely: the
sulphuretted hydrogen and ground crystallohydrates.
The ground crystallohydrates are a hard-phase alloy of
ice and dissolved (adsorbed) hydrocarbons of С1- С5+.
The Technical problem in the use of crystallohydrates
consists of their extraction, transporting on the surface
of marine environment [14], and regasification and
processing of crystallohydrates in compounds and
motor fuel does not present industrial complications
and can be realized in existent petrochemical
complexes.
The hydrogen sulfide contained in the area of the
Black sea presents an enormous potential danger for the
countries of Black Sea Region 1,2,14].
The scientific and technical problems of
deployment of the hydrogen sulfide for the production
of motor fuels and compounds include the next stages
[1,2,14]:
− deep-water extraction of the sulphuretted hy-
drogen;
− effective processing of the sulphuretted hydro-
gen in a motor fuel and chemical compounds.
We have been worked out an original technical
decision on the deep-water marine of the sulphuretted
hydrogen (≈10000 м). A decision is protected by the
patent of Ukraine [16].
By a technical decision [16] a stationary marine
platform, on that, collection, storage and preparation of
the obtained sulphuretted hydrogen to the subsequent
complex processing, comes true, is foreseen. The last
comes true also on a marine platform.
The methods of processing of the sulphuretted
hydrogen, sulfur-containing compounds are offered by](https://image.slidesharecdn.com/4axkfdo5rhmoyfvz6nh1-signature-e616dfddf0f780ceeda51d3bfa80bfe9124d0eec8e413093eaaa458e2a67433f-poli-210404190825/85/The-scientific-heritage-VOL-1-No-60-2021-34-320.jpg)
![The scientific heritage No 60 (2021) 35
patent [1,2,14] in valuable chemical compounds.
Methods differs in high technical and economic
indexes, namely, emission of harmful toxic
components with exhaust gases of vessels engine in an
atmosphere is fully absent.
At a complex extraction and processing of the
sulphuretted hydrogen of the Black Sea the basic
problems of ecological safety, financial viability,
resource-saving, defence of marine environment are
deciding:
1) the potential danger of «breach» through the
seawater of toxic, explosive and fire-hazardous hydro-
gen sulfide is reduced;
2) the dependence of countries on imports of hy-
drocarbon energy is reduced;
3) the socio-economic and environmental dam-
age to the environment of the Black Sea countries is
sharply reduced.
Based on the real state of affairs with stocks of hy-
drocarbon raw material, the time of their depletion, we
can suggest three stages of transition from hydrocarbon
raw material to nonhydrocarbon raw material:
1) remaining time of action and exploitation hy-
drocarbon raw material for providing of the manmade
systems, to the requirements of resource-saving;
2) transitional period, when the part of hydrocar-
bon raw material in general energy balance will make
50 % and more, up to a complete substitution hydrocar-
bon raw material - on 100 % nonhydrocarbon raw ma-
terial;
3) set period of realization of nonhydrocarbon
raw material for functioning of the manmade systems.
The completed epoch of hydrocarbon raw material
is characterized by the substantial «change» of
civilization toward unsteady development of society
[1,2,14]. This instability is characterized by substantial
influence of «greenhouse» effect, destruction of ozone
layer of Planet and ecosystems, intensive exhausting of
unrenewable and renewable energy, oxygen, natural
fresh water sources.
As recommendations it is possible to offer next
basic directions of activity within the framework of the
first stage is hydrocarbon raw material:
1) «to preserve» further exploration, develop-
ment and hydrocarbon production, to leave remaining
hydrocarbon raw material to the future generations as
reserve;
2) to transfer the manmade systems on resource-
saving and ecologically safe technologies [1,2,14];
3) to reduce the manmade impact on the develop-
ment of the "greenhouse" effect.
When extraction, storage, transporting of oil, and
also at her processing in petrol, diesel, boiler fuel, fuel
oil, besides casual and emergency losses, the
systematic losses of hydrocarbons, conditioned by
evaporation of liquid hydrocarbons from a surface at
the «large» and «small» breathing in a capacity
apparatus take place. The «large» breathing is
emphasizing of air with the pairs of hydrocarbons from
reservoirs when loading in its oils and light oil
products. The «small» breathing of reservoirs is
conditioned by the difference of temperatures of air on
day and night. The general losses of hydrocarbons in
the world reach of tens millions per year. A direct
economic damage due to the losses of oil and oil
products and ecological-economic damage are thus
inflicted because of contamination of air pool by
hydrocarbons - the components of «greenhouse» gases.
The losses of hydrocarbons only at priming and
storage of oil and oil products make a 1100 g/м3 of airily-
hydrocarbon mixture. According to the operating
directives of the European Union the concentration of
hydrocarbon in the vaporous state must not exceed a 35
g/м3, i.e. the losses of hydrocarbon should reduce more
than on 30 times by the requirements of European
Union [1,2,14].
For the decline of emission of hydrocarbons in
atmosphere in the process of exploitation of tankers,
gas carriers, chemical tankers, LPG carriers, innovative
technical decisions are worked out to practical
realization on a marine transport [1,2,14].
On a figure 4 a fundamental chart of adsorption of
steams of hydrocarbons is brought from the reservoir of
oil tanker.
Pairs of hydrocarbons from a reservoir 1 act on
suction compressor 2, where compressed to 0,3 МPа.
In a recuperative heat-exchanger 3 hydrocarbon-air
mixture cools down to minus 3°C, further on in a heat-
exchanger 6 cools down by freon to 5°C and enters
underbody of adsorber 4, in the pores of adsorbent 5 the
pairs of hydrocarbons are assimilated. As far as
absorption of hydrocarbons sorption capacity of
adsorbent 5 goes down and comes to the satiation
(working capacity).
For renewal of absorptive ability of sorbent
conduct his regeneration as follows: exhaust gases of
СЭУ at the temperature 450 - 500°C enter baghose 11,
where soot is distinguished. Instead of baghose
electrostatic precipitator can be used.
Purged from soot waste gases act at the
temperature 350°C in a regenerative heat-exchanger
10, in that the heat of waste gases is utilized with
making of steam (0,4 МPа, 240°C). In a catalytic
reactor 9 at the temperature 250 - 300°C, pressure 0,3
МPа on an oxide catalyst the oxide carbon and
hydrocarbons are neutralized. Cleared waste gases at
the temperature 250 - 300°C enter to underbody of
adsorber 4, here from the internal surface of adsorbent
5 hydrocarbons removed which then with waste gases
at the temperature 120°C enter refrigerator-condenser
7, in which waste gases and hydrocarbons cool down to
25°C..
In a separator 8 the division of phases passes -
gas, presenting the cleared exhaust gases, given in a
reservoir 1 as a protective «pillow» for prevention of
explosion, and a liquid phase presenting liquid
hydrocarbons goes back into a depository 1. Surplus of
waste gases after a separator 8 thrown out in an
atmosphere.
The presented technological scheme is resource-
saving, environmentally safety, and allows solving the
issues of fuel economy and environmental protection.](https://image.slidesharecdn.com/4axkfdo5rhmoyfvz6nh1-signature-e616dfddf0f780ceeda51d3bfa80bfe9124d0eec8e413093eaaa458e2a67433f-poli-210404190825/85/The-scientific-heritage-VOL-1-No-60-2021-35-320.jpg)
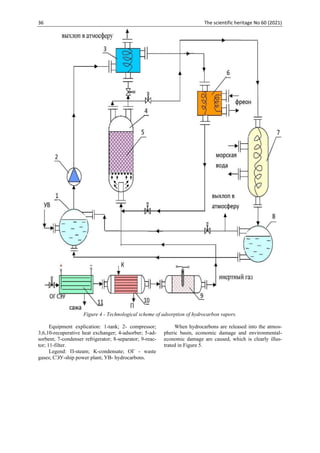
![38 The scientific heritage No 60 (2021)
Figure 6 - Schematic diagram of vapor recovery hydrocarbons [2, 14].
Equipment explication: 1 - pump; 2 - storage; 3 -
reducer; 4, 9, 12, 13 - shut-off valves in the closed po-
sition; 5, 21 - compressor; 6, 8, 16, 19 - shut-off valves
in open position; 7 - adsorber in absorption mode; 10,
11, 14, 15 - mixer-distributor; 17 - adsorber in the re-
generation mode; 18 - condenser refrigerator; 20 - in-
stallation for inert gas production; 22 - separator; 23 -
heat exchanger;
Legend: УВж - liquid hydrocarbons; УВп - hydro-
carbons in vapor phase; В- air; ИГ - inert gas; T - fuel;
Woo, Woh - respectively, cooling and heated water;
ИА - the initial adsorbent for absorption of hydro-
carbons. НА - adsorbent saturated with HCv; П - steam;
K - condensate.
The technology includes the following main
stages:
1. Collection and compression of the air-hydrocar-
bon mixture outgoing from the storage pos. 2
2. Adsorption of hydrocarbons vapors in the ad-
sorber pos. 7.
3. Regeneration of the saturated adsorbent in the
adsorber pos. 17 in an inert gas stream at increased tem-
perature.
4. Cooling of hydrocarbons vapors in the refriger-
ator-condenser pos. 18
5. Separation of inert gas and liquid hydrocarbons
in the separator pos. 22.
6. Return of inert gas after separator pos. 22 in the
regeneration cycle.
7. Return of gasoline (liquid hydrocarbons) to the
storage pos. 2.
The developed hydrocarbon absorption scheme is
resource-saving and environmentally safety. This is es-
pecially becoming relevant at the present time, since the
world's reserves of non-renewable hydrocarbon raw
materials are intensively depleted and limited, danger-
ous for the environment, biosphere and humans.
Hydrocarbon vapors released from storage 2 are
absorbed by the adsorbent in adsorber 7. The saturated
hydrocarbon adsorbent is regenerated in adsorber 17 in
an inert gas (IG) flow at a temperature of 65–80 ºС. As
a result of the regeneration, hydrocarbon separated
from the adsorber 17 are condensed upon cooling in the
refrigerator-condenser 18, collected in the separator 22,
in which they are separated into liquid B and gaseous
IG phases. Further on, the adsorber 7 operates in the
regeneration mode, and the adsorber 17 - in the hydro-
carbon absorption mode.
Characteristics of the refueling process
When 1 m3
of air is displaced, 1 kg of gasoline va-
por is lost. Let's take the storage volume of 1000 m3
,
then the gasoline losses during one refueling-delivery
will be:
1 kg • 1000 • 2 = 2000 kg = 2 tons of gasoline.
With 100 refueling gasoline losses will be: 1.19
200000 / 0.743 = 320 323 USD,
where 0.743 is the density of gasoline, kg / l;
1.19 - the price of 1 liter of AI-95 gasoline, USD.
Economic efficiency from the implementation of
a gasoline vapor recovery unit with an absorption rate
of 95% is: 320323 0.95 = 304307 USD.
The technology for capturing hydrocarbon vapors
complies with the Kyoto Protocol on 1997 (Japan),
Paris Agreement COP-21 (2015) on the reduction of
emissions of “greenhouse” gas components.
The payback period for a hydrocarbon vapor re-
covery unit is 2–5 years, depending on the unit's
productivity and the price of oil on the world market.](https://image.slidesharecdn.com/4axkfdo5rhmoyfvz6nh1-signature-e616dfddf0f780ceeda51d3bfa80bfe9124d0eec8e413093eaaa458e2a67433f-poli-210404190825/85/The-scientific-heritage-VOL-1-No-60-2021-38-320.jpg)
![40 The scientific heritage No 60 (2021)
IMPLEMENTATION OF THE ALGORITHM FOR CALCULATION COURSE (BEARING) ON
RHUMB LINE AND CONSTRUCTING THE TRAJECTORY OF THE SHIP'S TURNING CIRCLE IN
THE MATLAB PROGRAMMING ENVIRONMENT
Kupraty O.
Senior Lecturer at the Department “Navigation and Marine Safety”,
Odessa National Maritime University, Odessa, Ukraine
ORCID ID: 0000-0003-3519-504X
DOI: 10.24412/9215-0365-2021-60-1-40-45
Abstract
The article proposes the implementation of the algorithm for calculating the course along the rhumb line in
MATLAB, as well as the implementation of new empirical formulas for constructing the ship's turning circle in
MATLAB. This elaboration will help in creating software for control devices in terms of programming the calcu-
lation of the parameters of the ship's motion. The elaboration was based on the algorithm proposed by the author
for calculating the course (bearing) of the rhumb line, as well as the empirical formulas proposed by the author for
constructing the trajectory of the vessel's turning circle. The article also focuses on the patterns of calculating the
course (bearing) on the rhumb line and constructing the turning circle of the vessel, which were not mentioned
earlier.
Keywords: algorithm for calculating the course, rhumb line, program code, ship's turning circle, aggregate
of points.
1. Introduction
The topic of the article seems relevant in the light
of the development of autonomous ship management
technologies and the logic of decision-making on au-
tonomous courts. The author elaborated an algorithm
for calculating the course (bearing) on rhumb line and
new empirical formulas for constructing the trajectory
of the ship's turning circle [1-2].
The works [3] and [4] describe the theoretical jus-
tifications for solving a direct and reverse geodesic
problem.
The programming code for constructing a turning
circle trajectory is an actual elaboration not only for
constructing the ship's trajectory in autonomous con-
trol, but also for the further design of terminals capable
of accepting a vessel of assigned size.
This programming code allows you to simulate the
movement of the ship in the port area and conduct the
appropriate boundary isolinia, taking into account the
geometry of the ship's turning circle and all the associ-
ated risks.
2. The methods and materials used in the ar-
ticle
The article uses an experimental-calculated
method of research. Figure 1 presents a simplified
course calculation algorithm course (bearing) with a re-
finement of the course calculation on the lower condi-
tion, when R≤0. In this case, in practice, only options
highlighted in red for the left and right side are used. In
the initial version of the algorithm, when performing
the top condition, the sign before the π/2 was deter-
mined by the SIGN() function of MS Excel, and now
the algorithm is simplified to the ̶ π/2 view for the left
side of the algorithm and π/2 for the right side of the
algorithm. The simplification is based on the fact that
the remainder of dlonE is taken with the opposite sign
( ̶ dlonE). And dlonW, respectively, remains positive,
so the formula uses π/2.](https://image.slidesharecdn.com/4axkfdo5rhmoyfvz6nh1-signature-e616dfddf0f780ceeda51d3bfa80bfe9124d0eec8e413093eaaa458e2a67433f-poli-210404190825/85/The-scientific-heritage-VOL-1-No-60-2021-40-320.jpg)
![The scientific heritage No 60 (2021) 41
Fig. 1 for calculating the course (bearing) on rhumb line
New empirical formulas have been elaborated at
the source [2] to construct the ship's turning circle
trajectory. The turning circle of the vessel is considered
as a set of points, the coordinates of which are
calculated from the center of turning circle. The coor-
dinates of the tactical turning circle center and the cen-
ter of the steady-state turning circle are used to con-
struct the turning circle trajectory.
Formulas and designations are shown in Table 1.
Table 1.
Turning circle center coordinates and formulas for calculating trajectory
xδ = 0
yδ = RT − L1
yТ = yU = 0
through starboard side
xТ=RT
xU =DT – RU
through port side
xТ= –RT
xU = –DT + RU
Turning circle coordinates (in cables):
Before turn to 180 degrees:
LATi = Υi = yT+RT×cos(PL×π/180)
LONGi = Xi = xT+RТ×sin(PL×π/180)
After turn to 180 degrees:
LATi = Yi = yU+RU×cos(PL×π/180)
LONGi = Xi = xU+RU×sin(PL×π/180)](https://image.slidesharecdn.com/4axkfdo5rhmoyfvz6nh1-signature-e616dfddf0f780ceeda51d3bfa80bfe9124d0eec8e413093eaaa458e2a67433f-poli-210404190825/85/The-scientific-heritage-VOL-1-No-60-2021-41-320.jpg)
![42 The scientific heritage No 60 (2021)
3. Aims and tasks of the elaboration
The aims of this work were:
̶ implementation of the algorithm for calculation
course (bearing) on rhumb line in the MATLAB pro-
gramming environment;
̶ the use of new empirical formulas for construct-
ing ship’s turning circle in the MATLAB programming
environment;
In order to achieve the aims, the following tasks
were set:
̶ to elaborate a programming code in the MATLAB
environment to calculate the course (bearing) on rhumb
line between two points;
- to simulate the calculation of the course (bearing)
on rhumb line in the MATLAB programming environ-
ment;
- to elaborate a programming code in the
MATLAB environment to construct a ship's turning
circle trajectory;
- to simulate the construction of a ship's turning
trajectory in the MATLAB programming environment.
4. Realization of tasks
4.1 Elaboration a programming code in the
MATLAB environment to calculate the course
(bearing) on rhumb line between two points
Based on the analysis of the above algorithm, a
programming code was elaborated to calculate the
course (bearing) between two points based on geo-
graphical coordinates:
%Course_rhumb_line
lat1=…
long1=…
lat2=…
long2=…
lat1r=lat1*pi/180 %convert latitude to radians
lat2r=lat2*pi/180 %convert latitude to radians
long1r=-long1*pi/180 %convert longitude to radi-
ans with opposite sign
long2r=-long2*pi/180 %convert longitude to radi-
ans with opposite sign
dlonE=mod(long2r-long1r,2*pi) %calc.rem.1 of
the div. long. diff. on 2π
dlonW=mod(long1r-long2r,2*pi) %calc.rem.2 of
the div. long. diff. on 2π
R=log(tan(pi/4+lat2r/2)/tan(pi/4+lat1r/2)) %calc.
calculate the first summand R [1] of the difference of
isometric latitudes
if dlonE<dlonW && abs(dlonE)>=abs(R) %first
check
TC= mod(-pi/2-atan(R/(-dlonE)),2*pi)*180/pi
%first calc. variant
elseif dlonE<dlonW && abs(dlonE)<abs(R)&&
R>0 %second check
TC=mod(atan((-dlonE)/R),2*pi)*180/pi %sec-
ond calc. variant
elseif dlonE<dlonW && abs(dlonE)<abs(R)&&
R<=0 %third check
TC=mod(-pi+atan((-dlonE)/R),2*pi)*180/pi
%third calc. variant
elseif dlonE>=dlonW && abs(dlonW)>=abs(R)
%fourth check
TC= mod(pi/2-atan(R/dlonW),2*pi)*180/pi
%fourth calc. variant
elseif dlonE>=dlonW &&
abs(dlonW)<abs(R)&& R>0 %fifth check
TC=mod(atan(dlonW/R),2*pi)*180/pi %fifth
calc. variant
elseif dlonE>=dlonW &&
abs(dlonW)<abs(R)&& R<=0 %sixth check
TC=mod(pi+atan(dlonW/R),2*pi)*180/pi %sixth
calc. variant
end
%TC – true course in degrees
4.2 Simulation of the calculation course (bear-
ing) on rhumb line in the programming environ-
ment MATLAB
Simulation of the calculation course (bearing) on
rhumb line presented in the form of 3 examples demon-
strating the correctness of the code.
Example 1.
lat1=13.5
long1=11.5
lat2=12.5
long2=13.5
long1r = -0.1920
Abbreviations and Symbols
L1 ̶ turning circle advance
DT ̶ tactical turning circle diameter
Abbreviations and symbols
PL ̶ bearing from center of turning circle to one of the points of turning circle
aggregate of points, bearing is changing evolutionarily.
L1 ̶ turning circle advance
DT – tactical turning circle diameter
RT –tactical turning circle radius
RU – steady-state turning circle radius
xδ – coordinates of the place of the rudder shift along the axis x
yδ – coordinates of the place of the rudder shift along the axis y
xТ;yТ – coordinates of the center of tactical circle
xU;yU – coordinates of the center of steady-state turning circle
COG – COURSE OVER the GROUND
PL – bearing to one of the points of a turning circle](https://image.slidesharecdn.com/4axkfdo5rhmoyfvz6nh1-signature-e616dfddf0f780ceeda51d3bfa80bfe9124d0eec8e413093eaaa458e2a67433f-poli-210404190825/85/The-scientific-heritage-VOL-1-No-60-2021-42-320.jpg)
![The scientific heritage No 60 (2021) 43
long2r = -0.2269
dlonE = 6.2483
dlonW = 0.0349
R = -0.0179
TC =117.1650
Example 2.
lat1 = 14.5000
long1 =11.5000
lat2 =13.5000
long2 =10.5000
lat1r =0.2531
lat2r =0.2356
long1r =-0.2007
long2r =-0.1833
dlonE =0.0175
dlonW =6.2657
R =-0.0180
TC =224.1359
Example 3.
lat1 = 14.5000
long1 = 10.5000
lat2 = 17.5000
long2 = 11.5000
lat1r = 0.2531
lat2r = 0.3054
long1r = -0.1833
long2r = -0.2007
dlonE = 6.2657
dlonW = 0.0175
R = 0.0545
TC = 17.7643
4.3 Elaboration of programming code in the
MATLAB environment to construct a ship's turning
circle trajectory
When constructing the turning circle trajectory of
the vessel, it is necessary to calculate the coordinates of
the turning circle center and use the bearings to con-
struct the turning circle trajectory as a set of points.
To construct the starboard side turning circle co-
ordinates of the turning circle center on the axis x and
y determined from expression xT = RT, yT = 0, and for
port side turning circle are determined from the expres-
sion xT = ̶ RT, yT = 0.
Therefore, coordinates of the trajectory of the port
side turning circle as a set of points on the axis y equal
coordinates on the axis y for starboard side turning cir-
cle. And the coordinates of the port side turning circle
as a set of points on the axis x equal coordinates on the
axis x с opposite sign for starboard turning circle (x1=
̶ x).
Programming code in MATLAB environment
L1=… %advance
Rt=… %tactical radius
Ru=… %steady-state radius
xd=0 %coordinate of rudder shift place on ab-
scissa axis
yd=Rt-L1 %coordinates of rudder shift place on
ordinate axis
xt=Rt %coordinate of tactical turning circle center
on abscissa axis
xu=2*Rt-Ru %coord. of steady-state turning circle
center on abscissa axis
yt=0 %coordinate of tactical turning circle center
on ordinate axis
yu=yt %coordinate of steady-state turning circle
center on ordinate axis
PL1=[270:5:360,0:5:90] %evolutionary limits for
starboard side tactical turning circle
PL2=[90:5:300] %evolutionary limits for star-
board side steady-state turning circle
x=[xd,xt+Rt*sin(PL1*pi/180),xu+Ru*sin(PL2*pi/180
)] %calc. coord. on abs. axis of turning circle aggregate
of points
y=[yd,yt+Rt*cos(PL1*pi/180),yu+Ru*cos(PL2*pi/18
0)] %calc. coord. on ord. axis of turning circle aggre-
gate of points
x1=-x %determinate coord. on ord. axis of port
side turning circle aggregate of points
plot (x,y) %plotting starboard side turning circle
hold on
plot (x1,y)%plotting port side turning circle
hold on
axis equal
4.4 Simulation of the ship's turning circle tra-
jectory in a MATLAB programming environment
Simulation of the ship's turning circle trajectory in
a programming environment MATLAB presented as
two examples of demonstrate the correctness of the
code.
Example 4.
For initial data L1 = 13.9 cab, Rt=6.8 cab, Ru=5.8
cab, MATLAB, using the code above, constructs the
trajectory of the ship's turning circle as shown on Fig-
ure 2.](https://image.slidesharecdn.com/4axkfdo5rhmoyfvz6nh1-signature-e616dfddf0f780ceeda51d3bfa80bfe9124d0eec8e413093eaaa458e2a67433f-poli-210404190825/85/The-scientific-heritage-VOL-1-No-60-2021-43-320.jpg)
![44 The scientific heritage No 60 (2021)
Fig. 2. Trajectory of turning circle for initial data L1 = 13.9 cab,
Rt=6.8 cab, Ru=5.8 cab.
The starboard side turning circle limits were used
in the construction of the turning circle:
PL1=[270:5:360,0:5:90] – before the reversal of
the ship on the 180°;
PL2=[90:5:300] – after the reversal of the ship on
the 180°.
At the same time, the value of the evolutionary
step is equal to 5°. The starboard side reversal interval
is 180 degrees divided into two parts (to 360° and from
360°).
The program code is written in such a way that the
axis of the abscises of the value of coordinates for the
port side turning circle changed the sign to the opposite.
And the values of coordinates on the axis of the ordi-
nate remain the same:
x1=-x;
plot (x,y);
hold on
plot (x1,y);
hold on
axis equal
Example 5.
For initial data L1 = 7.2 cab, Rt=4.1 cab, Ru=3.6
cab, MATLAB, using the code above, constructs the
ship's turning circle trajectory as shown in Figure 3.
Fig. 3. Trajectory of turning circle for initial data L1 = 7.2 cab,
Rt=4.1 cab, Ru=3.6 cab.
10
8
6
4
2
0
-2
-4
-6
-8
-10
-10 -5 0 5 10
6
4
2
0
-2
-4
-6
-8 -6 -4 -2 0 2 4 6 8](https://image.slidesharecdn.com/4axkfdo5rhmoyfvz6nh1-signature-e616dfddf0f780ceeda51d3bfa80bfe9124d0eec8e413093eaaa458e2a67433f-poli-210404190825/85/The-scientific-heritage-VOL-1-No-60-2021-44-320.jpg)
![The scientific heritage No 60 (2021) 45
Figures 2 and 3 show the ship's turning at different
initial data, but on the same scale, allowing us to assess
the effectiveness of the software code. This software
code makes it possible to simulate the manoeuvre on
various rudder shifts.
5. Conclusions
1. As a result of the implementation of the algo-
rithm for calculation course (bearing) in the MATLAB
environment the programming code has been tested,
which has proven to be effective in three examples.
This code can thus be used to program autonomous ship
management devices.
2. The elaborated programming code for con-
structing the ship's turning circle trajectory is effective
on various rudder shifts. This code can be used to play
for autonomous ship steering for simulate the turning
circle maneuver with the overlay on the isobaths of
depths as well as for designing terminals, playing the
ship's trajectory in the port area.
References
1. Kupraty O.G. Збірник LІІІ Міжнародної нау-
ково-практичної інтернет - конференції el-
conf.com.ua «Вплив пандемії на розвиток науки»,
(Тези: «Elaboration of an algorithm for calculating the
course (bearing) of the loxodrome»), Том 2, С. 4-7, 12
жовтня 2020 року, м. Вінниця,
2. Kupraty O.G. The 10th International scientific
and practical conference “Priority Areas of Science
Research”, (Тези: «Elaboration of empirical formulas
for constructing the trajectory of the vessel’s turning
circle and calculating the geographical coordinates of
the vessel’s gravity center when turning»), 26-27 жов-
тня 2020 року, ISBN 978-1-75881-206-0, С. 14-21,
Primedia E-launch LLC, USA, Washington,
3. Ботнев В.А., Устинов С.М. Методы решения
прямой и обратной геодезических задач с высокой
точностью// Научно-технические ведомости
СПбГПУ 3' (198) 2014 Информатика. Телекомму-
никации. Управление // Математическое моделиро-
вание: методы, алгоритмы, технологии, С. 49-58.
4. Спешилов В.Н. Вычисление длины локсо-
дромии и ортодромии для протяженных маршрутов
плавания с учетом сфероидичности Земли//Науко-
вий вісник ХДМІ №1 (2), 2010, С. 56-61
5. http://www.movable-
type.co.uk/scripts/latlong.html
FEATURES OF THE ARCHITECTURE OF HIGH-RISE BUILDINGS
Serdyuchenko V.
3rd year student of the faculty of architecture and construction
Kuban state agrarian university named after I.T. Trubilin
DOI: 10.24412/9215-0365-2021-60-1-45-48
Abstract
The article deals with the architectural typology of high-rise buildings, their architecture. It is established that
the architecture of the building affects the economic efficiency of the project. In this regard, the development of
the architectural typology of high-rise buildings is a scientific task that is of great importance for their architectural
design.
Keywords: high-rise building, skyscraper, typology, architecture, architectural and planning solutions, mul-
tifunctional buildings, premises, urban development, urban planners.
In the modern world of construction, high-rise
buildings have received great development. They are an
example of how the utilitarian needs of humanity serve
as a powerful incentive for scientific and technological
progress, including the development of architectural
science, the emergence of new methods of urban plan-
ning, architectural and construction, structural and en-
gineering solutions. With the construction of skyscrap-
ers, the outlines of urban development have changed,
new dominants have appeared, and the organization of
living space is being transformed, both within the
buildings themselves and on the scale of the develop-
ment area. The more actively any branch of the national
economy develops, the more in-depth study it requires,
the more questions it raises for researchers. One of the
topical issues of high-rise construction that is proposed
to be considered is the architectural typology of high-
rise buildings [1, р. 60].
In the existing regulatory framework for construc-
tion, it is difficult to find clear guidelines for determin-
ing the type of high-rise building. This issue is also not
disclosed in the Russian literature on architecture. The
very concept of typology is often mentioned in various
articles and lectures on high-rise buildings, but, as a
rule, it is not covered fully enough to form a clear con-
cept of it and the need for its use in practice.
Researchers do not have a single approach and
methodology for dividing high-rise buildings into
types. As a rule, high-rise buildings are considered ex-
clusively multifunctional. This is due to the fact that
currently there is only an official definition of a multi-
functional high-rise building, which is given in MGSN
4.19-2005. But even this concept does not have a clear
definition of what exactly and in what ratio should be
the premises in such an object [2, р. 46].
The division of buildings into types is the basis for
research and the creation of a regulatory framework for
their design. The concept of typology refers to a method
of scientific knowledge, which is based on the dismem-
berment of systems of objects and their grouping using
a generalized, idealized model or type. It is used for the
purpose of comparative study of essential features, re-
lations, functions, relations, levels of organization of
objects both co-existing and separated in time.
The architectural typology of buildings and struc-
tures systematizes and develops the basic principles of](https://image.slidesharecdn.com/4axkfdo5rhmoyfvz6nh1-signature-e616dfddf0f780ceeda51d3bfa80bfe9124d0eec8e413093eaaa458e2a67433f-poli-210404190825/85/The-scientific-heritage-VOL-1-No-60-2021-45-320.jpg)
![46 The scientific heritage No 60 (2021)
the formation of buildings and structures, taking into
account their preferred characteristics. It reveals the so-
cial, ideological, functional, structural and technical,
economic, urban planning and architectural and artistic
requirements. Defines the classification and nomencla-
ture of types and types of buildings, sets the main pa-
rameters of design standards, composition, size, nature
of technological connections of premises and their
equipment [3, р. 65].
It should be noted that, first of all, the type of
buildings is determined by urban planners when plan-
ning the development or reconstruction of an urban
area, taking into account its purpose (residential, ad-
ministrative, industrial).
At the same time, modern high-rise buildings at-
tract special attention of specialists as they have be-
come part of the urban structure that includes the main
types of people's life activities - housing, recreation,
places of employment. Active construction of tall
buildings affects the quantitative and qualitative
changes in the structure and appearance of cities - a sig-
nificant change in way of life of the population, im-
proving the social status of their construction, creation
of modern infrastructure, the approach of the service
system to the user, enhancing comfort.
Along with the positive factors of high-rise build-
ing has a lot of negative - first of all this complication
of architectural and design solutions, large energy con-
sumption, complex engineering systems and equip-
ment, difficulties in evacuation of high-rise buildings,
impact on the environment of construction area. Acute
issues of high-rise construction were the excess of the
density of buildings and population, transport services,
and the preservation of historical city centers. There-
fore, the study of the types of high-rise buildings, their
impact on the existing buildings, has become an im-
portant issue of theoretical and practical research, espe-
cially for urban planners. A number of studies on this
problem have already been carried out by urban plan-
ners, and their result is the regulatory requirements in-
cluded in the regulatory documents.
Thus, MGSN 1.04-2005, developed by the State
Unitary Enterprise NIiPI of the General Plan of Mos-
cow, appendix " B " defines the main types of high-rise
complexes, the functional composition and the ratio of
the areas of their premises. With this in mind, clause
4.4. specifies the requirements for the placement of
these types of high-rise complexes in various urban ar-
eas. For example, high-rise public and public-residen-
tial complexes may be located on the territory desig-
nated for residential groups and microdistricts.
Considering the approach of planners to the clas-
sification of high-rise buildings and architectural tradi-
tions of domestic science, the typology of the objects in
question can be made based on their functional pur-
pose, taking into account architectural and artistic ar-
chitectural solutions. The functional purpose of the
building is determined by the nature of the premises
placed in it. Therefore, to develop issues of typology of
high-rise buildings, first of all, it is necessary to analyze
their functional composition, classify the premises in-
cluded in it, identify functional-forming elements, their
placement in the building, relationships and mutual in-
fluence.
The analysis of high-rise buildings constructed,
designed and proposed as concepts in our country and
abroad shows that most often their functional-forming
elements are residential, hotel, and administrative
premises. In addition to these, it can be educational,
medical, library premises, designed in high-rise build-
ings less often, and production facilities, which could
potentially be designed in them in the future. The types,
nomenclature, safety requirements and design rules for
each of these premises separately have already been
identified and regulated by the relevant building codes
and regulations: SNiP 31-01-2003, SNiP 2.08.02-89*,
SNiP 31-05-2003, SNiP 21-02-99*. Meanwhile, the ty-
pological requirements for a high-rise building that in-
cludes these premises have not yet been formed.
Considering the functional and planning solution
of the building, it can be noted that if the premises of
various functional purposes share its area in approxi-
mately equal parts, then the classification of such an
object as a multifunctional one is not in doubt. At the
same time, in the practice of design and construction,
there are a significant number of buildings with archi-
tectural and planning solutions, in which the entire
building is occupied by premises of only one functional
purpose, for example, residential (apartments and
apartment-type apartments); The exception is the pub-
lic premises that serve the residents of this house, as
well as trade enterprises and service institutions in the
first floors or the stylobate part. If such a building has
a height of up to 75 m, it is designed according to SNiP
31-01-2003 and is considered a "residential multi-
apartment building with built-in and attached public
premises". In this regard, the question arises, can a
high-rise building with a similar functional and plan-
ning solution be considered multifunctional? Obvi-
ously, such a definition would be inappropriate. The
same situation occurs when almost all floors are occu-
pied by a hotel or administrative premises. The authors
suggest that such high-rise buildings should be consid-
ered specialized, that is, their architecture will be sub-
ordinated to the placement of premises of any one func-
tional-forming element.
High - rise building- a building whose height is
more regulated building codes for residential and pub-
lic multi-storey and multifunctional buildings and de-
sign, which is in accordance with the requirements of
the town planning code, SNiP and other regulatory doc-
uments is based on Special technical conditions for the
design.
Buildings with a height of usually more than 26
floors are called high-rise.
High-rise complex - a group of buildings, includ-
ing a high-rise building (or several high-rise buildings),
united by a common architectural and planning and ar-
chitectural and artistic solution.
Winter garden - a heated room that has mainly nat-
ural light and is adapted for growing plants.
High-rise buildings can be divided into two main
types: multifunctional and specialized.](https://image.slidesharecdn.com/4axkfdo5rhmoyfvz6nh1-signature-e616dfddf0f780ceeda51d3bfa80bfe9124d0eec8e413093eaaa458e2a67433f-poli-210404190825/85/The-scientific-heritage-VOL-1-No-60-2021-46-320.jpg)
![48 The scientific heritage No 60 (2021)
adopted, the choice of which certainly requires appro-
priate recommendations.
We should also not forget that the type of high-rise
building is an important factor in the choice of design
solutions and engineering systems, which can be com-
pletely different for residential and a number of public
buildings.
There are many such requirements and nuances
that must be taken into account by an architect design-
ing a high-rise building. They should be taken into ac-
count in the theoretical knowledge of the typology and
determine the practice of design and construction.
The requirements of the typology for buildings in-
tended for housing include restrictions in the space-
planning solution for height. "Numerous calculations
throughout the history of high-rise construction have
shown that even despite the high cost and limited re-
serve of urban land (the main incentives for high-rise
construction), the economic feasibility of high-rise res-
idential buildings as a mass product ends at a height of
25-30 floors. It is this figure that the vast majority of
high-rise residential buildings around the world are
limited to, because further increase in the number of
floors requires special measures for the implementation
and control of structural and fire safety, special solu-
tions for water, heat and electricity supply, special,
complex and expensive ventilation systems, sewerage
and even garbage disposal." [Chizhov. Skyscrapers and
people].
Along with this, both in Russia and abroad, there
are objects, the construction of which is planned based
on the considerations of prestige, image. Examples in-
clude the projects of the building of the National Li-
brary of Belarus, as well as the "Grand Arch" in the De-
fense district (Paris, France), the towers of the Kuwaiti
Investment Company "Gates of Europe" (Madrid,
Spain), "Central China Television Headquarters"
(CCTV) (Beijing, China) and others. In this case, the
requirements of the cost-effectiveness of the project are
inferior to the original architectural and artistic solu-
tion. The increase in construction costs, due to the so-
lution of such specific problems as increased loads on
foundations, significant wind loads, increasing power
consumption, high cost of engineering and technologi-
cal equipment of the building and its operation, requir-
ing extensive staff of highly qualified personnel. All
this obviously defines unique buildings as expensive
objects and, therefore, focuses them on the consumer
with a high level of income and implies the correspond-
ing consumer qualities of these buildings. At the same
time, the design, engineering and architectural and ar-
tistic solutions of these objects are carried out at a high
level, which, of course, can serve as a valuable experi-
ence in the design of high-rise buildings.
Meanwhile, the architectural and artistic solution
of the building cannot but depend on its purpose, on the
contrary, the consistency of architecture in this area is
mandatory. Building volume, composition of facades,
artistic design details shall disclose the purpose of the
building, creating a corresponding emotional mood of
a person, attracting visitors to it, or doing the opposite
unapproachable. From these positions, the architectural
and artistic solution of the building adopted by the au-
thors should be evaluated by the city planning council.
The considered material gives grounds to believe
that the definition of the type of building and its corre-
sponding architectural-planning and architectural-artis-
tic solutions affects the economic efficiency of the pro-
ject, both during construction and operation, its con-
sumer qualities. The scheme of making architectural
decisions can be simplified as follows: 1 - determining
the type of building, 2 - designating it as an ordinary or
unique object, 3 - selecting the appropriate architectural
and planning and architectural and artistic solutions.
Thus, in the cases considered, the type of building
determines its architecture. Given this, the basics of the
architectural typology of high-rise buildings, the no-
menclature of types and their corresponding architec-
tural solutions require in-depth study. The development
of the architectural typology of high-rise buildings is a
scientific task of great importance for their architectural
design, which is advisable to be carried out mainly at
the level of state programs. It should be given due con-
sideration in determining the priority areas of research
in the field of architecture.
In addition, taking into account the direct interest
of regions and megacities, where high-rise construction
is developing particularly intensively, in solving issues
of improving the quality of design of the objects under
consideration, it is advisable to determine the condi-
tions for their participation in the general work. These
can be studies, the results of which are necessary for the
development of local norms and standards of enter-
prises.
References
1. Serdyuchenko V. M. Historical breakthrough in
development of construction of sky scrapers / V. M.
Serdyuchenko, D. A. Salfetnikov // The Scientific Her-
itage. – 2020. № 50-1 (50). – С. 58-61.
2. Serdyuchenko V. M. Improving the human en-
vironment through neopositivist and environmentally
friendly building materials / V. M. Serdyuchenko, A.
V. Bychkov // The Scientific Heritage. – 2020. № 46-
1 (46). – С. 46-47.
3. Serdyuchenko V. M. Mathematical modeling in
construction / V. M. Serdyuchenko, A. E. Sergeev //
Trends in the development of science and education.
2020. – № 61-3. – С. 64-67.](https://image.slidesharecdn.com/4axkfdo5rhmoyfvz6nh1-signature-e616dfddf0f780ceeda51d3bfa80bfe9124d0eec8e413093eaaa458e2a67433f-poli-210404190825/85/The-scientific-heritage-VOL-1-No-60-2021-48-320.jpg)
![The scientific heritage No 60 (2021) 49
ШИРОКОСМУГОВИЙ ПЕРЕМИКАЧ НА ЧАСТКОВО ЗАПОВНЕНОМУ ДІЕЛЕКТРИКОМ
ПРЯМОКУТНОМУ ХВИЛЕВОДІ
Почерняєв В.М.
д.т.н., професор,
Одеська національна академія зв'язку ім. О.С. Попова, Україна
Сивкова Н.М.
старший викладач,
Одеська національна академія зв'язку ім. О.С. Попова, Україна
BROADBAND SWITCH ON PARTIALLY FILLED BY DIELECTRIC RECTANGULAR
WAVEGUIDE
Pochernyaev V.
Doctor of Technical Sciences, Prof.,
О.S. Popov Odessa national academy of telecommunications, Ukraine
Syvkova N.
senior lecturer,
О.S. Popov Odessa national academy of telecommunications, Ukraine
DOI: 10.24412/9215-0365-2021-60-1-49-52
Анотація
В роботі досліджується широкосмуговий перемикач для техніки НВЧ, антенно-фідерні тракти яких
реалізовані на частково заповненому діелектриком прямокутному хвилеводі (ЧЗДПХ). Сучасні засоби зв'я-
зку НВЧ діапазону можуть працювати на передачу по двох незалежних антенних каналах, в кожен з яких
включений свій передавач НВЧ. Передбачається також робота одного передавача НВЧ на дві антени. Пе-
редача сигналів великої потужності вимагає реалізації пристроїв на ЧЗДПХ для таких антенно-фідерних
трактів. Активний елемент являє собою відкриту нелінійну структуру (ВНС), включену в діелектричну
пластину, розташовану в прямокутному хвилеводі. Електродинамічна задача вирішується методом влас-
них функцій. У роботі знайдено коефіцієнт передачі Т11 і побудовані графіки залежності електричної дов-
жини відрізка хвилеводу з ВНС від величини реактивної провідності індуктивного шлейфу при фіксованих
реактивних провідностях ВНС. Результати роботи можуть бути використані при розробці широкосмуго-
вих перемикачів для мобільних цифрових комбінованих тропосферно-радіорелейних станцій з просто-
рово-рознесеною передачею, антенно-фідерні тракти яких реалізуються на ЧЗДПХ.
Abstract
At article investigates a broadband switch for microwave technology, antenna-feeder paths of which are im-
plemented on a rectangular waveguide partially filled by a dielectric (RWPFD). Modern means of communication
of the microwave range can operate for transmission through two independent antenna channels, each of which
includes its own microwave transmitter. It is also provided the operation of one microwave transmitter for two
antennas. The transmission of high-power signals requires the implementation devices based on RWPFD for such
antenna-feeder paths. The active element is an open nonlinear structure (ONS) included in a dielectric plate which
located in a rectangular waveguide. The electrodynamic problem is solved by the method of eigenfunctions. In
this article, the transfer coefficient T11 and plotted the graphs of the dependence of the electrical length of the
waveguide segment with the ONS on the value of the reactive conductivity of the inductive loop at fixed reactive
conductivity of the ONS is determine. The results of this article can be used in the development of broadband
switches for mobile digital combined troposcatter-radio relay stations with space-diversity transmission, antenna-
feeder paths of which are implemented on the RWPFD.
Ключові слова: частково заповнений діелектриком прямокутний хвилевод, широкосмуговий переми-
кач, антенно-фідерний тракт, відкрита нелінійна структура, передавач НВЧ.
Keywords: rectangular waveguide partially filled by dielectric, broadband switch, antenna-feeder path, open
no nlinear structure, microwave transmitter.
Одним з напряму розвитку техніки НВЧ є
комбіновані радіотехнічні системи. В роботі [1]
аналізується мобільна цифрова тропосферно-
радіорелейна станція, в складі якої знаходяться два
передавача НВЧ. Дана станція може працювати на
передачу по двох незалежних антенних каналах, в
кожен з яких включений свій передавач НВЧ. Мож-
лива робота одного передавача НВЧ на дві антени;
другий передавач НВЧ знаходиться в резерві. Різні
режими роботи передавального тракту НВЧ забез-
печуються двома двопозиційними перемикачами
НВЧ [1, рис.1]. Вимогу щодо забезпечення широ-
космугової роботи передавального тракту НВЧ
можна виконати шляхом реалізації тракту на част-
ково заповненому діелектриком прямокутному
хвилеводі (ЧЗДПХ). В цьому випадку необхідно
двопозиційні широкосмугові перемикачі НВЧ ре-
алізувати так само на ЧЗДПХ.](https://image.slidesharecdn.com/4axkfdo5rhmoyfvz6nh1-signature-e616dfddf0f780ceeda51d3bfa80bfe9124d0eec8e413093eaaa458e2a67433f-poli-210404190825/85/The-scientific-heritage-VOL-1-No-60-2021-49-320.jpg)
![50 The scientific heritage No 60 (2021)
Метою роботи є розробка широкосмугового
перемикача НВЧ на ЧЗДПХ.
Перемикач НВЧ має в своєму складі безкор-
пусний напівпровідниковий діод, який включається
в діелектричну пластину у вигляді відкритої
нелінійної структури (ВНС). Включення ВНС може
бути як паралельним, так і послідовним.
При послідовному включенні ВНС в ЧЗДПХ
можна отримати широку смугу пропускання, але
ємність ВНС повинна бути мінімальною. Пара-
лельне включення ВНС дозволяє забезпечити
більш високий рівень комутованої потужності ніж
при послідовному включенні. Слід зазначити, що
саме реалізація перемикача на ЧЗДПХ забезпечує
більш широку робочу смугу частот і більш високу
електричну міцність [2]. Крім цього, розширити ро-
бочу смугу частот можна, якщо паралельне вклю-
чення ВНС в ЧЗДПХ здійснюється разом зі шлей-
фом, що компенсує ємність ВНС.
На рис.1 показано конструкція перемикача на
ЧЗДПХ з компенсуючим шлейфом. Даний ЧЗДПХ
представляє собою прямокутний хвилевод роз-
мірами 𝑎 × 𝑏, в якому розташована діелектрична
пластина розмірами 𝑐 × 𝑑, що не торкається стінок
хвилеводу і має відносну діелектричну проникність
𝜀𝑟. У діелектричну пластину включена ВНС тих же
геометричних розмірів. Хвилевод 1 представляє со-
бою ЧЗДПХ, хвилевод 2 – ЧЗДПХ з ВНС, хвилевод
3 – порожнистий прямокутний хвилевод.
Рисунок 1.
Управління ВНС здійснюється через подов-
жню щілину в широкій стінці ЧЗДПХ, яка є неви-
промінюючою. Величина опору ВНС складає оди-
ниці Ом при наявності керуючої напруги і тисячі
Ом при її відсутності. Для компенсації ємності
ВНС, яка повинна бути як найменшою, вклю-
чається компенсуючий індуктивний шлейф у ви-
гляді відрізка порожнистого прямокутного хвиле-
вода зі сторони вузької стінки основного хвиле-
вода. Таке включення представляє собою H-
з’єднання хвилеводів.
На рис.2 представлена еквівалентна схема
плоско-поперечного стику ЧЗДПХ з ВНС, плоско
поперечного стику ВНС з ЧЗДПХ і паралельно
включеного компенсуючого шлейфа. На рис. 2 по-
казана нормована реактивна провідність 𝑗𝑏𝑐
плоско-поперечного стику ЧЗДПХ з ВНС та ВНС з
ЧЗДПХ, коефіцієнти трансформації 𝑁0 по основній
хвилі та нормована реактивна провідність −𝑗𝑏𝐿
компенсуючого індуктивного шлейфу.
Рисунок 2.](https://image.slidesharecdn.com/4axkfdo5rhmoyfvz6nh1-signature-e616dfddf0f780ceeda51d3bfa80bfe9124d0eec8e413093eaaa458e2a67433f-poli-210404190825/85/The-scientific-heritage-VOL-1-No-60-2021-50-320.jpg)
![The scientific heritage No 60 (2021) 51
«Згорнувши» схему, показану на рис.2 через
перерахунок коефіцієнтів трансформації 𝑁0, отри-
маємо еквівалентну схему з паралельною нормова-
ною провідністю 𝑗𝑏Σ і нормованою реактивною
провідністю −𝑗𝑏𝐿 компенсуючого індуктивного
шлейфу (рис.3).
Рисунок 3.
Розрахунок нормованих реактивних провідно-
стей проводився за наступними формулами:
𝑏𝑐 =
1
𝑁0
2 ∑ 𝑁𝑘
2
∞
𝑘=1
𝑦𝑘 ,
𝑏Σ =
2𝑏𝑐
𝑁0
2
𝑦0
,
𝑁0 = ∫𝑆
ℰ̅ℎ10
ℰ̅𝐻𝑑𝑆,
𝑁𝑘 = ∫𝑆
ℰ̅ℎ10
ℰ̅𝑘𝑑𝑆,
ℰ̅ℎ10
= √128/𝑎𝑏(64 + 𝑞2 + 𝑝2 + 𝑞2𝑝2)
1
𝜘ℎ10
∗ ℱ ,
ℱ = {[(
𝜋
𝑎
) 𝑠𝑖𝑛
𝜋𝑥
𝑎
− (
𝑝𝜋
2𝑎
) ∗ 𝑠𝑖𝑛
𝜋𝑥
𝑎
𝑐𝑜𝑠
2𝜋𝑦
𝑏
− (
3𝑞𝜋
𝑏𝑎
) 𝑠𝑖𝑛
3𝜋𝑥
𝑎
∗ 𝑠𝑖𝑛
𝜋𝑥
𝑎
𝑐𝑜𝑠
2𝜋𝑦
𝑏
−
− (
3𝑞𝜋
𝑏𝑎
) 𝑠𝑖𝑛
3𝜋𝑥
𝑎
+ (
3𝑞𝑝𝜋
16𝑎
) 𝑠𝑖𝑛
3𝜋𝑥
𝑎
𝑐𝑜𝑠
2𝜋𝑦
𝑏
] 𝑦
̅0
+
+ [(
𝑝𝜋
𝑏
) 𝑐𝑜𝑠
𝜋𝑥
𝑎
𝑠𝑖𝑛
2𝜋𝑦
𝑏
− (
2𝑞𝑝𝜋
8𝑏
)𝑐𝑜𝑠
3𝜋𝑥
𝑎
𝑠𝑖𝑛
2𝜋𝑦
𝑏
] 𝑥̅0} ,
ℰ̅𝐻 = √128/𝑎𝑏(64 + 𝑞2 + 𝑝2 + 𝑞2𝑝2)
1
𝜘
̂𝐻
∗ ℱ,
𝜘
̂𝐻
2
= 𝑘0
2
(𝜀еф(1 + αℰ̅10
2 )) − 𝛾2
2
,
де ℰ̅𝑘 – поперечна електрична власна векторна
функція вищих типів хвиль ЧЗДПХ [2]; ℰ̅10 - попе-
речна електрична власна векторна функція порож-
нистого прямокутного хвилевода [2]; 𝑘0, 𝛾2 – хви-
льове число порожнистого прямокутного хвиле-
вода та поздовжнє хвильове число ЧЗДПХ
відповідно [2]; 𝜀еф – ефективна діелектрична про-
никність [2]; 𝑦0, 𝑦𝑘 – нормована провідність основ-
ної хвилі та нормована провідність вищих типів
хвиль ЧЗДПХ відповідно [2].
Відмітимо, що діелектрична пластина на
відміну від ВНС, яка є ізотропним нелінійним
діелектриком з 𝜀д, являється ізотропним лінійним
діелектриком з 𝜀𝑟. Навіть при проходженні струму
через ВНС нелінійний процес буде протікати у
слабкому електромагнітному полі. Тому, залеж-
ність електричної індукції від електричної напру-
женості буде лінійною на робочому інтервалі змін
величини електричної напруженості. У
відповідності до роботи [3] це являється локальною
лініарізацією вище вказаної залежності. Врахову-
ючи, що електромагнітне поле буде слабо змінюва-
тися і в локальній порожнистій області ЧЗДПХ, що
знаходиться в безпосередній близькості ВНС
(ℒ<<Λℎ10
, де ℒ - максимальний розмір ВНС, Λℎ10
–
довжина основної хвилі ЧЗДПХ), то маємо наступ-
ний вираз для відносної електричної проникності
ВНС:
𝜀д = (1 + αℰ̅10
2 ),
де α – коефіцієнт нелінійності, що залежить від
матеріалу ВНС [3].
Коефіцієнт передачі Т11 для схеми рис.3 має
наступний вигляд:
Т11 = 1 +
1
2
[𝑗𝑏Σ∆𝑓 − 𝑗𝑏𝐿𝑐𝑡𝑔(𝜃∆𝑓)],
де 𝑏Σ, 𝑏𝐿 – нормовані реактивні провідності
ЧЗДПХ з ВНС і індуктивного шлейфу відповідно,
∆𝑓 = 𝑓/𝑓о – частотний діапазон, 𝜃 – електрична до-
вжина індуктивного шлейфа. На резонансній ча-
стоті Т11 = 1, тоді маємо:
𝜃 = 𝑎𝑟𝑐𝑐𝑡𝑔
𝑏Σ
𝑏𝐿
.
На рис.4 побудована залежність величини 𝜃
від величини 𝑏𝐿 при фіксованих 𝑏Σ: крива 1 побудо-
вана при 𝑏Σ = 0,5, крива 2 – при 𝑏Σ = 1. Ці графіки
можна використовувати при розрахунках переми-
качів в режимах пропускання (знеструмленій ВНС).](https://image.slidesharecdn.com/4axkfdo5rhmoyfvz6nh1-signature-e616dfddf0f780ceeda51d3bfa80bfe9124d0eec8e413093eaaa458e2a67433f-poli-210404190825/85/The-scientific-heritage-VOL-1-No-60-2021-51-320.jpg)
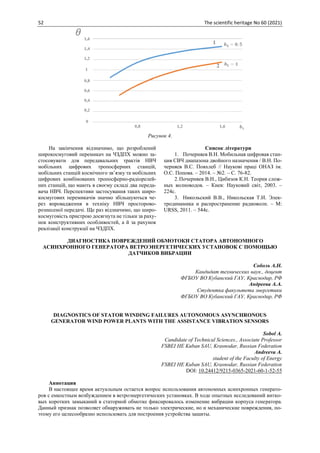
![The scientific heritage No 60 (2021) 53
Abstract
Currently, the issue of using autonomous asynchronous generators with capacitive excitation in wind power
plants remains relevant. In the course of experimental studies of turn short circuits in the stator winding, a change
in the vibration of the generator case was recorded. This feature allows you to detect not only electrical, but also
mechanical damage, so it is advisable to use it to build a protection device.
Ключевые слова: автономный асинхронный генератор, ветроэнергетическая установка, датчик виб-
рации, повреждение, обмотка статора.
Keywords: autonomous induction generator, a wind power plant, a vibration sensor, damage to the stator
winding.
Ветроэнергетика за последние несколько деся-
тилетий выделилась в ряде стран в отдельные от-
расли энергетических хозяйств, успешно конкури-
рующих с традиционной энергетикой. Основное
внимание уделяется ветроэнергетическим установ-
кам (ВЭУ) средней и большой мощности в составе
сетей распределения и передачи электроэнергии. В
связи с этим актуальной научно-технической зада-
чей является эффективное использование ветро-
вого потенциала, которая заключается не только в
улучшении аэродинамических характеристик ВЭУ,
но и в увеличении производительности ВЭУ в це-
лом, а также в повышении надежности.
Генератор – главный элемент электрооборудо-
вания автономной ветроэнергетической установки
[2]. Благодаря простоте конструкции, надежности и
не высокой стоимости по сей день актуальным
остается использование в ветроустановках авто-
номных асинхронных генераторов (ААГ).
Асинхронные генераторы также подвержены
различным техническим недостаткам как, напри-
мер, нестабильностью напряжения. Кроме того, как
отмечено в [6], существует еще одна возможная
техническая проблема эксплуатации данного вида
генераторов, связанная с возможными повреждени-
ями в его обмотках. Так, в короткозамкнутой об-
мотке ротора возможно наличие поврежденных
стержней. Данный вид повреждения называется об-
рывом стержня и может возникать из-за различных
причин, например, из-за перегрева генератора.
В обмотке же статора, что описано в [3], также
возможно возникновение различных повреждений.
Исходя из информации в [4], среди данных неис-
правностей самыми распространенными являются
замкнутые на коротко витки обмотки. Имея неболь-
шое их количество (не более 5 %), генератор про-
должает свою работу. При этом наблюдается пере-
грев обмоток, что может послужить причиной вы-
хода из строя электрической машины, возникнове-
ния возгорания и, на конец, нарушения системы
электроснабжения в целом. Это все обуславливает
необходимость диагностирования данных видов
неисправностей, то есть получения соответствую-
щей информации об изменении токов и напряже-
ний генератора. Зная соответствующую информа-
цию, можно диагностировать данный вид наруше-
ния нормальной работы генератора на ранней
стадии и, соответственно, вовремя устранить кон-
кретную неисправность. Кроме того, этот момент
приобретает особую важность в свете того, что при
выходе из строя электроустановки с генератором,
мы получаем соответствующий технологический
ущерб [5].
Для получения информационных признаков
повреждения обмотки статора генератора, а именно
витковых коротких замыканий (КЗ) была прове-
дена серия опытов. Для моделирования различных
видов коротких замыканий внутри обмотки статора
генератора была создана установка, в которой в ка-
честве объекта исследования использовался асин-
хронный генератор, выполненный на базе асин-
хронного электродвигателя с короткозамкнутым
ротором типа 4A100S4У3 (3 кВт, 1435 об/мин, но-
минальным током 6,7 А, коэффициентом мощно-
сти, равным 0,65, количеством витков в фазе 210)
[1]. Для имитации витковых коротких замыканий
из корпуса генератора наружу были выведены от-
пайки от обмотки статора. С помощью датчиков
вибрации, установленных на корпусе генератора,
фиксировалось изменение сигнала при появлении
короткозамкнутых витков.](https://image.slidesharecdn.com/4axkfdo5rhmoyfvz6nh1-signature-e616dfddf0f780ceeda51d3bfa80bfe9124d0eec8e413093eaaa458e2a67433f-poli-210404190825/85/The-scientific-heritage-VOL-1-No-60-2021-53-320.jpg)
![54 The scientific heritage No 60 (2021)
Рисунок 1 – Характер изменения вибрации
Было установлено, что при витковых замыка-
ниях в короткозамкнутой части обмотки циркули-
рует ток в 5-7 раз превышающий номинальный.
Наибольшего значения то КЗ достигает при замы-
кании небольшого числа витков (3 %) и уменьша-
ется по мере его увеличения.
По мере увеличения числа КЗ витков происхо-
дит увеличение вибрации (рисунок 1). Так при 15%
КЗ витков амплитуда вибрации увеличивается в 4,5
раза, а при 30 % КЗ витков в 8,5 раза. При этом при
1 – 3 % замкнутых витков также не происходит за-
метного ее изменения [1].
Также в случае КЗ в статорной обмотке гармо-
нические составляющие сигнала вибродатчика уве-
личиваются в 4 – 8 раз (в области 600 – 1500 Гц).
Спектр сигнала показан на рисунке 2. По оси абс-
цисс указана частота тока в Гц, а по оси ординат
указана шкала в относительных единицах К:
К =
𝐼ф𝜈=𝑛
𝐼ф𝜈=1
,
где 𝐼ф𝜈=𝑛 – величина тока n-й гармоники;
𝐼ф𝜈=1 – величина тока 1-й гармоники, соответ-
ствующая нормальной работе ААГ при номиналь-
ных параметрах.
Рисунок 2 – Спектр сигнала вибродатчика
Аналогичные процессы происходят при об-
рыве фаз ААГ и емкостей самовозбуждения. При
малом числе КЗ витков изменение гармоник не зна-
чительно (1 – 4 %). Данный признак позволяет об-
наруживать не только электрические, но и механи-
ческие повреждения, поэтому его целесообразно
использовать для построения устройства защиты
ААГ [6, 7, 8].
Список литературы
1. Богдан А.В. Диагностика повреждений об-
мотки статора автономного асинхронного генера-
тора [Текст]. / А.В. Богдан, А.Н. Соболь // Известия
вузов. Электромеханика. - Новочеркасск: ЮРГПУ
(НПИ) имени М.И. Платова, 2013. – № 1. - С. 70-71.
2. Богдан А.В. Измерение сопротивления нуле-
вой последовательности силового трансформатора
Y/YH-12 [Текст]. / А.В. Богдан, А.Н. Соболь, В.А.
Богдан // Сельский механизатор, – М.: ООО
«Нива», 2018. - № 11. - С. 40 – 41.
3. Богдан А.В. Информационные признаки по-
вреждения обмотки статора для построения релей-
ной защиты автономного асинхронного генератора
[Текст]. / А.В. Богдан, А.Н. Соболь // Известия ву-
зов. Электромеханика. - Новочеркасск: ЮРГПУ
(НПИ) имени М.И. Платова, 2017. – № 6. - С. 72-76.
4. Богдан А.В. Математическая модель само-
возбуждения автономного асинхронного генера-
тора [Текст]. / А.В. Богдан, А.Н. Соболь // Труды](https://image.slidesharecdn.com/4axkfdo5rhmoyfvz6nh1-signature-e616dfddf0f780ceeda51d3bfa80bfe9124d0eec8e413093eaaa458e2a67433f-poli-210404190825/85/The-scientific-heritage-VOL-1-No-60-2021-54-320.jpg)
![The scientific heritage No 60 (2021) 55
Кубанского государственного аграрного универси-
тета. - Краснодар: КубГАУ, 2012. – № 36. - С. 322-
324.
5. Богдан А.В. Обнаружение виткового замы-
кания в обмотке статора асинхронного генератора
[Текст]. / А.В. Богдан, А.Н. Соболь, Н.С. Баракин //
Сельский механизатор – М.: ООО «Нива», 2018. –
№ 7-8. - С. 44 – 45.
6. Пат. 66127 U1 Российская Федерация, МПК
H 02 K 11 00, H 02 H 7 08. Устройство для диффе-
ренциальной защиты асинхронного генера-
тора[Текст]. / Соболь А. Н.; заявитель и патентооб-
ладатель Федеральное государственное бюджетное
образовательное учреждение высшего образования
«Кубанский государственный аграрный универси-
тет. - № 2006147115/22; заявл. 27.12.06; опубл.
27.08.07, Бюл. № 24. – 4 с.
7. Пат. 2313890 Российская Федерация, МПК
51 H02М 7/08, H02H 3/28. Устройство для Устрой-
ство для дифференциально-фазной защиты [Текст].
/ Богдан А.В., Соболь А. Н.; заявитель и патентооб-
ладатель Федеральное государственное бюджетное
образовательное учреждение высшего образования
«Кубанский государственный аграрный универси-
тет. - № 2006124282; заявл. 06.07.2006; опубл.
27.12.2007, Бюл. № 36. – 5 с.
8. Пат. 2295815 Российская Федерация, МПК
51 H02H 7/08, G01M 15/00, H02K 15/00. Устройство
защиты машин переменного тока [Текст]. / Богдан
А.В., Стрижков И.Г., Потапенко И.А., Соболь А.Н.;
заявитель и патентообладатель Федеральное госу-
дарственное бюджетное образовательное учрежде-
ние высшего образования «Кубанский государ-
ственный аграрный университет. - № 2005131150;
заявл. 07.10.2005; опубл. 20.03.2007, Бюл. № 8. – 4
с.
АНАЛІЗ ЗАСТОСУВАННЯ ГІС В УПРАВЛІННІ ТРАНСПОРТНИМИ СИСТЕМАМИ
Суворова Н.О.
старший викладач Факультету транспорту, менеджменту і логістики
Україна, Національний авіаційний університет
ANALYSIS OF GIS APPLICATION IN TRANSPORT SYSTEMS MANAGEMENT
Suvorova N.
Senior Lecturer Faculty of Transport, management and logistics
Ukraine, National aviation university
DOI: 10.24412/9215-0365-2021-60-1-55-60
Анотація
В статті розглянуто особливості застосування геоінформаційних систем (ГІС). Визначені основні тра-
нспортні завдання, які можуть ефективно вирішуватися за допомогою ГІС. Сформульовані базові прин-
ципи ГІС технологій на транспорті. Обґрунтовано питання необхідності застосування ГІС в процесах
прийняття рішень при управлінні об’єктами транспортної системи.
Abstract
The article considers the peculiarities of the application of geographic information systems (GIS). The main
transport tasks that can be effectively solved with the help of GIS are identified. The basic principles of GIS
technologies in transport are formulated. The question of the need to use GIS in decision-making processes in the
management of transport system facilities is substantiated.
Ключові слова: геоінформаційні системи, транспортні системи, транспортне підприємство, управ-
ління, ефективність.
Keywords: geographic information systems, transport systems, transport company, management, efficiency.
Геоінформаційні системи (ГІС) довгий час
було прийнято вважати системами, які призначені,
перш за все, для створення і публікації карт. Відпо-
відно до цього було визначено коло прикладних за-
вдань: зонування і картографування територій, гео-
логічні дослідження, пов’язані з видобутком кори-
сних копалин, тощо. Ситуація на ринку ГІС
технологій почала стрімко змінюватися в дев’яно-
сті роки минулого сторіччя, коли ринок усвідомив,
що велика частина зовні різнорідних даних та інфо-
рмації мають дещо загальне, а саме – географічну
прив’язку, отже можуть бути відображені на мапі
для подальшої обробки, аналізу та використання в
багатьох прикладних системах.
Просторова складова стала свого роду «спіль-
ним знаменником» для роботи з інформацією, в той
час як ГІС – це системи, які допомагають співвідне-
сти ті або інші процеси і події на основі просторово-
часових відносин і з урахуванням додаткових фак-
торів (фінансових, соціально-економічних, природ-
них та інші).
Для реалізації цього підходу на практиці роз-
робники почали розширювати можливості ГІС, до-
даючи нові функції, які вирішують не тільки класи-
чні задачі створення карт, а виконують просторо-
вий аналіз, що забезпечують різні способи
візуалізації та інтеграцію з корпоративними систе-](https://image.slidesharecdn.com/4axkfdo5rhmoyfvz6nh1-signature-e616dfddf0f780ceeda51d3bfa80bfe9124d0eec8e413093eaaa458e2a67433f-poli-210404190825/85/The-scientific-heritage-VOL-1-No-60-2021-55-320.jpg)
![56 The scientific heritage No 60 (2021)
мами. Це відкрило зовсім нові підходи до застосу-
вання ГІС для управління активами транспортних
підприємств.
На сьогоднішній день ГІС може розглядатися
як платформа, яка об’єднує різні процеси: проекту-
вання, управління майном термінальних комплек-
сів, диспетчеризацію, управління парком транспор-
тних засобів, побудова та оптимізація маршрутів,
навігація, інформаційні послуги населенню, роботу
з клієнтами та інше.
Технологія ГІС має широкі можливості щодо
інтеграції і сумісному аналізу різнорідних даних та
є незамінним інструментом для вирішення задач
управління корпоративними об’єктами. Геоінфор-
маційні системи та технології застосовуються при
автоматизації обробки інформації про об’єкти
будь-якого походження: штучні чи природні, моні-
торинг, опис, аналіз, моделювання стану яких і
прийняття управлінських рішень щодо поліпшення
їх характеристик є неповним без просторового ана-
лізу [3].
Серед широкого спектру потенційних додат-
ків, для яких можна використовувати ГІС техноло-
гії, велика увага на сьогоднішній день приділяється
питанням транспортної системи, оскільки її об’єкти
суттєво залежать від методів візуалізації та аналізу.
Економічна ситуація підприємств транспорт-
ного комплексу України, показала, що ефективна
діяльність і розвиток ринку перевезень неможливі
без модернізації виробництва та впровадження но-
вих технологій в даній галузі, переважно, в області
організації руху, управління парком транспортних
засобів, управління пасажиропотоком і вантажопо-
током, підвищення якості обслуговування пасажи-
рів, реалізації комплексної системи безпеки, своє-
часності доставки товарів та ін.
Близько 80% всієї транспортної інформації мі-
стить геодані, тобто різнорідні відомості про розпо-
ділені в просторі об’єкти, явища і процеси. Просто-
рова складова є природною основою інтеграції за-
вдань управління транспортними системами,
рішення розрахункових завдань щодо оптимізації
процесу перевезень, завдань оперативного управ-
ління, навігації та ін.
Оптимальною платформою для комплексного
вирішення завдань в сфері транспортних систем є
ГІС технології.
Протягом тривалого часу ГІС технології удо-
сконалювалися, що вплинуло на їх основні функції
та властивості. Все це призводило до появи нових
визначень ГІС, що враховують їх нові властивості
та особливості.
Відомими фахівцями в області застосування
ГІС опубліковано декілька десятків визначень да-
них технологій, які в сукупності визначають сталі
характеристики геоінформаційних систем.
Геоінформаційна система (ГІС) – це інформа-
ційна система, призначена для збирання, збері-
гання, оброблення, відображення й поширення да-
них, а також отримання на їхній основі нової інфо-
рмації і знань про просторово координовані об’єкти
і явища [2].
ГІС – це система, яка:
- по-перше, є комплекс взаємодіючих п’яти
компонентів, що складається з комп’ютерних засо-
бів, програмного забезпечення, географічних да-
них, регламенту і користувачів;
- по-друге, виконує функції введення, інтег-
рації, зберігання, обробки, аналізу, моделювання і
візуалізації географічної інформації [4].
Геоінформаційна система (ГІС) – це система
апаратно-програмних засобів і алгоритмічних про-
цедур, що створена для цифрової підтримки, попов-
нення, управління, маніпулювання, аналізу, мате-
матико-картографічного моделювання й образного
відображення географічно координованих даних
[1].
Аналіз вищезазначених визначень дозволяє
стверджувати, що ГІС:
1. Складна багатофункціональна структура.
2. Система обробки даних, яка володіє засо-
бами накопичення, збереження, поновлення, по-
шуку та видачі даних.
3. Здатна опрацьовувати просторову інфор-
мацію.
4. Має у своєму арсеналі специфічні засоби
аналізу й моделювання просторових даних.
ГІС поєднує традиційні операції при роботі з
базами даних – запит і статистичний аналіз – з пе-
ревагами повноцінної візуалізації та просторового
аналізу, які надає карта. Ця особливість дає уніка-
льні можливості для застосування ГІС у розв’язку
широкого спектра задач, пов’язаних з аналізом
явищ і подій, прогнозуванням їх ймовірних наслід-
ків, плануванні стратегічних рішень [1].
Особлива відмінність ГІС технологій від ін-
ших інформаційних систем полягає в наступному:
1. Інформація має просторову прив’язку.
2. Можливість керування величезними
об’ємами даних.
3. Розвинений інструментарій для введення,
збереження, аналізу і моделювання просторових
даних.
4. ГІС є інструментом підтримки прийняття
рішень.
В даний час ГІС, надаючи можливість візуалі-
зації просторово-часових даних з використанням
графіки, дозволяють застосовувати широкий
спектр досить ефективних методів планування і уп-
равління в сфері транспортних технологій. Ство-
рені електронні комп’ютерні карти включають тра-
нспортну мережу регіонів, областей і здатні з висо-
кою точністю відображати в динаміці
розташування і переміщення транспортних засобів,
вантажопотоків і пасажиропотоків.
Геоінформаційні системи для вирішення за-
вдань транспорту включають в себе: взаємо-
пов’язані апаратні засоби, програмне забезпечення,
дані, людські ресурси, організації та транспортні
підприємства, механізми для збору, зберігання,
аналізу і передачі певних типів інформації.
Якщо ми говоримо про застосування ГІС в тра-
нспортних системах, то до певних типів інформації
відносяться:
1. Інформація про транспортну систему.](https://image.slidesharecdn.com/4axkfdo5rhmoyfvz6nh1-signature-e616dfddf0f780ceeda51d3bfa80bfe9124d0eec8e413093eaaa458e2a67433f-poli-210404190825/85/The-scientific-heritage-VOL-1-No-60-2021-56-320.jpg)

![60 The scientific heritage No 60 (2021)
Рис. 2. Базові принципи ГІС на транспорті
Крім цього, ГІС при застосування в транспорт-
них системах повинні мати здатність працювати з
традиційними просторовими вимірами, а також
включати параметри часу і фінансів.
Тільки у разі підтримки всіх перерахованих
принципів дозволить зробити застосування ГІС
ефективними для управління транспортною систе-
мою на всіх етапах її життєвого циклу.
На сьогоднішній день напрацьовано велику кі-
лькість стандартів та моделей даних, що дозволя-
ють досить швидко, розгорнути ГІС для управління
транспортною системою міста, регіону або системи
в цілому.
Розглянуті та проаналізовані в даній статті осо-
бливості і принципи застосування геоінформацій-
них систем підтверджують той факт, що ГІС – це
інструмент прийняття рішень для будь-якого біз-
несу або галузі, оскільки вони дозволяють збирати,
зберігати, аналізувати та управляти екологічними,
демографічними і топографічними даними.
Застосування ГІС технологій у транспортній
сфері допоможе істотно підвищити ефективність,
забезпечити більший обсяг перевезень пасажирів і
вантажів, зробити транспортну систему в цілому
більш безпечною.
Основні переваги застосування ГІС технологій
в транспортній системі полягають в наступному:
1. Підвищує ефективність роботи як невели-
ких підприємств, так і найбільших об’єктів транс-
портної системи.
2. ГІС – є критично важливим компонентом
діяльності транспортного підприємства і може ви-
користовуватися практично у всіх виробничих та
управлінських процесах.
3. Робота з просторовою інформацією допо-
магає отримати нове знання, виявити приховані
причини тих чи інших явищ і подій, моделювати і
прогнозувати транспортні процеси і швидко прий-
мати правильні управлінські рішення на всіх рів-
нях.
Список літератури
1. Геоінформаційні системи і бази даних: мо-
нографія / В. І. Зацерковний, В. Г. Бурачек, О. О.
Железняк, А. О. Терещенко. – Ніжин: НДУ ім. М.
Гоголя, 2014. – 492 с.
2. Геоінформаційні системи на транспорті:
навч. посібник / К. В. Доля, О. Є. Доля; Харків. нац.
ун-т міськ. госп-ва ім. О. М. Бекетова. – Харків:
ХНУМГ ім. О. М. Бекетова, 2018. – 230 с.
3. Методи та моделі розроблення комп’ютер-
них систем і мереж. Монографія / [В.С. Пономаре-
нко, С.В. Мінухін, С.В. Кавун, та ін.]; Заг. редакція
докт. екон. наук, професора Пономаренко В.С. –
Харків: Вид. ХНЕУ, 2008. – 316 с.
4. Основні принципи геоінформаційних сис-
тем: навч. посібник /В. Д. Шипулін; Харк. нац. акад.
міськ. госп-ва. – Х.: ХНАМГ, 2010. – 313 с.
•можливість застосування для вирішення завдань на всіх видах
транспорту
Універсальність
•здатність автоматизувати управлінські процеси
•здатність забезпечувати підтримку прийняття найкращих управлінських
рішень
Інтелектуальність
•можливість використання єдиної ГІС для різних категорій користувачів
в рамках своїх повноважень
Доступність
•відповідність регламентуючим документам, як національним, так і
міжнародним
Відповідність
документам
•взаємодія ГІС технологій з іншими інформаційними та інженерними
системами
Інтегрованість](https://image.slidesharecdn.com/4axkfdo5rhmoyfvz6nh1-signature-e616dfddf0f780ceeda51d3bfa80bfe9124d0eec8e413093eaaa458e2a67433f-poli-210404190825/85/The-scientific-heritage-VOL-1-No-60-2021-60-320.jpg)
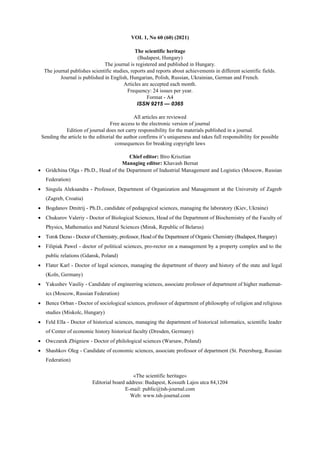

This document summarizes a study on hydrogen production from cellulosic materials using natural microbial associations. The researchers isolated natural associations from soil and lake sediment and found that the soil association was most effective, dominated by Clostridium and Bacillus genera. Enriching this association with a 1:2.5 ratio of Clostridium to Bacillus microorganisms increased hydrogen yield by 48% and hydrogen content in the biogas to 87.5%. Using agricultural waste as the substrate and enriching with dominant microorganisms reduced processing time.


![ANIMAL_CELL_,_TISSUE_AND_ORGAN_CULTURE[1].pptx](https://cdn.slidesharecdn.com/ss_thumbnails/animalcelltissueandorganculture1-260204172026-4462b440-thumbnail.jpg?width=640&height=640&fit=bounds)


![Polymer [ बहुलक ] Chemistry Notes PDF - Irfanullah Mehar - JJ Sir Chemistry.pdf](https://cdn.slidesharecdn.com/ss_thumbnails/polymerchemistrynotespdf-irfanullahmehar-jjsirchemistry-260210172118-3f9b37f7-thumbnail.jpg?width=640&height=640&fit=bounds)