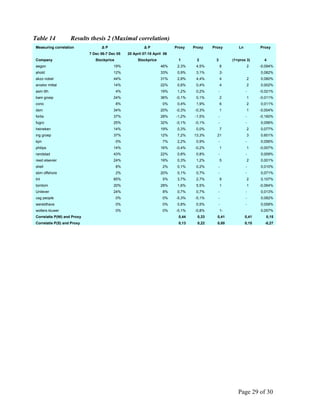
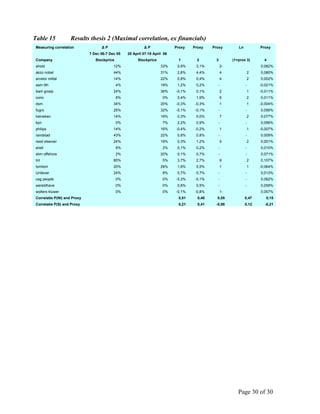
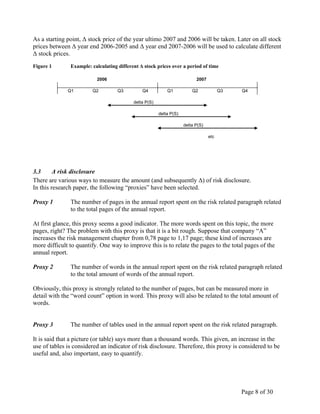
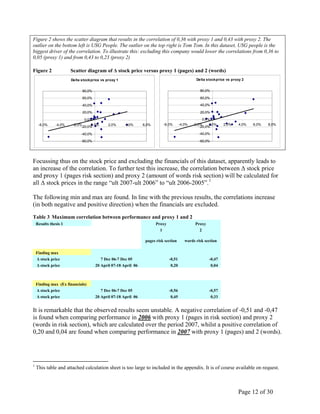
This document outlines the methodology used to analyze the relationship between company performance and risk disclosure in annual reports. Performance is measured as the change in net income and stock price. Risk disclosure is measured using proxies like number of pages/words about risk and number of times "risk" is mentioned. The study examines 24 Dutch AEX companies' annual reports from 2006-2007. It tests if 1) change in performance correlates with change in risk disclosure and 2) stability of performance correlates with risk disclosure. Multiple steps are taken, including calculating correlations both with and without financial companies.
![Page 7 of 30
3 Methodology
3.1 Mathematical expression of the hypotheses
As presented in the introduction, the mathematical expressions of the hypotheses are as follows:
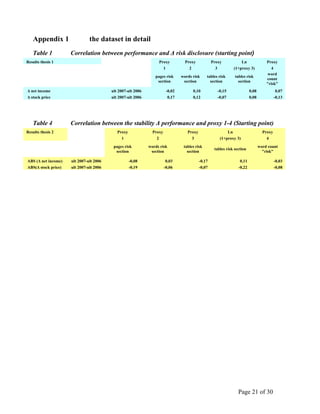
1 Δ performance company (P) is correlated with Δ risk disclosure (I)
2 ABS(Δ performance company (P)) is correlated with Δ risk disclosure (I)
Or in short:
Thesis 1 Δ P is correlated with ∆ I
Thesis 2 │Δ P│is correlated with ∆ I
3.2 Δ performance
Δ performance will be measured in two ways. At first an “objective” approach will be used by
using accounting figures. In this case the relative Δ of published net income will be used.
The second approach will take a more “subjective” approach: the performance will be measured by
calculating the relative Δ of the stock price during a time interval of a year.
In summary:
• Δ net income: [net income 2007- net income 2006]/ [net income 2006]
• Δ stock price: [stock price(t) – stock price (t-1y)]/[stock price (t-1y)]
Example calculating Δ net income
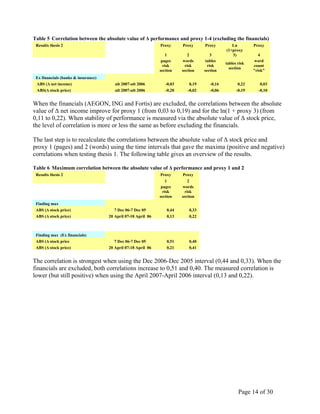
For example: in the annual report of 2007, AEGON reported a decrease in net income of (2251
-3169)/3169= 19,5%. For some companies, the net income was not published. In this case net
profit or EBITA (earnings before interest and tax) were used.
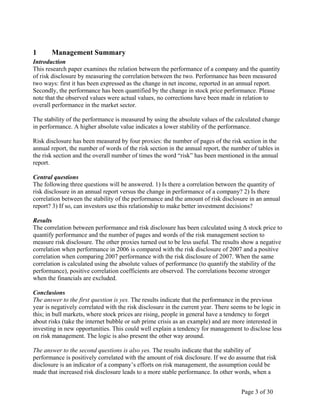
Example calculating Δ stock price
For AEGON the following stock prices where found:
The resulting Δ stock price is (12,09-14,44)/14,44=-16%
2006 2007
AEGON 14,44 12,09](https://image.slidesharecdn.com/70a023fe-0cf2-4551-a07b-f53abb0b48ed-150321144859-conversion-gate01/85/The-performance-of-information-7-320.jpg)
![Page 13 of 30
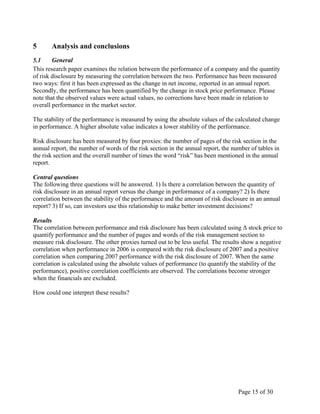
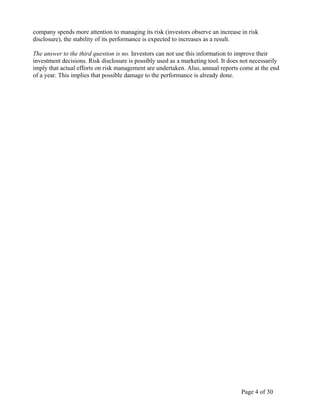
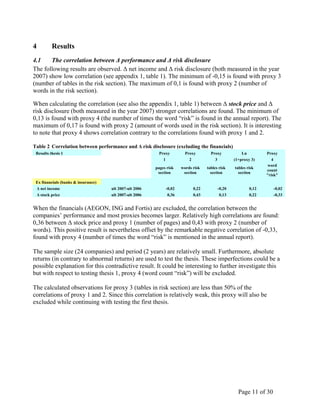
Again, when excluding the financials, all correlations increase in both positive and negative
direction). The following graph shows all the calculated correlations between Δ stock price and
proxy 1 (pages) and proxy 2 (words). Please note that the graph shows the correlations where the
financials are included. Without them, the graph looks more or less the same, except that the peaks
are slightly higher.
Figure 3 Correlation between a range of Δ stock prices and proxy 1 and 2
-0,60
-0,50
-0,40
-0,30
-0,20
-0,10
0,00
0,10
0,20
0,30
2-jan-062-m
rt-062-m
ei-062-jul-06
2-sep-062-nov-062-jan-072-m
rt-072-m
ei-072-jul-07
2-sep-072-nov-07
[stock price(t) – stock price (t-1y)]/[stock price (t-1y)]
Correlation
proxy 1 (number of pages of risk section) proxy 2 (amount of words risk section)
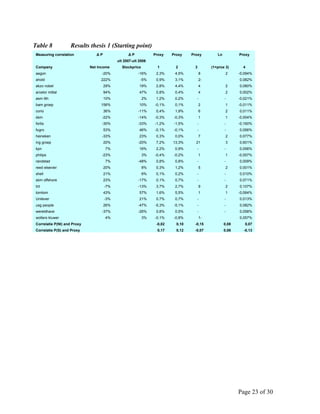
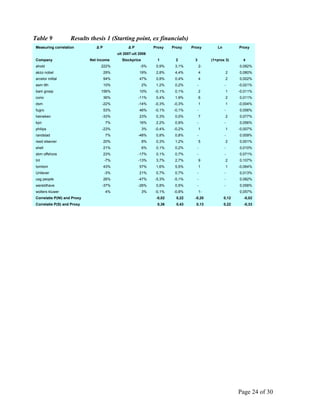
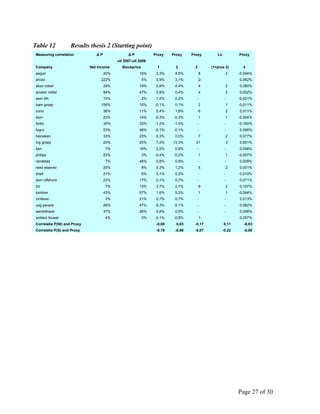
4.2 The correlation between the stability of Δ performance and Δ risk disclosure
To test the second thesis, the stability of the performance is first expressed as the absolute value2
of Δ net income. Secondly, the absolute value of Δ stock price performance is used to quantify the
stability of performance. As in the previous section, we first calculate the correlations using the
year end data (starting point). An overview of the results can be found in the appendix (table 4).
With respect to using the absolute value of Δ net income: the maximum (negative) correlation of
-0,17 is found with the proxy 3 (number of tables in the risk section). At the same time, the
maximum positive correlation of 0,11 is found with the ln(1+proxy 3).
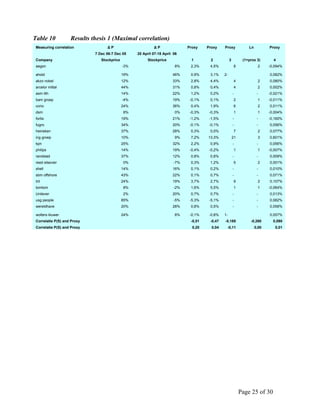
When using the absolute vale of Δ stock price to measure the stability of performance, the results
are somewhat better. Maximum (negative) correlation of -0,22 is found with ln(1+proxy 3) (tables
in risk section) and -0,19 with proxy 1 (pages in risk section).
2
In tables depicted as: ABS(Δ net income) or ABS(Δ stockprice)](https://image.slidesharecdn.com/70a023fe-0cf2-4551-a07b-f53abb0b48ed-150321144859-conversion-gate01/85/The-performance-of-information-13-320.jpg)