2. Project Abstract
Stevens Institute of Technology is a 38‐acre urban campus located on the east edge of
Hoboken, NJ, bordered by the Hudson River. Flooding and combined sewer overflow is a
primary concern for both Hoboken and campus. Campus contribution of annual runoff to the
overburdened Hoboken urban water system exceeds 20 MG. Sustainable stormwater
management practices are proposed to reduce runoff and stress on the system.
The RainWorks Team accepted the 2015 Environmental Protection Agency’s (EPA) Campus
Rainworks Challenge to create the first stormwater management plan for the Stevens’ campus:
“The Living Laboratory”. The Team proposes 29 green infrastructure techniques, which have
been applied to problem areas to reduce runoff, contaminant discharge and potable water
usage. The Living Laboratory provides a practical example for urban campus green
infrastructure and introduces classroom and community educational opportunities. The Team
worked with Stevens Facilities and Events Management to ensure the proposed design is
aligned with future growth of campus, can be maintained, is aesthetically pleasing and
economically responsible.
The Living Laboratory was modeled using the EPA’s Storm Water Management Model to
quantify runoff volume and peak flow reduction. WinSLAMM (Source Loading and Management
Model) was used to model pollutant loading. Model results indicate through implementation of
the Living Laboratory, campus runoff will be reduced by 20% when modeled for the NJ water
quality design storm. Primary pollutant reduction will be approximately 24%. Economic impact
of The Living Laboratory will result in financial gains to the institution with a payback period of
23 years.
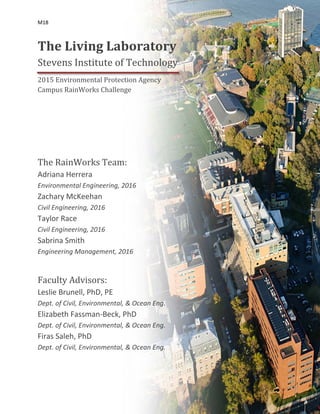
Figure 1: Campus Aerial View
3. Project Context 1
Scope & Resources
The RainWorks Team (Team) members accepted the Environmental Protection Agency’s (EPA)
Campus RainWorks Challenge to create Stevens Institute of Technology’s (Stevens) first
Stormwater Management Master Plan: The Living Laboratory (Project or Living Laboratory). The
Team undertook the challenge as their senior engineering design project, conducted from
September to December 2015. The project will continue with the next phase during the spring
2016 semester, January to April. The Team hopes to create a culture in which green
infrastructure (GI) is accepted and sought after to establish Stevens as a leader in urban campus
GI implementation.
The Project is defined in five phases: initiation, planning, design, execution, and closing.
1. Initiation Phase (September 2015)
Establish the design team and advisors. Define the project purpose and scope. Raise awareness
for a GI approach by researching existing water management problems at Stevens.
2. Planning Phase (October 2015)
Collect data. In previous years, Stevens students collected data on campus drainage delineation
and soil infiltration. The Team used this data to o determine campus runoff using the EPA’s
Stormwater Management Model (SWMM). The Living Laboratory approach focuses on resilient
and efficient designs that are aesthetically pleasing and cost‐effective. Stakeholder engagement
informed the Team of campus space usage. Integration of stakeholder engagement and
education to assist in awareness and support of GI was essential for the planned
implementation.
3. Design Phase (November 2015 ‐ December 2015)
Modeling of the Stevens campus was performed using SWMM for both existing conditions and
the proposed Living Laboratory. Model outputs were used to determine peak flow rate
mitigation and runoff volume reduction. The Living Laboratory was also modeled using
WinSLAMM (Source Loading and Management Model) to determine pollutant loading. The New
Jersey Department of Environmental Protection’s (NJDEP) Water Quality Design Storm (WQ
storm), the National Stormwater Quality Database (NSQD), the National Urban Runoff Program
(NURP), the National Climatic Data Center (NCDC), and the International Stormwater Best
Management Practices (BMP) Database were all used in the modeling.
4. Execution Phase (January 2016 ‐ August 2018)
Integrate The Living Laboratory into the proposed ten‐year campus plan. At the end of this
phase, the team aims to have all infrastructure implemented on campus and all planning
concepts adopted by campus management. Through the Living Laboratory demonstration, the
Team hopes additional installations will be proposed to expand the Living Laboratory.
5. Closing Phase (September 2018 ‐ December 2022)
Utilize proposed GI as a hand on learning experience for classes, research, and the Hoboken
community. Evaluate the long term effectiveness and sustainability for future improvements.
The closing phase marks the end of the proposed ten‐year campus plan at which point the
campus will have completed its transformation into a “living laboratory” for education,
research, and future influence of GI practices.
Figure 2: Phase Timeline
4. Proposed Green Infrastructure Master Plan 2
Background
Stevens is a 38‐acre urban campus that houses 45 buildings and five main lawns. The
total impervious area accounts for roughly 60% of campus, resulting in approximately 14 acres
of permeable surfaces. The campus is located on a cliff edge with just over three acres
exhibiting a 30‐55% slope, the result of which is only 11 acres available for infiltration. In‐situ
soil testing yielded an infiltration rate of only 0.57in/hr.
From 1990 to 2015, as recorded at Newark Liberty International Airport, the average
annual rainfall for the Hoboken area was 46‐in, with an average of 121 days (annually) of
measurable precipitation. (“Climate Data Online”) SWMM modeling performed by the Team
indicates annual runoff from the Stevens’ campus of approximately 18.27‐in, or 20.6 MG. The
annual precipitation rates, low infiltrating soils, and a buildup of impervious areas contribute to
the severe runoff and frequent ponding the campus experiences.
Existing Campus Delineation
Stevens is currently delineated into eight major drainage areas, each designated by the
topography and common drainage point. Table 1 and Figure 3 show the drainage areas and
land characteristics.
Existing Campus Drainage Investigation
The Team met with Stevens Facilities in order to present the Team’s objectives, focus,
and scope, as well as to obtain feedback to gain a better understanding of the perceived
drainage problems on campus. Facilities provided drawings of campus infrastructure and the
proposed ten‐year campus plan and concepts.
7 Acres 15 Acres 12 Acres
Hardscape: Streets & Pavement Hardscape: Roof Top Softscape: Lawns & Vegetation
Figure 3: Campus Landscape Zones
Table 1: Pervious and Imperviousness Acres
Figure 4: Campus Drainage Areas
5. 3
The Team conducted campus site walks during rain events for further site analysis.
Major runoff problems were noted in drainage areas 1, 3, 4, 5, and 6. Excessive ponding was
noted in drainage areas 2 and 8. The Team also met with Stevens Events Management to
receive input as to the placement of GI for maximum event benefit. The Team’s investigation
exposed six major problem areas; see Design Board 1: Figure 3, and Table 2.
Problem Area Drainage
Area
Problem Identification Uses
8th
& Hudson St. 1 & 2 Facilities Heavy pedestrian traffic
Morton, Kiddie, Pierce (MPK) Lawn 2 Events Management Campus events ; Student recreational area
5th
& River St. 2 & 3 Rainworks Team Heavy pedestrian traffic; Nearby lawn for campus events
Babbio Patio 8 Students & Faculty Heavy student traffic; Campus police parking
Sinatra Drive 3, 4, 5, & 6 Facilities Heavy pedestrian traffic; Seasonal street fairs
Library Lawn 8 Facilities Campus events; Student recreation area
When working with Facilities, the importance of considering the evolving nature of the
Stevens’ campus became apparent in designing The Living Laboratory. The addition of three
new buildings, the redesign of a parking lot, and the loss of another were considered as near‐
term projects. While these improvements change the land use, there is no change in
impervious coverage. All proposed campus expansions are not yet finalized, thus smaller and
more frequent installations of GI are proposed. Smaller installations ensure the resiliency and
integration of The Living Laboratory within the proposed ten‐year campus plan.
Living Laboratory Strategy Development
Small storms frequently cause flooding and combined sewer overflows (CSO) in
Hoboken. There are five combined sewer outfalls that discharge to the Hudson River. The Team
used the WQ storm as representative of the frequently occurring storm in modeling. The WQ
storm distributes 1.25‐in of rain over a two hour period, which is represented in Fig. 5.
Due to the extent of green space, and relatively low vehicle
traffic, campus pollutant conditions do not measurably
impact water quality and CSO discharge. Rather, the
volume of runoff impacts pollutant loading into the Hudson
River. The Team prioritized volume reduction to reduce CSO
volume discharge. However, water quality was modeled for
each proposed GI in order to show the additional benefits
of the systems. Pollutant reduction in remaining discharge
would assist Hoboken’s municipal wastewater treatment
plant prior to potential CSO. A decrease in pollutants in
water captured will enable repurposing for irrigation.
Despite drainage, flooding, and runoff issues, there is presently no stormwater
management strategy included within the proposed ten‐year campus plan. The focus of the
Table 2: Campus Problem Area Identification
Figure 5: Water Quality Design Storm
6. 4
Team was to include the entirety of campus in a stormwater master plan in order to minimize
peak flow rates and runoff volume. The Team proposes the use of five different GI techniques
to ensure the sustainability and resiliency of The Living Laboratory. Various applications provide
facilities with flexibility in integration, as well as provide a wide range of learning and research
opportunities. Proposed GI applications include: planters, bioretention cells, living roofs,
permeable pavement, and cisterns. Compost amendment is proposed over the extent of
existing campus softscape to increase the infiltration rates.
The Team’s design focused on areas where runoff has the largest negative impact on
campus life. Most problem areas were designed with more than one type of solution, varying in
GI techniques. While each individual application assists in solving a particular problem area, the
combination of applications generates a cohesive plan, creating a solution for the entire
campus. All GI technologies provide an aesthetic appeal and enhance campus beauty. Table 3
provides specific examples of benefits to each of the problem areas.
Problem Area Problem Description GI Application Benefit
8th
& Hudson
St.
High impervious area increases runoff and
causes local lawn flooding leading to
unaesthetic landscape and hazardous walking
conditions.
Planters
Bioretention Cell
Reduce hazardous walking conditions
Morton,
Kiddie, Pierce
(MPK) Lawn
Popular event lawn ruined by low soil
infiltration, roof runoff, and scour at
downspouts.
Planters
Living Roof
Eliminate large downspout scour holes
Create hands‐on learning experience
Decrease lawn drainage to improve campus events
5th
& River St. High impervious area and roof runoff overflow
inlets.
Bioretention Cell Address bare soil spot
Minimize ponding and runoff through busy campus
thoroughfare
Babbio Patio Runoff generated a sink hole at edge of cliff
causing hazardous conditions.
Bioretention Cell
Planters
Fix sinkhole
Reduce risk of sinkhole recurrence
Sinatra Drive Runoff freezes during winter months causing
hazardous conditions.
Permeable
Pavers
Planters
Capture runoff from entire parking area
Reduce runoff from steep slope
Limit hazardous conditions
Library Lawn Popular event lawn ruined by poor soil
conditions.
Permeable
Pavers
Creates permeable stage for campus events
Covers bare soil spots
In addition to the campus improvements made by each system individually, the entire
plan will function as a “living laboratory.” Stevens, popularly known for its wide range of
engineering programs, could use the proposed GI as teaching tools and research projects. The
“Innovation University,” will further benefit from implemented GI for continuous student
research into sustainable uses of GI and benefits to surrounding area.
The Living Laboratory
Twenty‐nine GI applications and compost amendment were proposed as part of the
Living Laboratory. Twenty of the twenty‐nine proposed GI applications directly alleviate stress
at the six problem areas. However, all twenty‐nine systems reduce runoff to an over‐taxed
urban CSO system. The proposed GI locations were identified by examining feasibility of
implementation, maintenance, land availability, and impact to problem areas. See Design
Board 2: Figure 1.
Table 3: Problem Area GI Application
7. 5
SWMM Modeling
The SWMM model was used to examine both existing conditions and the proposed ten‐
year campus plan. Topography and drainage areas were determined using land survey
delineations, utility and infrastructure as‐built drawings and site surveys. In‐situ soil infiltration
testing was used to calibrate a Horton infiltration model across campus. The WQ storm was
used for precipitation input.
GI practices were created using the low impact development control editors and
standard information within the New Jersey BMP Manual. Detailed design for GI systems was
derived from municipal guidance from cities with advanced GI experience, including
Philadelphia, PA; Portland, OR; and Seattle, WA. The use of GI was optimized by testing size and
depth of differing GI techniques to achieve the maximum stormwater capture.
Land availability most prominently governed GI type, design, and location. Campus has
numerous areas ranging from 100‐500 ft2
, each providing no significant stormwater mitigation
benefit. The Living Laboratory will convert these areas into planters and bioretention cells,
directing runoff into the GI practices. Bioretention cells optimize stormwater capture in larger
lawn spaces. Elsewhere, proximity of smaller landscaped areas adjacent to structural
foundations led to the proposal of planters. Planters focus on evapotranspiration (ET) and
detention rather than infiltration. Permeable pavement was proposed for implementation on
the Library Lawn to ensure the continuous utilization of an area frequently used for campus
events and traveled extensively by pedestrians. The permeable pavement serves the dual
purpose of managing stormwater while serving as a permanent stage for campus events.
Limited parking on campus stipulated that the proposed design of a permeable paver parking
lot would maximize parking spaces while allowing infiltration. Campus has close to seven acres
of roof surfaces with opportunities to treat direct rainfall. Living roofs were proposed to assist
in runoff mitigation prior to reaching ground level on three buildings resulting in 0.646 acres
covered. Additionally, cisterns aid in roof runoff reduction by utilizing captured water for
irrigation.
Compost amendment was an integral part of the Living Laboratory. Campus lawns are
defined by urban soil composition. Heavy foot traffic has further compacted the soil to a degree
of inhibiting grass growth and infiltration. Compost amendment was modeled as a 20% increase
to the initial Horton infiltration rate and a 20% decrease to the decay constant. The final Horton
infiltration capacity value was left unchanged in order to govern the final infiltration rate should
a storm event persist.
WinSLAMM Modeling
WinSLAMM is the windows version of an urban stormwater quality model. Modeling is
established via land use type, programing for residential, institutional, industrial, commercial,
and freeway uses. Each land type is further defined by the source area (i.e. roofs, streets,
landscaping areas, etc…). Drainage areas of campus were given their own land type; areas 1, 2,
3, and 8 were defined as institutional and areas 4, 5, 6, and 7 were defined as residential. Areas
were divided according to building type. GI practices are assigned to source areas within each
land use; modeled inputs for GI were adapted using the SWMM parameters.
WinSLAMM was the preferred method for modeling pollutant loading because the
calculations are based on individual rain events. Individual rain events were deemed specifically
important for pollutant loading as the most frequent rain events cause CSO problems for
8. 6
Hoboken’s stormwater system and for consistency with the NJDEP’s regulatory approach for
stormwater management design. Particulate concentrations within the model are a function of
runoff depth, land use, and source area. Land use and source area are user defined according to
campus subcatchment areas. Simulations were modeled using programmed files from NSQD
and NURP.
Maintenance
Maintenance for all GI techniques is required to keep the systems working. Depending
on the system, maintenance is needed weekly, monthly, semi‐annually, and/or
annually. Planter, bioretention, and living roof inspection are critical to the operation of the
system to ensure it remains clear of debris. Debris will interrupt proper drainage flow, affecting
the efficiency of the system. Cistern inspection is critical to the operation of the system to
ensure the floor of the system remains clear of debris. Debris will provoke an odor and yellow
tint, affecting the quality of the water. Permeable pavement inspection is critical to the
operation of the system to ensure plants do not root into the pavement. Rooting into the
pavement will decrease drainage, affecting the efficiency of the system. Existing stormwater
infrastructure requires inlet maintenance and regrading around inlets to prevent unnecessary
runoff to stressed areas. Campus inlets currently fill with organic debris reducing drainage
capacity and tend to be bypassed by stormwater.
Expected Outcomes
The Living Laboratory is projected to successfully solve existing stormwater problems
while adding the benefit of repurposing captured water for irrigation. The Living Laboratory
reduces total campus runoff and peak flows, as shown in Figure 6.
The introduction of GI to the Stevens campus results in a 10.5% reduction (2.83 cfs) in
peak flow of stormwater leaving the campus. The Living Laboratory will capture 0.162 MG
during each WQ storm, a 20% reduction in runoff from the current conditions on campus.
Approximately 80% of campus is included in drainage areas, which house the designated
problem areas. A breakdown of the level of mitigation achieved in these areas can be found in
Table 4.
Figure 6: Existing Campus vs. Living Laboratory Hydrograph
9. 7
Drainage Area Size (Acres) Percent of Drainage
Area Mitigated by GI
(%)
Percent Reduction in
Runoff Volume (%)
Volume Reduction
(MG)
1 6.38 14 8.74 0.016
2 3.16 30 24.62 0.023
3 7.51 17 21.25 0.034
4 3.4 10 36.36 0.019
5&6 6.66 25 34.81 0.035
8 3.15 17 34.85 0.021
Total 30.26 19 23 0.147
The combination of proposed GI and compost amendment creates a cohesive aesthetic
within the campus. The Living Laboratory alleviates ponding, significantly decreases runoff and
demonstrates the successful implementation of GI within the urban environment in poor soil
conditions. The compost amendment when modeled for the major lawns during the WQ storm
shows a reduction of 61,000 gallons in runoff volume through infiltration. The amendment
would promote grass growth and eliminate the existing turf replacement program resulting in
savings. Table 5 shows the impact of all designed GIs grouped by technique, during modeling of
the WQ storm, and continuous conditions.
GI Type Number of Units Volume Retained per WQS (gal) Average Annual Retention (MG/yr)
Planters 15 18,513 0.432
Bioretention Cells 7 21,295 0.679
Cisterns 2 21,041 0.684
Permeable Pavers 2 18,735 0.645
Living Roofs 3 21,818 0.609
Total 29 101,400 3.049
The team analyzed the Living Laboratory’s effectiveness over the simulated 25‐yr period
with the continuous model. Figure 7 shows the Living Laboratory’s effect on runoff over long
term conditions. The Living Laboratory reduced the number of days with runoff exceeding
0.25‐in by approximately 200, over a 25 year period, while reducing the maximum runoff
experienced by close to 0.5‐in. The gap between the exceedance curves shows the Living
Laboratory design effects frequent runoff events, and extreme runoff events.
Table 4: Volume Reduction per Drainage Area
Table 5: GI Retention Breakdown
Figure 7: 25 Year Continuous Runoff Model
10. 8
Under existing conditions, Stevens discharges 20.6 MG per year into the Hoboken CSS.
The total volume reduction per year with the Living Laboratory is approximately 4.5 MG. This
reduction includes compost amendment in the major lawns, which was recommended to
increase infiltration, eliminate ponding and mitigate runoff to already stressed areas of the
current drainage system.
Urban runoff is one of the greatest sources of water pollution. The Living Laboratory
decreases runoff to the Hoboken CSS, and subsequently the Hudson River. The reduction in
volume helps with mitigation of this problem and in turn, assists with pollutant loading. The
Team addressed most typical pollutants experienced in stormwater systems and urban runoff.
Specifically modeled were fecal coliform and E. coli as they are known discharge complications
for the Hudson River. Nonpoint source pollution including oil, rubber, and heavy metals affect
water quality of runoff, however these constituents were not modeled in order to keep the
focus on site specific problems. All constituents that assist in bacteria growth at low dissolved
oxygen conditions were included as well to assist in reduction of fecal coliform and E. coli.
Pollutant Percent Yield Reduction
Particulate Solids 24%
Total Phosphorus 26%
Nitrate 13%
TKN 17%
Total COD 20%
Fecal Coliform Bacteria 14%
Filterable E Coli 8%
When the proposed Living Laboratory is phased into the proposed ten‐year campus
plan, the expected outcomes for runoff pollutant reduction will be significant as seen in Table 6.
Percent yield reduction of pollutants were strictly monitored for the tributary areas of each GI.
The highest percentage reduction is exhibited in phosphorus, total kjeldahl nitrogen (TKN),
chemical oxygen demand (COD), and particulate solids. Phosphorus, TKN, and COD are all
constituents that catalyze organic growth and bacteria formation. Remaining E. coli and fecal
coliform growth will in turn be reduced due to limiting nutrient supply. The Team was able to
achieve an 8% reduction in E. coli and 14% reduction in fecal coliform. The effectiveness of the
GI in pollutant reduction was considered successful not only because of the moderate E. coli
and fecal coliform reduction but also because of the high cofactoring nutrients and the
particulate solids reduction. The percent pollutant reduction of particulate solids can be further
broken down by GI practices as seen in Figure 8.
Table 6: Living Laboratory Pollutant Reduction
Figure 8: Pollutant Reduction per GI systems
11. 9
The cisterns exhibit the highest amount of reduction as each unit captures nearly 100%
of the water routed to them. Permeable pavers due to their high ability to store and reduce
runoff assist in pollutant reduction with volume reduction. Living roofs only experience
precipitation pollutant source loading thus experience a higher reduction. Planters and
bioretention cells exhibit smaller reductions due to the high variety of tributary areas routed
through each. All of these units experience a massive load in both volume of water and quantity
of pollutants.
Cost
A cost‐benefit analysis was completed on the project as a whole to assess feasibility and
likelihood of implementation. Numbers pertaining to the cost of construction and cost of
operations and maintenance (O&M) per square foot (bioretention, planters, permeable
pavement, and living roofs) and per gallon (cisterns) were obtained from the Center for
Neighborhood Technology’s (CNT) Green Values® National Stormwater Management
Calculator.
GI Applications Cost
Planters
Minimum $8,630
Average $155,904
Maximum $275,727
Bioretention
Minimum $49,394
Average $59,350
Maximum $119,848
Cisterns
Minimum $17,819
Average $93,475
Maximum $135,247
Permeable Pavement
Minimum $102,692
Average $148,024
Maximum $328,428
Living Roof
Minimum $258,667
Average $457,911
Maximum $1,177,284
Total
Minimum $437,202
Average $914,663
Maximum $2,036,535
Table 7 provides a breakdown of the minimum, median and maximum cost estimations
for each GI technique over the course of the 25 year lifespan. Cost of construction for the Living
Laboratory project came to an average total of $685,507. Cost of O&M came to an average
annual total of $9,166. Savings for campus was calculated per gallon saved by the Living
Laboratory. Stevens’s campus is charged 1.3 cents per gallon discharged into Hoboken’s
Stormwater Collection System. Table 8 depicts the total savings over the 25 year lifespan per GI.
Table 7: GI 25 Year Lifespan Cost Analysis
12. 10
GI Application Savings
Planters $140,339
Bioretention $220,534
Cisterns $221,903
Permeable Pavement $209,246
Living Roof $197,610
Total $989,634
The savings produced through water captured by the Living Laboratory came to an
average annual total of $39,585. Over a 25 year period, Stevens will profit an average total of
$74,968. Table 9 shows the costs, savings, and profits of the Living Laboratory over a 25 year
period.
Living Laboratory
25 Year Period
Average Cost $914,633
Savings $989,632
Profit $74,968
The Living Laboratory proposed is not only beneficial for stormwater and pollution
reduction but also economically viable. The Living Laboratory plan cost analysis predicts that
the plan will come ahead over the course of the 25 year lifespan by two years. Steven Facilities
will benefit from the economic gains throughout those two years influencing future GI
proposals, implementations, and the development of GI research programs. The GI systems are
perceived as successful proposals for campus implementation as they provide aesthetic
solutions to expressed problems. Facilities, Events Management, and campus users will benefit
from lawn solutions enabling successful events, runoff volume reduction, and generate positive
campus and community relations. The abundance of GI applications ensures that the Living
Laboratory will transform Stevens into a leader of sustainable stormwater management.
Presented By:
Table 8: GI 25 Year Lifespan Savings Analysis
Table 9: Total Living Laboratory Cost Analysis