The document discusses the challenges faced by Europe regarding its economic competitiveness, emphasizing a significant productivity gap with the US that has led to declining living standards and increased vulnerabilities due to geopolitical tensions. It highlights three key areas for action: closing the innovation gap, creating a joint plan for decarbonisation and competitiveness, and increasing security while reducing dependencies on foreign supplies. The report urges coordinated policy responses to overcome barriers and recommends a comprehensive new industrial strategy to ensure sustainable growth and maintain European values.


![1. The starting point:
a new landscape for Europe
Europe has the foundations in place to be a highly competitive economy. The European model combines an
open economy, a high degree of market competition and a strong legal framework and active policies to fight poverty
and redistribute wealth. This model has allowed the EU to marry high levels of economic integration and human
development with low levels of inequality. Europe has built a Single Market of 440 million consumers and 23 million
companies, accounting for around 17% of global GDP [see Figure 1], while achieving rates of income inequality that
are around 10 percentage points belowthose seen in the United States (US) and China, according to some measures
[see Figure 2]. At the same time, the EU’s approach has delivered outstanding outcomes in terms of governance,
health, education and environmental protection. Of the world’s ten top-scoring countries for the application of the
rule of law, eight are EU Member Statesi
. Europe leads the US and China in terms of life expectancy at birth and low
infant mortalityii
. Europe’s education and training systems deliver strong educational attainment, with a third of adults
having completed higher educationiii
. The EU is also the world leader in sustainability and environmental standards
and progress towards the circular economy, backed by the most ambitious global targets for decarbonisation, and
can benefit from the largest exclusive economic zone in the world, covering 17 million square kilometres, 4 times the
EUs land surface01
.
FIGURE 1
Share of World GDP
GDP at current prices, 2023
Source: IMF, 2024
01. The Exclusive Economic Zones (EEZs) are sea zones prescribed by the United Nations Convention on the Law of the Sea,
extending up to 200 nautical miles from the coast of a country, within which the state has the rights to explore and exploit
maritime resources. Leveraging this vast maritime area will contribute to competitiveness, security and sustainability.
07
THE FUTURE OF EUROPEAN COMPETITIVENESS — PART A | CHAPTER 1](https://image.slidesharecdn.com/thefutureofeuropeancompetitivenessacompetitivenessstrategyforeurope-240910144201-24597139/75/The-future-of-European-competitiveness-_-A-competitiveness-strategy-for-Europe-pdf-9-2048.jpg)
![FIGURE 2
Income and wage inequality in world regions
Source: World Inequality Database (WID), 2024
Yet growth in the EU has been slowing, driven by weakening productivity growth, calling into question
Europe’s ability to meet its ambitions. The EU has set out a range of ambitions – such as achieving high levels of
social inclusion, delivering carbon neutrality and increasing geopolitical relevance – which depend on maintaining
solid rates of economic growth. However, EU economic growth has been persistently slower than in the US over the
past two decades, while China has been rapidly catching up. The EU-US gap in the level of GDP at 2015 prices02
has gradually widened from slightly more than 15% in 2002 to 30% in 2023, while on a purchasing power parity (PPP)
basis a gap of 12% has emerged [see Figure 3]. The gap has widened less on per capita basis as the US has seen
faster population growth, but it is still significant: in PPP terms, it has risen from 31% in 2002 to 34% today. The main
driver of these diverging developments has been productivity. Around 70% of the gap in per capita GDP with US at
PPP is explained by lower productivity in the EU [see Figure 4]. Slower productivity growth has in turn been asso-
ciated with slower income growth and weaker domestic demand in Europe: on a per capita basis, real disposable
income has grown almost twice as much in the US as in the EU since 2000.
FIGURE 3
GDP evolution
2015 reference levels, in EUR trillion
Source: OECD, 2024.
02. The value of the gap in GDP in any given year is only indicative. It should not be viewed as an exact estimate as price
deflators and purchasing power adjustments are imperfect. When comparing GDP developments across countries, the
price deflator and exchange rate have an important effect on results. Depending on the objective of the comparison, one
or the other indicator may be more relevant. GDP at current prices offers insights into market value, GDP at constant prices
into volume growth, while purchasing power adjustment allows a comparison from the consumer perspective.
08
THE FUTURE OF EUROPEAN COMPETITIVENESS — PART A | CHAPTER 1](https://image.slidesharecdn.com/thefutureofeuropeancompetitivenessacompetitivenessstrategyforeurope-240910144201-24597139/75/The-future-of-European-competitiveness-_-A-competitiveness-strategy-for-Europe-pdf-10-2048.jpg)

![Three transformations ahead for Europe
Europe now faces three major transformations, the first of which is the need to accelerate innovation and
find new growth engines. The EU’s competitiveness is currently being squeezed from two sides. On the one side,
EU companies are facing weaker foreign demand – especially from China – and rising competitive pressures from
Chinese companies. The ECB finds that the share of sectors in which China is directly competing with the euro area
exporters03
is now close to 40%, up from 25% in 2002v
. The EU’s share in world trade is declining, with a notable fall
since the onset ofthe pandemic04
[see Figure 5]. On the other side, Europe’s position in the advanced technologies
that will drive future growth is declining. Only four of the world’s top 50 tech companies are European and the EU’s
global position in tech is deteriorating: from 2013 to 2023, its share of global tech revenues dropped from 22% to
18%, while the US share rose from 30% to 38%. Europe urgently needs to accelerate its rate of innovation both to
maintain its manufacturing leadership and to develop new breakthrough technologies. Faster innovation will, in turn,
help raise the EU’s productivity growth, leading to stronger growth in household incomes and stronger domestic
demand. Europe still has an opportunity to change track. With the world now on the cusp of another digital revolu-
tion, triggered by the spread of artificial intelligence (AI), a window has opened for Europe to redress its failings in
innovation and productivity and to restore its manufacturing potential.
FIGURE 5
Share in world trade in goods and services
% of global trade, excluding intra-EU trade
Note: The data refers to goods trade (lhs) and services trade (rhs), excluding intra-EU. The global total is the net of intra-EU trade.
Source: European Commission (JRC). Based on WTO.
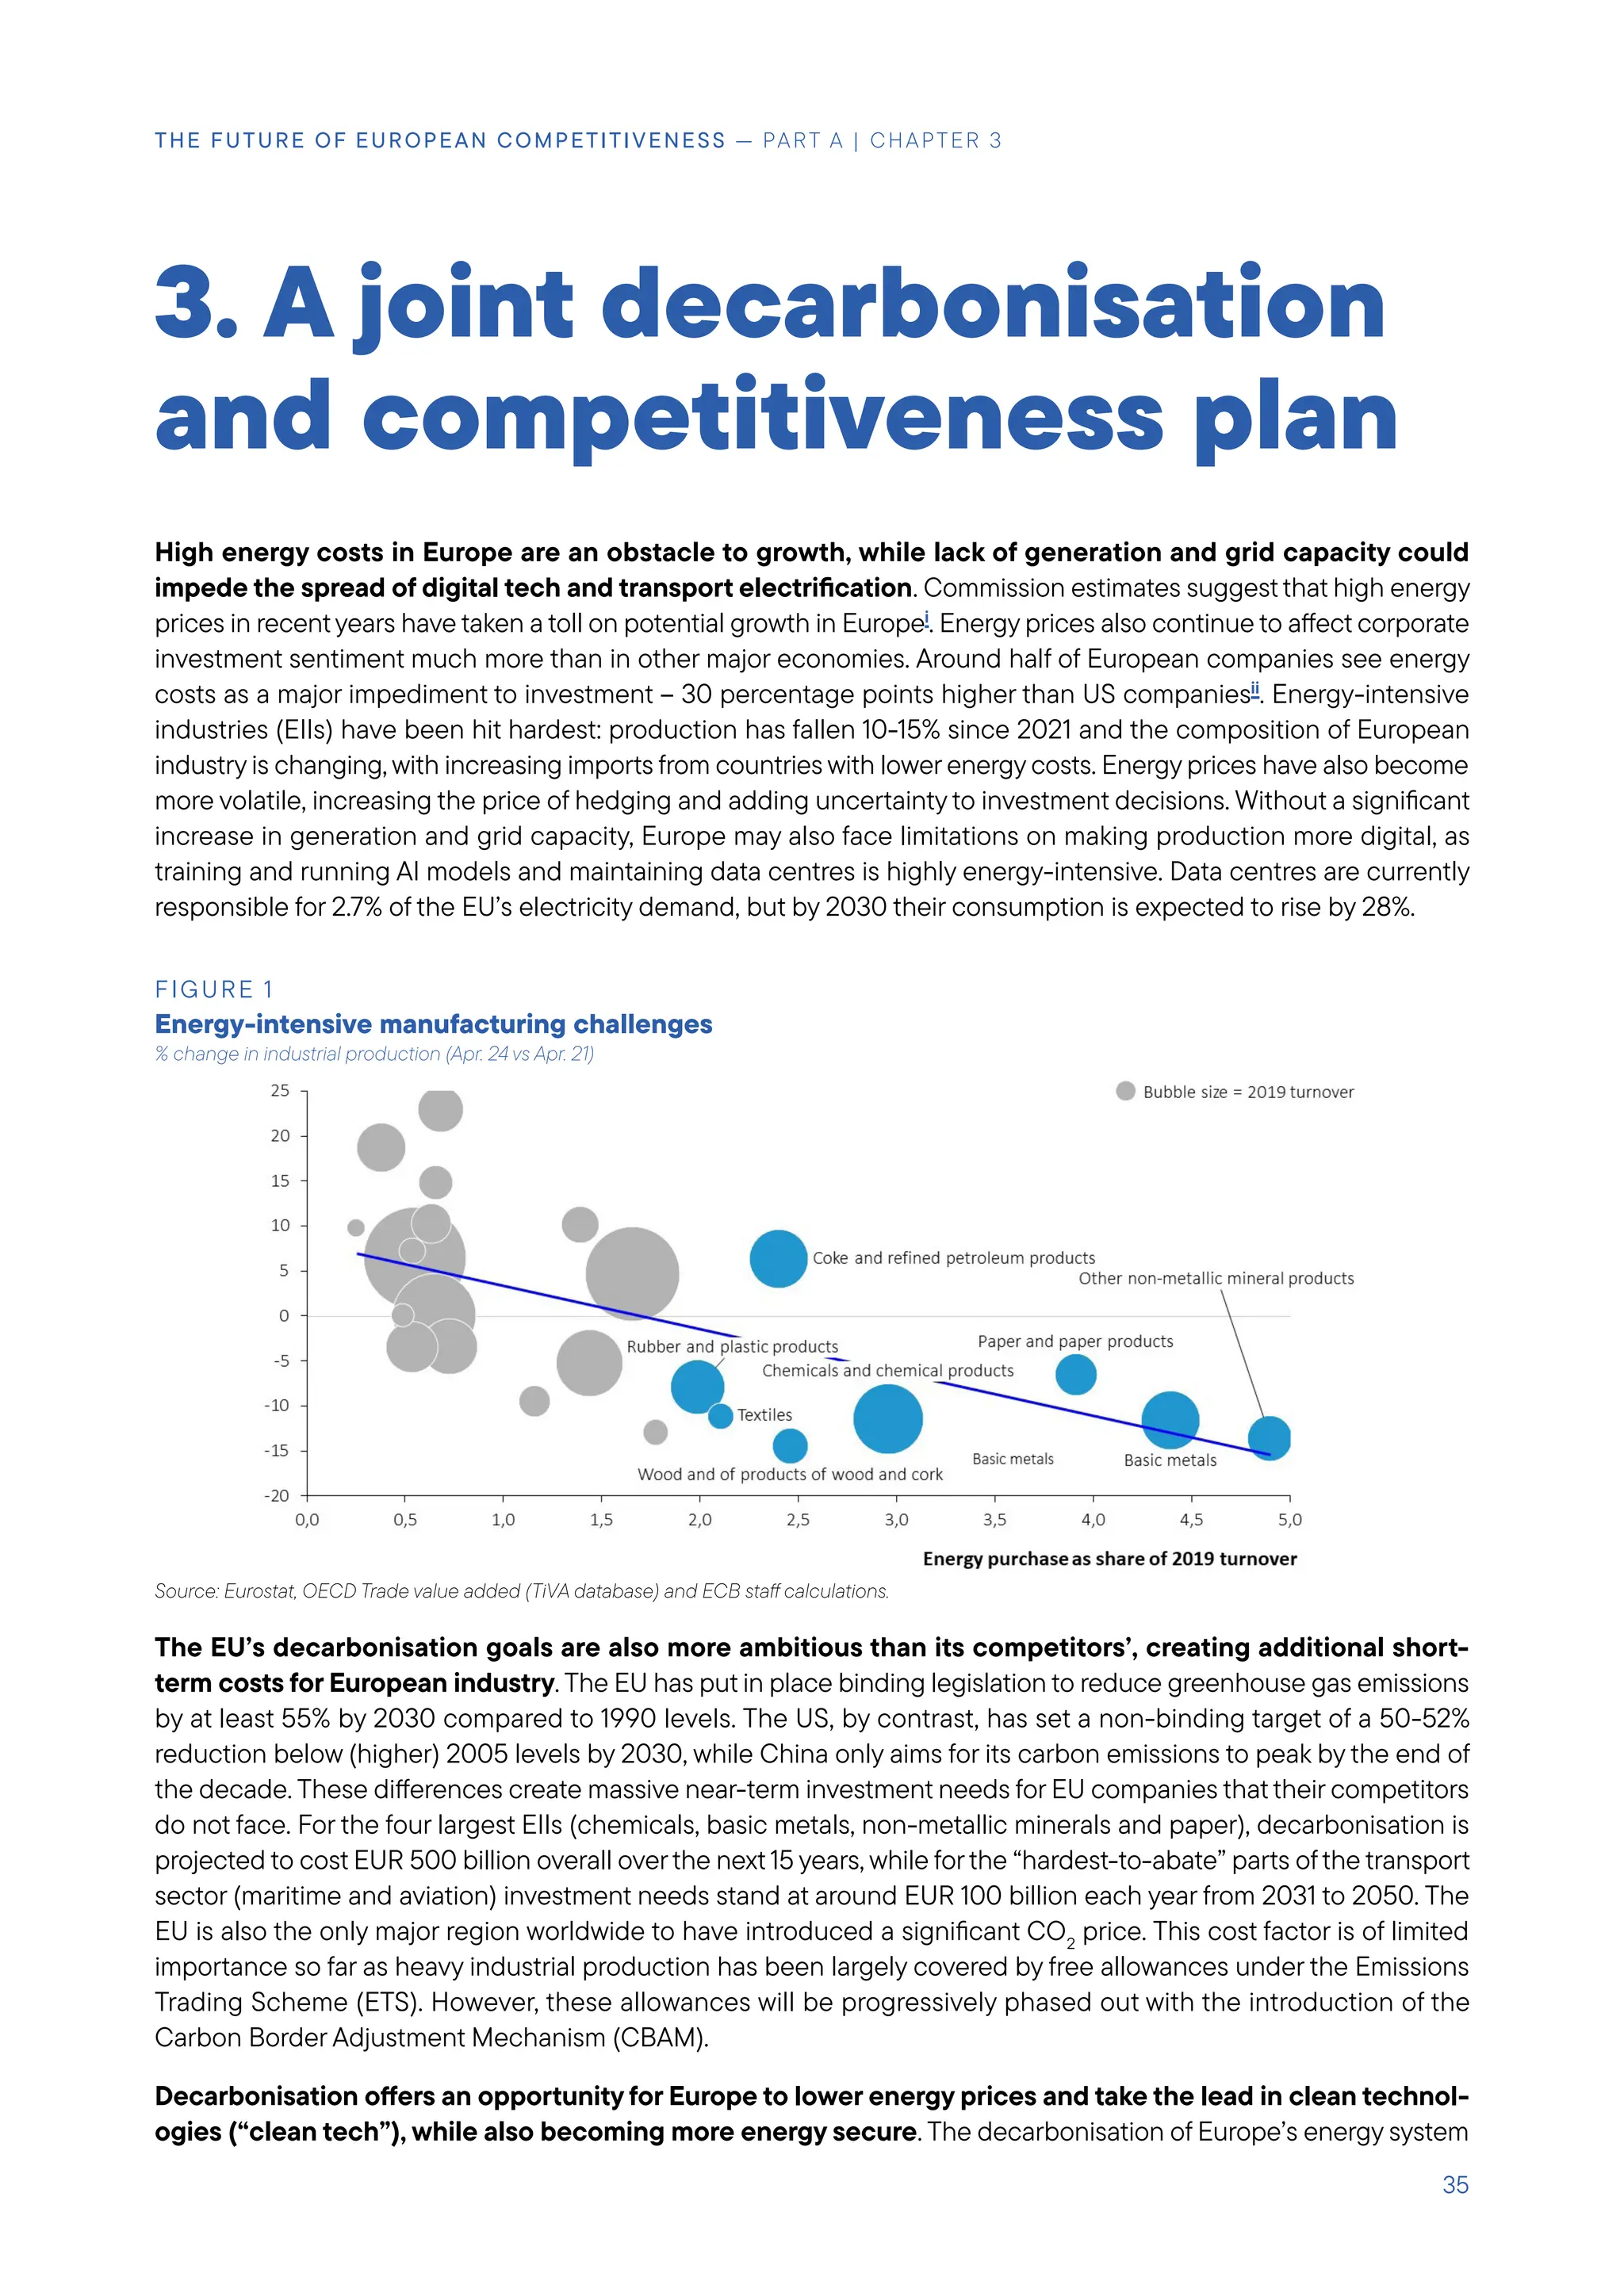
Second, Europe must bring down high energy prices while continuing to decarbonise and shift to a circular
economy. The energy landscape has changed irreversibly with the Russian invasion of Ukraine and the resulting
loss of pipeline natural gas. While energy prices have fallen considerably from their peaks, EU companies still face
electricity prices that are 2-3 times those in the US and natural gas prices paid are 4-5 times higher [see Figure 6].
Decarbonisation could be an opportunity for Europe, both to take the lead in new clean technologies and circu-
larity solutions, and to shift power generation towards secure, low-cost clean energy sources in which the EU has
generous natural endowments. However, whether Europe can seize this opportunitywill depend on all policies being
in sync with the EU’s decarbonisation objectives. The energy transition will be gradual and fossil fuels will continue
to play a central role in energy pricing for the remainder of this decade, threatening continued price volatility for
end users. EU industries that use energy intensively face higher investment costs than their competitors to meet
decarbonisation targets. At the same time, Chinese competition is becoming particularly acute in the key industries
that will drive decarbonisation – such as clean tech and electric vehicles – driven by a powerful combination of
03. Based on analysis of revealed comparative advantage.
04. EU firms have also been experiencing competitiveness losses owing to increased input costs,
exacerbated by elevated energy prices in Europe compared to other regions.
10
THE FUTURE OF EUROPEAN COMPETITIVENESS — PART A | CHAPTER 1](https://image.slidesharecdn.com/thefutureofeuropeancompetitivenessacompetitivenessstrategyforeurope-240910144201-24597139/75/The-future-of-European-competitiveness-_-A-competitiveness-strategy-for-Europe-pdf-12-2048.jpg)
![massive industrial policy, rapid innovation, control of raw materials and the abilityto produce at continent-wide scale.
For the EU to succeed, it will therefore need to engineer a coherent strategy for all aspects of decarbonisation, from
energy to industry.
FIGURE 6
Gas and retail price gap for industry
Source: European Commission, 2024. Based on Eurostat (EU), EIA (US) and CEIC (China), 2024.
Third, Europe must react to a world of less stable geopolitics, where dependencies are becoming vulner-
abilities and it can no longer rely on others for its security. Decades of globalisation have produced a high
level of “strategic interdependence” between major economies, raising the costs of any rapid disentanglementvi
.
For example, while the EU largely depends on China for critical minerals, China depends on the EU to absorb its
industrial overcapacity. But this global equilibrium is shifting: all major economies are actively seeking to reduce
their dependency and increase their scope for independent action. The US is investing in domestic capacity for
semiconductor and clean tech production, while aiming to re-route critical supply chains through its allies. China is
striving for technological autarchy and vertical supply chain integration, from mining of raw materials to processing
and from manufacturing to shipping. While there is little evidence yet that these measures are leading to de-global-
isationvii
, trade policy interventions are on the rise [see Figure 7]. Given its high trade openness, Europe is especially
exposed should these trends accelerate. The EU must also respond to a radically changed security environment at
its borders. Aggregate EU defence spending is currently one third of US levels and the European defence industry
is suffering from decades of underinvestment and depleted stocks. To achieve genuine strategic independence
and increase its global geopolitical influence, Europe needs a plan to manage these dependencies and strengthen
defence investment.
11
THE FUTURE OF EUROPEAN COMPETITIVENESS — PART A | CHAPTER 1](https://image.slidesharecdn.com/thefutureofeuropeancompetitivenessacompetitivenessstrategyforeurope-240910144201-24597139/75/The-future-of-European-competitiveness-_-A-competitiveness-strategy-for-Europe-pdf-13-2048.jpg)
![FIGURE 7
Trade policy interventions
Note: Measures include tariffs, export-related measures, subsidies, contingent trade-protective measures, and trade-related investment measures.
Source: Global Trade Alert, 2024.
EU countries are already responding to this new environment with more assertive policies, but they are
doing so in a fragmented way that undermines collective effectiveness. The use of industrial policy interven-
tions is on the rise across advanced economiesviii
. But the effectiveness of these policies in Europe is hindered by
three main coordination problems. First, there is a lack of coordination between Member States. Uncoordinated
national policies often lead to considerable duplication, incompatible standards and failure to consider externalities.
One particularly damaging externality in the EU context is its adverse impact on the Single Market when the largest
countries with the most fiscal space can provide much more generous support than others [see Figure 8]. Second,
there is a lack of coordination among financing instruments. While the EU collectively spends a large amount on
its industrial goals, financing instruments are split along national lines and between Member States and the EU.
This fragmentation hampers scale, preventing the creation of large capital pools in particular for investments in
breakthrough innovation. It also hampers innovation by creating unnecessary complexity and bureaucracy for the
private sector. Third, there is a lack of coordination across policies. Industrial policies today – as seen in the US
and China – comprise multi-policy strategies, combining fiscal policies to incentivise domestic production, trade
policies to penalise anti-competitive behaviour abroad and foreign economic policies to secure supply chains. In
the EU context, linking policies in this way requires a high degree of coordination between national and EU policies.
However, owing to its complex governance structure and slow and disaggregated policymaking process, the EU is
less able to produce such a response.
FIGURE 8
Total State aid expenditure by Member State
2022, as % of GDP (top) and EUR billion (bottom)
Breakdown between COVID-19, State aid in response to the Russian invasion of Ukraine, and other State aid measures
Source: European Commission, 2024.
12
THE FUTURE OF EUROPEAN COMPETITIVENESS — PART A | CHAPTER 1](https://image.slidesharecdn.com/thefutureofeuropeancompetitivenessacompetitivenessstrategyforeurope-240910144201-24597139/75/The-future-of-European-competitiveness-_-A-competitiveness-strategy-for-Europe-pdf-14-2048.jpg)
![Towards a European response
GOALS
To manage these transformations, the report proposes a new industrial strategy for Europe. The three
main areas for action outlined in the report correspond to the three main transformations with which Europe must
contend. First, Europe needs to redress its slowing productivity growth by closing the innovation gap. This objective
will entail accelerating significantly technological and scientific innovation, improving the pipeline from innovation
to commercialisation, removing barriers that prevent innovative companies from growing and attracting finance,
and undertaking concerted efforts to close skills gaps. Second, to lower energy prices and capture the industrial
opportunities of decarbonisation, Europe needs a joint plan for decarbonisation and competitiveness. This plan will
have to ensure that Europe’s ambitious demand for decarbonisation can be matched by leadership on the technol-
ogies that will supply it. It will have to span industries that produce energy, those that enable decarbonisation, such
as clean tech and automotives, and industries that use energy intensively and are “hard-to-abate”. Third, Europe
needs to increase security and reduce dependencies. Given its high trade openness and dependence on imports
ranging from raw materials to advanced technology, the EU will need to develop a genuine “foreign economic policy”
that coordinates preferential trade agreements and direct investment with resource-rich nations, the building up
of stockpiles in selected critical areas, and the creation of industrial partnerships to secure the supply chain of key
technologies. Europe will also need to develop a strong and independent defence industrial capacity that allows
it to meet increasing demand for military assets and equipment and remain at the forefront of defence technology.
BUILDING BLOCKS
The EU’s new industrial strategy rests on a series of building blocks, the first of which is full implementation
of the Single Market. The Single Market is critical for all aspects of the strategy: for enabling scale for young, inno-
vative companies and large industrials that compete on global markets; for creating a deep and diversified common
energy market, an integrated multimodal transport market and strong demand for decarbonisation solutions; for
negotiating preferential trade deals and building more resilient supply chains; for mobilising greater volumes of
private finance; and as a result, for unlocking higher domestic demand and investment. Remaining trade frictions in
the EU mean that Europe is leaving around 10% of potential GDP on the table, according to one estimateix
. Proposals
to complete the Single Market for different sectors appear in many chapters of this report. However, as the Letta
report has systematically analysed the key challenges facing the Single Market and provided recommendations,
there is no chapter dedicated solely to the Single Market in this reportx
.
The next building blocks are industrial, competition and trade policies, which interact closely and must be
aligned as part of an overall strategy. Evidence that industrial policies can be effective under certain circum-
stances is growingxi
. But to avoid the pitfalls of the past – such as defending incumbent companies or picking
winners – these policies must be organised according to a set of key principles which embed best practice. Among
others, the focus of such policies should be on sectors rather than companies; public support should be contin-
uously evaluated, underpinned by a rigorous monitoring exercise; and market failures should be clearly specified
and public authorities should avoid duplicating what the private sector would already doxii
. The interaction with
competition authorities is also critical for successxiii
. For priority sectors, the EU should aim as far as possible to be
competitively neutral and regulation should be designed to facilitate market entry. The evidence is overwhelming
that competition stimulates productivity, investment and innovationxiv
. At the same time, competition policy should
continue to adaptto changes in the economy so that it does not become a barrierto Europe’s goals [see the chapter
on competition policy]. For example, since innovation in the tech sector is rapid and requires large budgets, merger
evaluations should assess how the proposed concentration will affect future innovation potential in critical innova-
tion areas. Important Projects of Common Interest (IPCEIs) should be expanded to all forms of innovation that could
effectively push Europe to the frontier in strategically important sectors and benefit from EU financing. There are
also sectors, such as defence, where security and resilience criteria should receive increasing weight considering
geopolitical changes for trade policy. A pragmatic, cautious and consistent approach should be applied according
to the needs of different sectors [see Box 1].
13
THE FUTURE OF EUROPEAN COMPETITIVENESS — PART A | CHAPTER 1](https://image.slidesharecdn.com/thefutureofeuropeancompetitivenessacompetitivenessstrategyforeurope-240910144201-24597139/75/The-future-of-European-competitiveness-_-A-competitiveness-strategy-for-Europe-pdf-15-2048.jpg)


![2. Closing the innovation
gap
Europe’s productivity challenge
Europe needs faster productivity growth to maintain sustainable growth rates in the face of adverse demo-
graphics. Afterthe second world war, the EU experienced strong catch-up growth driven by both rising productivity
and a growing population. However, both drivers of growth are now slowing. EU labour productivity01
converged from
22% of the US level in 1945 to 95% in 1995 but labour productivity growth has subsequently slowed by more than in
the US and fallen back below 80% of the US level [see Figure 1]i
. At the same time, Europe is entering the first period
in modern history in which GDP growth will not be supported by sustained net growth ofthe labourforce [see Box1].
By 2040, the EU’s workforce is projected to shrink by close to 2 million workers each year, while the ratio of working
to retired people is expected to fall from around 3:1 to 2:1. On this trajectory, growth in Europe will stall. If the EU were
to maintain its average labour productivity growth rate since 2015 of 0.7%, it would only be enough to keep GDP
constant until 2050. In an environment of historically high public debt-to-GDP ratios, potentially higher real interest
rates than seen in the last decade and rising spending needs for the decarbonisation, digitalisation and defence,
stagnant GDP growth could eventually lead to public debt levels becoming unsustainable and Europe being forced
to give up one or more of these goals.
FIGURE 1
EU versus US labour productivity 1890-2022
Index (US=100)
Note: The EU is proxied by backdating national accounting data from Germany, France, Italy, Spain, the Netherlands, Belgium, Ireland, Austria, Portugal, Finland
and Greece. To build the labour productivity data, five different series were used: GDP, capital stock, employment, average hours worked, and population.
Capital stock is built using two series of investment – construction and equipment. Investment and GDP are taken in volume and in national currency of 2010,
they are then turned into $2010 using a ppp conversion rate.
Source: Bergeaud, A., Cette, G., & Lecat, R., Productivity Trends in Advanced Countries between 1890 and 2012, Review of Income and Wealth, Vol. 62, No. 3,
2016, pp. 420-444
01. Measured in 2010 constant PPP prices.
19
THE FUTURE OF EUROPEAN COMPETITIVENESS — PART A | CHAPTER 2](https://image.slidesharecdn.com/thefutureofeuropeancompetitivenessacompetitivenessstrategyforeurope-240910144201-24597139/75/The-future-of-European-competitiveness-_-A-competitiveness-strategy-for-Europe-pdf-21-2048.jpg)
![The key driver of the rising productivity gap between the EU and the US has been digital technology
(“tech”) – and Europe currently looks set to fall further behind. The main reason EU productivity diverged from
the US in the mid-1990s was Europe’s failure to capitalise on the first digital revolution led by the internet – both in
terms of generating new tech companies and diffusing digital tech into the economy. In fact, if we exclude the tech
sector, EU productivity growth over the past twenty years would be broadly at par with the US [see Figure 2 and
Box 2]. Europe is lagging in the breakthrough digital technologies that will drive growth in the future. Around 70%
of foundational AI models have been developed in the US since 2017 and just three US “hyperscalers” account for
over 65% of the global as well as of the European cloud market. The largest European cloud operator accounts for
just 2% of the EU market. Quantum computing is poised to be the next major innovation, but five of the top ten tech
companies globally in terms of quantum investment are based in the US and four in China. None are based in the EU.
FIGURE 2
Decomposition of average annual labour productivity growth
Selected sectors, US and EU (pp, 2000-2019)
Note: EU is the GDP-weighted average of AT, BE, DE, DK, ES, FI, FR, IT, NL, SE. The values are the average annual labour productivity (GVA per hour worked)
growth contributions over the period 2000-2019.
Source: Nikolov, P., Simons, W., Turrini, A. Voigt, P., forthcoming.
While some digital sectors are likely already “lost”, Europe still has an opportunity to capitalise on future
waves of digital innovation. The EU’s competitive disadvantage will likely widen in cloud computing, as the market
is characterised by continuous massive investments, economies of scale and multiple services offered by a single
provider. However, there are multiple reasons why Europe should not give up on developing its domestic tech sector.
First, it is important that EU companies maintain a foothold in areas where technological sovereignty is required,
such as security and encryption (“sovereign cloud” solutions). Second, a weak tech sector will hinder innovation
performance in a wide range of adjacent fields, such as pharma, energy, materials and defence. Third, AI – and
particularly generative AI – is an evolving technology in which EU companies still have an opportunity to carve out
a leading position in selected segments. Europe holds a strong position in autonomous robotics, hosting around
22% of worldwide activity, and in AI services, hosting around 17% of activity02
. But innovative digital companies are
generally failing to scale up in Europe and attract finance, reflected in a huge gap in later-stage financing between
the EU and the US [see Figure 3]. In fact, there is no EU company with a market capitalisation over EUR 100 billion
that has been set up from scratch in the last fifty years, while in the US all six companies with a valuation above EUR
1 trillion have been created over this period03
.
02. JRC, Examples of AI services, Policy Brief, 2024. Examples of AI services include the use of any AI technology, such as
machine learning, computer vision, natural language processing, to perform high level applications such as business
intelligence, predictive analytics, forecasting, optimisation, failure detection, applied to different business functions.
03. “From scratch” refers to starting a company from its inception as a new entity, rather than
through mergers, acquisitions or spinoffs from established firms. 20
THE FUTURE OF EUROPEAN COMPETITIVENESS — PART A | CHAPTER 2](https://image.slidesharecdn.com/thefutureofeuropeancompetitivenessacompetitivenessstrategyforeurope-240910144201-24597139/75/The-future-of-European-competitiveness-_-A-competitiveness-strategy-for-Europe-pdf-22-2048.jpg)
![FIGURE 3
Venture capital investment by development stage
USD billion, 2023
Source: Pitchbook data. Accessed 20 November, 2023.
Integrating AI ‘vertically’ into European industry will be a critical factor in unlocking higher productivity [see
the Boxes on AI use cases in the thematic chapters]. Quantitative estimates ofthe effects ofAI on aggregate produc-
tivity are still uncertainii
. However, there are already clear signs that AI will revolutionise several industries in which
Europe specialises and will be crucial for EU companies ’ ability to remain leaders in their sector. For example, AI will
radically change the pharma sector via so-called “combination products” – therapeutic and diagnostic products
combining drugs, devices and biological components – which integrate medicine delivery systems with AI algo-
rithms and process feedback data in real time. Gains of USD 60-110 billion per year are estimated from the use cases
of AI in the pharma and medical device industries. AI will likewise transform the automotive sector, as AI-powered
(generative) algorithms enhance vehicle design by optimising structures and components, improve performance
and reduce material use, and optimise supply chains by predicting demand and streamlining logistics operations.
AI is expected to reduce inventories in the automotive sector, accelerate the time to market from R&I and increase
labour productivity. AI uptake in freight and passenger transport will enable increasingly automated functions to
deliver safety and quality, navigation and route optimisation, predictive maintenance and fuel or power reduction.
The energy sector is already heavily deploying AI, with more than 50 use cases today ranging from grid maintenance
to load forecasting. Large gains are however still available: estimates of the market value for future AI applications in
the sector reach USD 13 billion.
Although technology is crucial to protect Europe’s social model, AI could also undermine it without a strong
focus on skills. AI is already a source of anxiety for European workers: almost 70% of respondents in a recent survey
favoured government restrictions on AI to protect jobsiii
. The impact ofAI in Europe has so far been labour-enhancing
ratherthan labour-replacing: there is a positive association between AI exposure and the sector-occupation employ-
ment shareiv
. However, this association may be transitory as businesses are still in the early stage of understanding
how to deploy these technologies. Research from the US finds that around 80% of the workforce could have at least
10% of their work tasks affected by the introduction of the large language modules, while almost 20% of workers
could see at least 50% of their tasks affectedv
. Unlike previous waves of computerisation, the jobs of higher-skilled
workers are likely to be more exposed. Providing workers with adequate skills and training to make use of AI can
nevertheless help to make the benefits of AI more inclusive. In one recent study, access to AI assistance was found
to increase productivity for all workers, but less experienced or low-skilled staff benefitted the mostvi
. While Europe
should strive to match the US in innovative potential, it should aim to exceed it in providing opportunities for educa-
tion and lifelong learning – ensuring that the benefits of AI are widely shared and any negative impacts on social
inclusion are minimised.
21
THE FUTURE OF EUROPEAN COMPETITIVENESS — PART A | CHAPTER 2](https://image.slidesharecdn.com/thefutureofeuropeancompetitivenessacompetitivenessstrategyforeurope-240910144201-24597139/75/The-future-of-European-competitiveness-_-A-competitiveness-strategy-for-Europe-pdf-23-2048.jpg)

![Key barriers to innovation in Europe
At the root of Europe’s weak position in digital tech is a static industrial structure which produces a vicious
circle of low investment and low innovation [see the chapter on innovation]. Over the past two decades, the
top-three US companies for spending on Research and Innovation (R&I) have shifted from the automotive and
pharma industries in the 2000s, to software and hardware companies in the 2010s, and then to the digital sector in
the 2020s. In contrast, Europe’s industrial structure has remained static, with automotive companies consistently
dominating the top 3 R&I spenders. In other words, the US economy has nurtured new, innovative technologies
and investment has followed, redirecting resources towards sectors with high potential for productivity growth; in
Europe investment has remained concentrated on mature technologies and in sectors where productivity growth
rates of frontier companies are slowing. In 2021, EU companies spent about half as much on R&I as share of GDP
as US companies – around EUR 270 billion – a gap driven by much higher investment rates in the US tech sector.
This innovation gap also translates into a gap in overall productive investment between the two economies, which
is driven mainly by lower investment in tangible ICT assets and in software, databases and intellectual property
[see Figure 5]vii
. The resulting cycle of low industrial dynamism, low innovation, low investment and low productivity
growth in Europe has been termed “the middle technology trap”viii
.
FIGURE 5
Productive investment
Real gross fixed capital formation excluding residential investment, % of GDP
Source: EIB, 2024.
Europe’s lack of industrial dynamism owes in large part to weaknesses along the “innovation lifecycle” that
prevent new sectors and challengers from emerging. These weaknesses begin with obstacles in the pipeline
from innovation to commercialisation. Public sector support for R&I is inefficient due to a lack of focus on disruptive
innovation and fragmented financing, limiting the EU’s potential to reach scale in high-risk breakthrough technol-
ogies. Once companies reach the growth stage, they encounter regulatory and jurisdictional hurdles that prevent
them from scaling-up into mature, profitable companies in Europe. As a result, many innovative companies end
up seeking out financing from US venture capitalists (VCs) and see expanding in the large US market as a more
rewarding option than tackling fragmented EU markets. Finally, the EU is falling behind in providing state-of-the-art
infrastructures necessary to enable the digitalisation of the economy.
There are not enough academic institutions achieving top levels of excellence and the pipeline from inno-
vation into commercialisation is weak [see the chapter on innovation]. Universities and other research institutions
are central actors in early-stage innovation, generating breakthrough research and producing new skills profiles for
the workforce. Europe has a strong position in fundamental research and patenting: in 2021, it accounted for 17% of
global patent applications versus 21% forthe US and 25% for China. However, while the EU boasts a strong university
system on average, not enough universities and research institutions are at the top. Using volume of publications
in top academic science journals as an indicative metric, the EU has only three research institutions ranked among
24
THE FUTURE OF EUROPEAN COMPETITIVENESS — PART A | CHAPTER 2](https://image.slidesharecdn.com/thefutureofeuropeancompetitivenessacompetitivenessstrategyforeurope-240910144201-24597139/75/The-future-of-European-competitiveness-_-A-competitiveness-strategy-for-Europe-pdf-26-2048.jpg)
![the top 50 globally, whereas the US has 21 and China 15. The innovation pipeline in the EU is also weaker at the
next stage of commercialising fundamental research. Much of the knowledge generated by European researchers
remains commercially unexploited. According to the European Patent Office, only about one-third of the patented
inventions registered by European universities or research institutions are commercially exploited. A key reason for
this failure is that researchers in Europe are less well integrated into innovation “clusters” – networks of universities,
start-ups, large companies and venture capitalists (VCs) – which account for a large share of successful commer-
cialisations in high-tech sectors. Such clusters have been critical to the more dynamic industrial structure seen in
the US. Europe has no innovation “clusters” in the top 10 globally, while the US has 4 and China has 3.
Public spending on R&I in Europe lacks scale and is insufficiently focused on breakthrough innovation. In
the US, the vast majority of public R&I spending is carried out at the federal level. In the EU, governments overall
spend a similar amountto the US on R&I as a share of GDP, but only one tenth of spending takes place atthe EU level,
despite the large spillovers from public R&I investmentto the private sectorix
[see Figure 6]. The EU has an important
programme for R&I – Horizon Europe – with a budget of close to EUR 100 billion. But it is spread across too many
fields and access is excessively complex and bureaucratic. It is also insufficiently focused on disruptive innovation.
The EU’s key instrument to support radically new technologies at low readiness levels – the European Innovation
Council’s (EIC) Pathfinder instrument – has a budget of EUR 256 million for 2024, compared with USD 4.1 billion for
US Defence Advanced Research Projects Agency (DARPA) and USD 2 billion for the other “ARPA” agencies. It is also
mostly led by EU officials rather than top scientists and innovation experts. Lack of intra-EU coordination affects
the wider innovation ecosystem as well. Most Member States cannot achieve the necessary scale to deliver world-
leading research and technological infrastructures, in turn constraining R&I capacity. By contrast, the examples of
CERN and the European High-Performance Computing Joint Undertaking (EuroHPC) showcase the importance of
coordination when developing large R&I infrastructure projects.
FIGURE 6
State versus federal source of R&D funding in the EU and US
Source: European Commission, 2024. Based on Eurostat and OECD.
Fragmentation of the Single Market hinders innovative companies that reach the growth stage from scaling
up in the EU, which in turn reduces demand for financing. The huge gap in scale-up financing in the EU relative
to the US [see Figure 3] is often attributed to a smaller capital market in Europe and a less developed VC sector.
The share of global VC funds raised in the EU is just 5%, compared to 52% in the US and 40% in China. However, the
causality is likely more complex: lower levels of VC finance in Europe reflect lower levels of demand. As the Single
Market is fragmented and incomplete in the areas that matter for innovative companies, scaling up in the EU offers
weaker growth prospects and requires lowerfinancing. Many EU companies with high growth-potential preferto seek
financing from US VCs and to scale up in the US marketwhere they can more easily generate wide market reach and
achieve profitability faster. Between 2008 and 2021, 147 “unicorns” were founded in Europe – startups that went on
the be valued over USD 1 billion. 40 ofthese have relocated their headquarters abroad, with the vast majority moving
25
THE FUTURE OF EUROPEAN COMPETITIVENESS — PART A | CHAPTER 2](https://image.slidesharecdn.com/thefutureofeuropeancompetitivenessacompetitivenessstrategyforeurope-240910144201-24597139/75/The-future-of-European-competitiveness-_-A-competitiveness-strategy-for-Europe-pdf-27-2048.jpg)
![to the USx
. The lack of growth potential in Europe is particularly relevant for tech-based innovative ventures, and
even more so for deep tech ones. For example, 61% oftotal global funding forAI start-ups goes to US companies, 17%
to those in China and just 6% to those in the EU. For quantum computing, EU companies attract only 5% of global
private funding compared with a 50% share attracted by US companies.
Regulatory barriers to scaling up are particularly onerous in the tech sector, especially for young companies
[see the chapters on innovation, and digitalisation and advanced technologies]. Regulatory barriers constrain growth
in several ways. First, complex and costly procedures across fragmented national systems discourage inventors from
filing Intellectual Property Rights (IPRs), hindering young companies from leveraging the Single Market. Second,
the EU’s regulatory stance towards tech companies hampers innovation: the EU now has around 100 tech-focused
lawsxi
and over 270 regulators active in digital networks across all Member States. Many EU laws take a precau-
tionary approach, dictating specific business practices ex ante to avert potential risks ex post. For example, the AI
Act imposes additional regulatory requirements on general purpose AI models that exceed a pre-defined threshold
of computational power – a threshold which some state-of-the-art models already exceed. Third, digital compa-
nies are deterred from doing business across the EU via subsidiaries, as they face heterogeneous requirements, a
proliferation of regulatory agencies and “gold plating”04
of EU legislation by national authorities. Fourth, limitations
on data storing and processing create high compliance costs and hinder the creation of large, integrated data sets
for training AI models. This fragmentation puts EU companies at a disadvantage relative to the US, which relies on
the private sector to build vast data sets, and China, which can leverage its central institutions for data aggregation.
This problem is compounded by EU competition enforcement possibly inhibiting intra-industry cooperation. Finally,
multiple different national rules in public procurement generate high ongoing costs for cloud providers. The net
effect of this burden of regulation is that only larger companies – which are often non-EU based – have the financial
capacity and incentive to bearthe costs of complying. Young innovative tech companies may choose notto operate
in the EU at all.
The lack of a true Single Market also prevents enough companies in the wider economy from reaching
sufficient size to accelerate adoption of advanced technologies. There are many barriers that lead to compa-
nies in Europe to “stay small” and neglect the opportunities of the Single Market. These include the high cost of
adhering to heterogenous national regulations, the high cost oftax compliance, and the high cost of complying with
regulations that apply once companies reach a particular size. As a result, the EU has proportionally fewer small and
medium-sized companies than the US and proportionally more micro companies [see Figure 7]. However, there is
a close link between the size of companies and technology adoption. Evidence from the US show that adoption
rises with firm size for all advanced technologiesxii
. Likewise, while in 2023 30% of large businesses in the EU had
adopted AI, only 7% of SMEs had done the samexiii
. Size enables adoption because larger companies can spread
the high fixed costs of AI investment over greater revenues, they can count on more skilled management to make
the necessary organisational changes, and they can deploy AI more productively owing to larger data sets. In other
words, a fragmented Single Market puts EU companies at a disadvantage in terms of the speed of adoption and
diffusion of new AI applications.
04. Regulatory gold-plating refers to the practice where national governments or authorities go beyond the
minimum requirements set by European Union legislation when implementing it into domestic law.
26
THE FUTURE OF EUROPEAN COMPETITIVENESS — PART A | CHAPTER 2](https://image.slidesharecdn.com/thefutureofeuropeancompetitivenessacompetitivenessstrategyforeurope-240910144201-24597139/75/The-future-of-European-competitiveness-_-A-competitiveness-strategy-for-Europe-pdf-28-2048.jpg)
![FIGURE 7
Size distribution of firms in EU and US
2021
Note: Does not include the self-employed. EU data referto the following sectors: industry, construction and market services (except public administration and
defence; compulsory social security; activities of membership organizations). Forthe EU, to discountthe self-employed, data on businesses with 0 employees
has been used as a proxy.US data refers to the private sector, which includes agriculture but represents around 1% of the total firms. Data for the US is based
on the 1st quarter of the year.
Source: ECB calculations based on Eurostat and Bureau of Labour Statistics data
Competition for computing power and lack of investment in connectivity could soon translate into digital
bottlenecks [see the chapter on digitalisation and advanced technologies]. Training new foundation models and
building vertically integrated AI applications requires massive increases in computing power, which is triggering an
ongoing global “AI chip race” at huge expense. This is a race in which smaller and less well-funded EU companies
may struggle to compete. Mainly due to the computational power required, the cost of training frontier AI models is
estimated to have grown by a factor of 2 to 3 per year for the past eight years, suggesting that training next-genera-
tion AI systems could soon be as expensive as USD 1 billion and reach USD 10 billion by the end of the decadexiv
. At
the same time, deploying AI will require faster, lower latency and more secure connections. Yet, the EU is behind its
2030 Digital Decade targets forfibre and 5G deployment. The investment levels required to support EU networks are
estimated at around EUR 200 billion to ensure full gigabit and 5G coverage across the EU. But Europe’s per capita
investment is markedly lowerthan other major economies [see Figure 9]. A key reason for lower rates of investment is
Europe’s fragmented market. For example, there are 34 mobile network operator groups in the EU and only a handful
in the US or China, in part because the EU and Member States have tended to view mergers in the sector negatively.
This fragmentation makes the fixed costs of investing in networks relatively more onerous for EU operators than for
continent-scale companies in the US or China. Fragmentation also makes it harderto capitalise on newtechnologies.
Europe currently has virtually no presence in edge computing05
, while opening network services to third-party devel-
opers and innovators using Application Protocol Interfaces (APIs) is hindered by lack of coordination of standards.
05. Edge computing refers to the distribution of computational tasks across smaller nodes closer to customers, reducing data transport
to smaller distances. As the EU builds highly automated manufacturing plants requiring low latency and significant data volumes
steered by AI, edge computing for industrial applications could better enable performance and reduce latency for industrial
connected robotics, keeping data transfers more secure. While the Digital Decade sets the goal of deploying at least 10,000 climate-
neutral, secure edge nodes by 2030, there are today only three commercially deployed edge computing nodes in the EU.
27
THE FUTURE OF EUROPEAN COMPETITIVENESS — PART A | CHAPTER 2](https://image.slidesharecdn.com/thefutureofeuropeancompetitivenessacompetitivenessstrategyforeurope-240910144201-24597139/75/The-future-of-European-competitiveness-_-A-competitiveness-strategy-for-Europe-pdf-29-2048.jpg)
![FIGURE 8
Average monthly revenue per unit and CAPEX per capita
Source: ETNO, 2023
The EU’s position in other innovative sectors like pharma is declining due to the same challenges of low
investment in R&I and regulatory fragmentation [see the chapter on pharma]. While the EU’s pharma sector still
leads globally in trade measured byvalue, it is falling behind in the most dynamic market segments and losing market
share to US-based companies. Of the top ten best-selling biological medicines in Europe in 2022, just two were
marketed by EU companies while six were marketed by US-based companies [see Figure 9]. The EU is struggling in
particular to establish its position in products with market exclusivity as orphan medicines06
and advanced therapy
medicinal products07
. At the root of this emerging gap is lower spending on innovation. Total EU public sector R&I
spending on pharma stands at less than half the level of the US, while total EU private R&I investment is about a
quarter as large as the US. Innovation in the EU is also hindered by a slow and complex regulatory framework, which
is currently under review. In 2022, the median approval time for new medicines by regulatory agencies in Europe
was 430 days compared with 334 days in the US. Moreover, access to health data is one of the preconditions for the
development ofAI in the pharma industry but is constrained byfragmentation. In particular, although GDPR contains
options to use patient data for health research, take up has been uneven across Member States, preventing the
industry from tapping into a wealth of available electronic data.
FIGURE 9
Market share erosion in the key segment of biologics
Note: Based on IQVIA MIDAS® quarterlyvolume sales data for period 2012 – 2022 reflecting estimates of real-world activity. Copyright IQVIA. All rights reserved.
Data for EEA markets (no data for CY, MT, IS and LI; retail data onlyfor DK, EE, EL, LU, SI) and EC data (JRC R&D scoreboard) for regional allocation of companies.
Source: European Commission.
06. Orphan medicines are pharmaceutical products developed specifically to treat, prevent, or diagnose rare diseases or conditions. These
medications are called “orphan” because, under normal market conditions, pharmaceutical companies have little financial incentive
to develop and market products intended for only a small number of patients. Currently, 55% of orphan medicines are biologicals.
07. Advanced Therapy Medicinal Products (ATMPs) are innovative medicines for human use that
are based on genes, tissues, or cells. Many ATMPs are orphan medicines.
28
THE FUTURE OF EUROPEAN COMPETITIVENESS — PART A | CHAPTER 2](https://image.slidesharecdn.com/thefutureofeuropeancompetitivenessacompetitivenessstrategyforeurope-240910144201-24597139/75/The-future-of-European-competitiveness-_-A-competitiveness-strategy-for-Europe-pdf-30-2048.jpg)
![A programme to tackle the innovation deficit
Europe must improve the conditions for breakthrough innovation by addressing the weaknesses in its
common programmes for R&I [see the chapter on innovation]. The report recommends reforming the EU’s next
Framework Programme for R&I in terms of its focus, budget allocation, governance and financial capacity. First, the
programme should be refocused on a smaller number on commonly agreed priorities. Second, an increased share of
the budget allocation should be allocated towards financing disruptive innovation and, to make efficient use of this
funding, the EIC should be reformed to become a genuine “ARPA-type agency”, supporting high-risk projects with
the potential of delivering breakthrough technological advances. Third, the governance of the programme should
be managed by project managers and by people with proven track record at the frontier of innovation and – to
maximise access for young, innovative companies – application processes should be faster and less bureaucratic.
The organisation of the programme should be redesigned and streamlined to become more outcome-based and
efficient. Finally, conditional on reforms, the budget of the new Framework Programme should be doubled to EUR
200 billion per 7 years.
In parallel, better coordination of public R&I across Member States is necessary. A Research and Innova-
tion Union should be established and lead to a joint formulation of a common European R&I strategy and policy.
To improve coordination, the EU could promote a “European Research and Innovation Action Plan”, designed by
Member States, together with the Commission, the research community, and stakeholders from the private sector.
It is also essential to establish and consolidate European academic institutions at the forefront of global
research. The European Research Council (ERC) has been crucial to the competitiveness of European science
but many promising proposals remain unfunded owing to a lack of financial resources. The report recommends
doubling the support for fundamental research through the ERC, significantly increasing the number of grant recip-
ients without diluting the amount they receive. In parallel, the EU should introduce an excellence-based, highly
competitive “ERC for Institutions” programme to provide the required resources for academic institutions. A new
regime for world-class researchers (“EU Chair” position) is also proposed, to attract and retain the best academic
scholars by hiring them as European officials. This regime should be supported by a new EU framework for private
funding to enable public universities and research centres to design more competitive compensation policies fortop
talents and to provide additional supportfor research. Beyond academic institutions, increased funding and stronger
coordination is required to develop world-leading research and technological infrastructures, when scale is needed.
Europe needs to make it easier for “inventors to become investors” and facilitate scaling up of successful
ventures. The EU should become as attractive for inventors as other leading regions for innovation. The report
recommends a number of measures to support the transition from invention to commercialisation in Europe. First,
to overcome bureaucratic barriers in universities and research institutions to managing intellectual property rights
with their researchers, a new blueprint for fair and transparent royalty sharing is recommended. Second, to lower
application costs foryoung companies and to offer uniform protection of intellectual property, it is proposed to adopt
the Unitary Patent in all EU Member States. Third, the EU should carry out a thorough impact assessment ofthe effect
of digital and other regulation on small companies, with the aim of excluding SMEs from regulations that only large
companies are able to complywith. Finally, the EU should support rapid growth within the European market by giving
innovative start-ups the opportunity to adopt a new EU-wide legal statute (the “Innovative European Company”).
This status would provide companies with a single digital identity valid throughout the EU and recognised by all
Member States. These companies would have access to harmonised legislation concerning corporate law and insol-
vency, as well as a few key aspects of labour law and taxation, to be made progressively more ambitious, and they
would be entitled to establish subsidiaries across the EU without incorporating separately in each Member State.
A better financing environment for disruptive innovation, start-ups and scale-ups is needed as barriers
to growth within the European markets are removed [see the chapters on innovation, and investment]. While
high-growth companies can typically obtain finance from international investors, there are good reasons to further
develop the financing ecosystem within Europe. Very early-stage innovation would benefit from a deeper pool of
angel investors. Ensuring sufficient local capital to fund scale-ups would concentrate the spillovers of innovation
within Europe. Increasing the appeal of European stock markets for IPOs would improve funding options forfounders,
encouraging more start-up activity in the EU. To generate a significant increase in equity and debt funding available
to start-ups and scale-up, the report proposes the following measures. First, expanding incentives for business
29
THE FUTURE OF EUROPEAN COMPETITIVENESS — PART A | CHAPTER 2](https://image.slidesharecdn.com/thefutureofeuropeancompetitivenessacompetitivenessstrategyforeurope-240910144201-24597139/75/The-future-of-European-competitiveness-_-A-competitiveness-strategy-for-Europe-pdf-31-2048.jpg)
![“angels” and seed capital investors. Second, assessing whether further changes to capital requirements under
Solvency II are warranted, which establishes capital adequacy rules for insurance companies, and issuing guide-
lines for EU Pension Plans, with the aim of stimulating institutional investment in innovative companies in selected
sub-sectors. Third, increasing the budget ofthe European Investment Fund (EIF), which is part ofthe EIB Group and
provides finance to SMEs, improving coordination between the EIF and the EIC, and eventually rationalising the VC
funding environment in Europe. Finally, enlarging the mandate ofthe EIB Group to enable co-investment in ventures
requiring larger volumes of capital, while also enabling it to take on more risk to help “crowd in” private investors.
The EU has a unique opportunity to lower the cost of AI deployment by increasing computational capacity
and making available its network of high-performance computers [see the chapter on digitalisation and
advanced technologies]. Since the launch of the Euro-HPC Joint Undertaking in 2018, the EU has created a large
public infrastructure for computing capacity located across six Member States, which is one-of-a-kind globally. Three
of its supercomputers are in the top ten worldwide and the launch oftwo exascale computers is planned. While so far
this capacity has been mostly used for scientific research, the Commission is progressively opening itto AI start-ups,
SMEs and the broader AI community. The report recommends building on this initiative by significantly increasing
the computing capacity dedicated to the training and algorithmic development of AI models in HPC centres. At the
same time, the EU should finance the expansion of Euro-HPC to additional cloud and storage capabilities to support
AI training in multiple locations. A “federated AI model” should be developed based on cooperation between public
and private infrastructures to provide AI training power and cloud services to increase the EU’s competitive scale.
To help finance the additional resources invested in the network, it is recommended to create an EU-wide frame-
work allowing public sector “computing capital” to be provided to innovative SMEs in exchange for financial returns.
For example, public HPC facilities or research centres could offer free computing capacity in exchange for equity
options, royalties or dividends to be reinvested in capacity and maintenance.
The EU should promote cross-industry coordination and data sharing to accelerate the integration of AI into
European industry. Developing AI verticals hinges on industrial players working togetherwith AI researchers and the
private sector to enable problem definition across different sectors. For instance, discovering whether an innovative
product can be developed by a factory using an AI-powered digital twin requires replication ofthe factory, its robots,
processes and the overlay of an AI algorithm. To facilitate this cooperation, EU companies should be encouraged to
participate in an “AI Vertical Priorities Plan”. The aim of this plan would be to accelerate AI development across the
ten strategic sectors where EU business models will benefit most from rapid AI introduction (automotives, advanced
manufacturing and robotics, energy, telecoms, agriculture, aerospace, defence, environmental forecasting, pharma
and healthcare). Companies that participate in the plan would benefit from EU funding for model development
and a specific set of exemptions regarding competition and AI experimentation. In particular, to overcome the EU’s
lack of large data sets, model training should be fed with data freely contributed by multiple EU companies within
a certain sector. It should be supported within open-source frameworks, safeguarded from antitrust enforcement
by competition authorities. Experimentation should be encouraged via the opening up, EU-wide coordination and
harmonisation of national “AI Sandbox regimes” to companies participating in the plan. These experimental “sand-
boxes” would enable regular assessments of regulatory hindrances deriving from EU or national legislation and
provide feedback from private companies and research centres to regulators.
Given the dominance of US providers, the EU must find a middle way between promoting its domestic cloud
industry and ensuring access to the technologies it needs. It is too late for the EU to try and develop systematic
challengers to the major US cloud providers: the investment needs involved are too large and would divert resources
awayfrom sectors and companies where the EU’s innovative prospects are better. However, for reasons of European
sovereignty, the EU should ensure that it has a competitive domestic industry that can meet the demand for “sover-
eign cloud” solutions. To achieve this goal, the report recommends adopting EU-wide data security policies for
collaboration between EU and non-EU cloud providers, allowing access to US hyperscalers’ latest cloud technolo-
gies while preserving encryption, security and ring-fenced services for trusted EU providers. At the same time, the
EU should legislate mandatory standards for public sector procurement, thereby levelling the playing field for EU
companies against larger non-EU players. Outside of “sovereign” market segments, it is recommended to negotiate
a low barrier “digital transatlantic marketplace”, guaranteeing supply chain security and trade opportunities for EU
and US tech companies on fair and equal conditions. To make these opportunities equally attractive beyond large
tech companies, SMEs on both sides of the Atlantic should benefit from the same easing of regulatory burdens for
small companies that is proposed above.
30
THE FUTURE OF EUROPEAN COMPETITIVENESS — PART A | CHAPTER 2](https://image.slidesharecdn.com/thefutureofeuropeancompetitivenessacompetitivenessstrategyforeurope-240910144201-24597139/75/The-future-of-European-competitiveness-_-A-competitiveness-strategy-for-Europe-pdf-32-2048.jpg)
![Facilitating consolidation in the telecoms sector is needed to deliver higher rates of investment in connec-
tivity [see the chapters on digitalisation and advanced technologies, and competition policy]. The cornerstone
initiative is modifying the EU’s stance towards scale and consolidation of telecoms operators to deliver a true Single
Market, without sacrificing consumer welfare and quality of service. To encourage consolidation, the report recom-
mends defining telecoms markets at the EU level – as opposed to the Member State level – and increasing the
weight of innovation and investment commitments in the EU’s rules for clearing mergers. Country-level ex ante
regulation should be reduced in favour of ex post competition enforcement in cases of abuse of dominant position.
It is also proposed to harmonise EU-wide spectrum licensing rules and processes and to orchestrate EU-wide
auction design features to help create scale. To ensure that EU players remain at the forefront of new technological
developments, it is recommended to establish an EU-level bodywith public-private participation to develop homog-
enous technical standards for the deployment of network APIs and edge computing, as was the case for roaming in
the 1990s. To increase the capacity of EU operators to invest in these technologies, it is recommended to support
commercial investment sharing between network owners and Very Large Online Platforms that use EU data networks
to a massive extent but do not contribute to financing them.
Sustaining and expanding R&I will also be crucial for key manufacturing sectors such as pharma [see the
chapter on pharma]. Opening up the secondary use of health data for research purposes has significant poten-
tial to anchor pharma R&I activities within the EU. The report therefore recommends accelerating the digitisation
of health systems and the European Health Data Space (EHDS), achieved through EU-level support for national
investments which facilitate access to and sharing of electronic health records. In addition, it is proposed to further
scale up genome sequencing capacities in the EU and to present a strategic blueprint beyond 2026, building on
the European 1+ Million Genomes initiative. To maximise the opportunities ofthe EHDS, itwill be importantto provide
clear and timely guidance on the use of AI in the lifecycle of medicines, in particular analysis of ‘raw’ clinical data
transmitted to the European Medicines Agency and data collected for pharmacovigilance purposes. In parallel,
regulators should aim to boost the attractiveness of the EU for conducting clinical trials and to expedite access
to markets for novel medicines. These goals can be supported, among other things, by reviewing rules for studies
combining medicines with medical devices and the application of AI and streamlining guidance across different
agencies to industry on unmet medical needs, the design of clinical trials and the use of real-world evidence. Finally,
to compensate for the financing gap in pharma, EU funding should be refocused on the development of a limited
number ofworld-class innovation hubs in life sciences for advanced therapy medicinal products. The pharma sector
would also benefit from the proposals for financing innovation.
31
THE FUTURE OF EUROPEAN COMPETITIVENESS — PART A | CHAPTER 2](https://image.slidesharecdn.com/thefutureofeuropeancompetitivenessacompetitivenessstrategyforeurope-240910144201-24597139/75/The-future-of-European-competitiveness-_-A-competitiveness-strategy-for-Europe-pdf-33-2048.jpg)
![Closing skills gaps
Europe is suffering from skills gaps across the economy, reinforced by a declining labour force [see the
chapter on skills]. The European economy displays from persistent skills shortages in several sectors and occupa-
tions, for both low- and high-skilled workers [see Figure 10]. Around one-quarter of European companies have faced
difficulties in finding employees with the right skills, while another half report some difficulties. 77% of EU companies
report that even newly recruited employees do not have the required skills. Skills are also lacking at the managerial
level. The uneven adoption of basic management practices – especiallythose needed to manage human capital – is
likely responsible for the sluggish adoption of ICT in the EU in the late 1990s and the 2000s, especially among micro
and small companies08
. While challenges related to skills shortages are widespread across advanced economies,
the need to address them is particularly acute in the EU. Demographic headwinds imply a shrinking labour force in
Europe, while the US population is projected to expand in the coming decades. In this setting, a European strategy
to address skills gaps – focused on all stages of education – is essential. Many of the skills gaps can be traced back
to the underuse of existing talent, as witnessed by deep gender gaps in some occupations.
FIGURE 10
Skills shortages in the EU
Job vacancy rate (% of total posts)
Source: Eurostat
Skills shortages are acting as a barrier to innovation and technology adoption and could potentially hinder
decarbonisation as well. Europe produces high quality talent in the fields of science, technology, engineering
and maths (STEM) but their supply is limited. The EU turns out around 850 STEM graduates per million inhabitants
per year compared to more than 1,100 in the US. Moreover, the EU’s talent pool is depleted by brain drain overseas
owing to more and better employment opportunities elsewhere. Skills are also lacking to diffuse digital technologies
faster through the economy and to enable workers to adapt to the changes these technologies will bring. Almost
60% of EU companies report that lack of skills is a major barrier to investment and a similar share report difficulties
in recruiting ICT specialists. At the same time, European workers are generally unprepared to take advantage of the
widespread digitalisation of work: around 42% of Europeans lack basic digital skills, including 37% of those in the
workforce09
. Decarbonisation will also require new skills sets and job profiles. The rates of job vacancies for clean tech
manufacturing in the EU doubled between 2019 and 2023, with 25% of EU companies reporting labour shortages in
the third quarter of 2023. Shortages of high-skilled workers are likely to become more acute over time. Projections
to 2035 indicate that labour shortages will be most pronounced in high-skilled, non-manual occupations – i.e. those
requiring high level of education – driven by replacement needs owing to retirements and the changing demands
of the labour market.
08. See, among others, Bloom, Sadun and Van Reenen (2012) and Schivardi and Schmitz (2020) for evidence on
cross-country variation in managerial practices, and their impact on aggregate productivity.
09. The EU Digital Decade set out to ensure 80% of working age Europeans have basic digital skills by 2030.
32
THE FUTURE OF EUROPEAN COMPETITIVENESS — PART A | CHAPTER 2](https://image.slidesharecdn.com/thefutureofeuropeancompetitivenessacompetitivenessstrategyforeurope-240910144201-24597139/75/The-future-of-European-competitiveness-_-A-competitiveness-strategy-for-Europe-pdf-34-2048.jpg)


![implies the massive deployment of clean energy sources with low marginal generation costs, such as renewables
and nuclear. Specific EU regions are endowed with high potential for cost-competitive renewable energy sources:
for instance, solar in Southern Europe and wind in the North and Southeast. Renewable energy deployment in
Europe is already rising, reaching around 22% of the EU’s gross final energy consumption in 2023, compared with
14% in China and 9% in the US. At the same time, Europe has strong innovative potential to meet rising domestic and
global demand for clean energy solutions. Although Europe is weak in digital innovation, it is a leader in clean tech
innovation [see Figure 2]. This presents opportunities: according to the International EnergyAgency (IEA), more than
one-third ofthe required CO2
emission reductions globally in 2050 rely on technologies currently atthe demonstra-
tion or prototype phaseiii
. The electrification of the European energy system will also be an enabler of growth for the
EU’s sustainable transport sector. EU companies are “first-movers” in other sub-sectors of sustainable transport. For
example, the EU holds 60% of global high-value patents and tops global rankings of the most innovative companies
for low-carbon fuels, which are essential for the decarbonisation of aviation and maritime transport in the medium
term and also, potentially, for heavy-duty vehicles.
FIGURE 2
The EU’s position in complex (digital and green) technologies
Notes: The results are based on an analysis of patent data to understand the complexity and potential for specialisation in different technology areas. On the
y-axis, technologies are ranked according to how advanced or complexthey are, with scores ranging between 0 (less complex) and 100 (more complex). The
x-axis (showing the relatedness density) represents how easily a country can build comparative advantage in a particular technology, depending on how
closely related it is to other technologies the country is already strong in. The size of the bubbles shows how much each country has already specialised in a
technology, using a measure of “revealed comparative advantage”(RCA), which reflects their competitive strenght in that field.
Source: European Commission, DG RTD.
However, it is not guaranteed that EU demand for clean tech will be met by EU supply given increasing
Chinese capacity and scale. The EU aims to achieve a minimum of42.5% of its energy consumption from renewable
sources by 2030, which will require it to nearly triple its installed capacity for solar PV and more than double its wind
power capacity. In addition, the EU has effectively abolished the internal combustion engine from 2035, when all
new passenger cars and light dutyvehicles registered in Europe must have zero tailpipe emissions. Based on current
policies, Chinese technology may represent the lowest-cost route to achieving some of these targets. Owing to a
fast pace of innovation, low manufacturing costs and state subsidies four times higher than in other major econo-
miesiv
, the country is now dominating global exports of clean technologies. Significant overcapacity is expected: by
2030 at the latest, China’s annual manufacturing capacity for solar photovoltaic (PV) is expected to be double the
level of global demand, and for battery cells it is expected to at least cover the level of global demand. Production
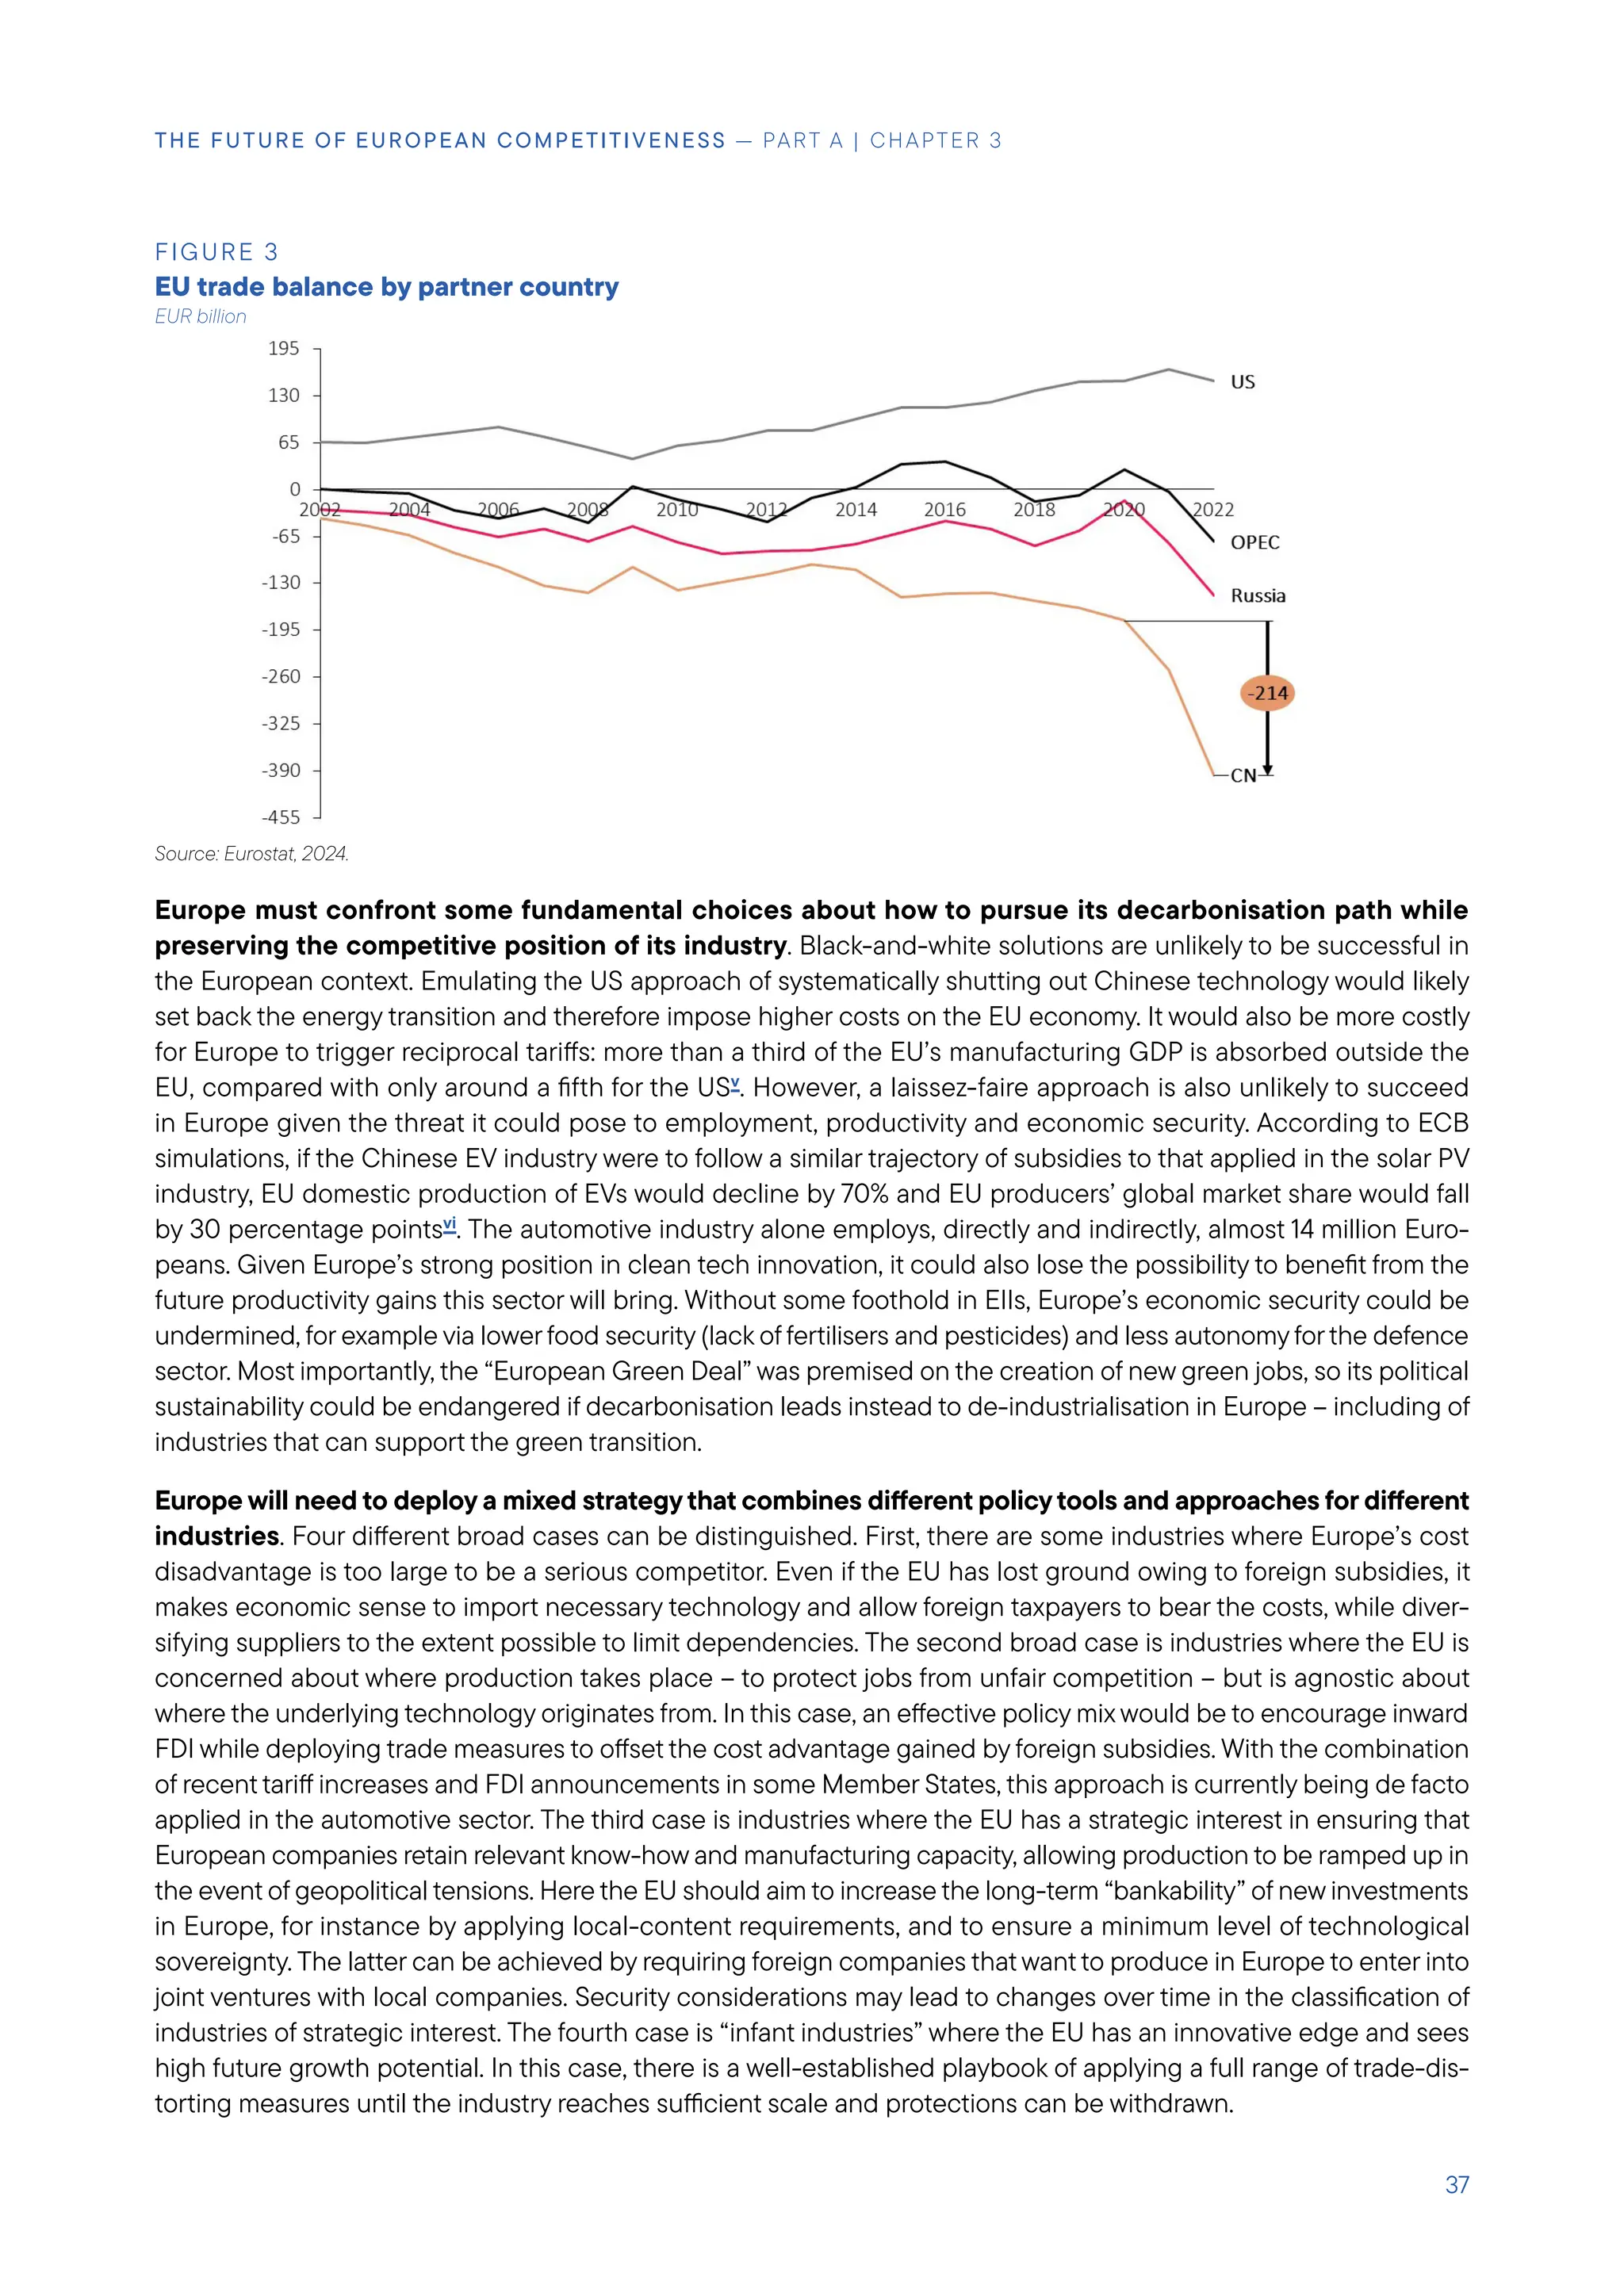
of EVs is expanding at a similar pace. The EU is already seeing a sharp deterioration in its trade balance with China,
reflecting in particular imports of EVs, batteries and solar PV products [see Figure 3]. While rising bankruptcies in
China suggest that the economy is entering a phase of industrial consolidation, overcapacities are likely to persist,
especially given ongoing weaknesses in household consumption and high saving rates. Moreover, in response to
perceived unfair competition, an increasing number of countries are raising tariff and non-tariff barriers against
China, which will re-direct Chinese overcapacity towards the EU market. In May, the US announced significant hikes
in tariffs against a range of products.
36
THE FUTURE OF EUROPEAN COMPETITIVENESS — PART A | CHAPTER 3](https://image.slidesharecdn.com/thefutureofeuropeancompetitivenessacompetitivenessstrategyforeurope-240910144201-24597139/75/The-future-of-European-competitiveness-_-A-competitiveness-strategy-for-Europe-pdf-38-2048.jpg)

![The root cause of high energy prices
Structural causes are at the heart of the energy price gap and may be exacerbated by both old and new
challenges [see the chapter on energy]. The price differential vis-à-vis the US is primarily driven by Europe’s lack of
natural resources, as well as by Europe’s limited collective bargaining power despite being the world’s largest buyer
of natural gas. However, the gap is also caused by fundamental issues with the EU’s energy market. Infrastructure
investment is slow and suboptimal, both for renewables and grids. Market rules prevent industries and households
from capturing the full benefits of clean energy in their bills. Financial and behavioural aspects of derivative markets
have driven higher price volatility. Higher energy taxation than other parts of the world adds a tax wedge to prices.
Moreover, while these structural issues have been exacerbated by the energy crisis of the past two years, future
crises may bring them to the fore again. Tensions in gas markets are expected to ease thanks to new global supply
capacity coming online, but the EU energy system will have to cope with electrification and new security of supply
needs.
The EU is the largest global gas and LNG importer, yet its potential collective bargaining power is not
being sufficiently leveraged and relies excessively on spot prices, threatening Europe with more volatile
natural gas prices01
. This lack of leverage is notable especially in the case of pipeline gas, where the possibility of
rerouting gas flows is more limited as shown by the latest unsuccessful efforts by Russia. During the 2022 crisis, for
example, intra-EU competition for natural gas between actors willing to pay high prices contributed to an excessive
and unnecessary rise in prices. In response, the EU introduced a coordination mechanism to aggregate and match
demand with competitive supply offers (AggregateEU), butthere is no obligation for joint purchasing on the platform.
At the same time, although natural gas prices have fallen considerably from their peaks during the energy crisis, the
EU faces an increasingly volatile outlook. With the loss of access to Russian pipeline gas, 42% of EU gas imports
arrived as LNG in 2023, up from 20% in 2021. LNG prices are typically higherthan pipeline gas on spot markets owing
to liquification and transportation costs. Moreover, with the reduction of pipeline supply from Russia, more gas is
being bought on LNG spot markets both in the EU and globally leading to stronger competition. Even gas bought
in long-term contracts is largely indexed to spot markets, which are increasingly influenced by supply disruptions
and demand patterns in Asia.
Financial and behavioural aspects of gas derivative markets can exacerbate this volatility and amplify the
impact of shocks. A few non-financial corporates undertake most trading activity in European gas markets. Recent
evidence presented by the European Securities Markets Agency (ESMA) suggests that there is significant concen-
tration both at position and trading venue level and that concentration increased in 2022 during largest spike
in natural gas prices. The top 5 companies hold around 60% of positions in some trading venues and their short
positions increased considerably by almost 200% between February and November 2022 [see Figure 4]vii
. Super-
vision of these companies’ activities could be improved. While regulated financial entities (for example, investment
banks, investment funds and clearing market participants) are covered by conduct and prudential rules, many of
the companies that trade commodity derivatives can rely on exemptions. In particular, when a commodity compa-
ny’s main activities are not trading, they can be exempted from authorisation as a supervised investment company
(so-called “ancillary” exemptions). The US has a stricter approach. Exemptions apply on some types of contracts, but
commodity companies are not exempted from supervision, allowing for a more precise level of scrutiny. In addition,
energy commodities are subject to position limits, including Henry Hub natural gas contracts.
01. AggregateEU is a first step in demand aggregation allowing the pooling of demand, the coordination of infrastructure use and
negotiation with international partners, fostering more centralised EU joint purchasing to further leverage the EU’s market power.
39
THE FUTURE OF EUROPEAN COMPETITIVENESS — PART A | CHAPTER 3](https://image.slidesharecdn.com/thefutureofeuropeancompetitivenessacompetitivenessstrategyforeurope-240910144201-24597139/75/The-future-of-European-competitiveness-_-A-competitiveness-strategy-for-Europe-pdf-41-2048.jpg)
![FIGURE 4
Market concentration in EU gas derivatives markets
Europe’s market rules pass on this volatility to end users and may prevent the full benefits of decarbonising
power generation from reaching them. Even as Europe reduces its dependence on natural gas and increases
investment in clean energy generation, its market rules in the power sector do notfully decouple the price of renew-
able and nuclear energyfrom higher and more volatile fossil fuel prices, preventing end users from capturing the full
benefits of clean energy in their bills [see Figure 5]. In 2022 atthe peak ofthe energy crisis, natural gas was the price-
setter 63% of the time, despite making up only 20% share of the EU’s electricity mix. The use of long-term contract
solutions – like Power Purchase Agreement (PPA) markets or Contracts for Difference (CfDs) – can help attenuate the
link between the marginal price setter and the cost of energy for end users, but such solutions are underdeveloped
in Europe, in turn limiting the benefits from accelerating the roll-out of renewables. In the absence of action, this
decoupling problem will remain acute at least for the remainder of this decade. Even if renewable installation targets
are met, it is notforecastto significantly reduce the share of hours during which fossil fuels set energy prices by 2030.
FIGURE 5
Price-setting technology per Member State and their generation mix
%, 2022
Source: European Commission (JRC), 2023
Note: Market share of natural gas by venue in % of reported notionals,
excluding central counterparties and clearing members. The figure shows
that the top-5 and top-10 EU counterparties (in terms of gross notionals)
accounted for more than 50% and 60% respectively of reported notionals by
EU entities on each ofthetwo EU gas regulated markets. Data as ofNovember
2022. OI: Open Interest. TV: Trading Venue. OTC: Over-the-counter.
Sources: Trade repositories (TRs), Bank of England, ESMA.
Note: Absolute value of net positions in EUR billion for the top five long and
short non-financial corporate counterparties and positions in % of average
daily trading volume, in % rhs. The high concentration of positions indicates
that if several firms with similar directional positions were to reduce their
exposures, they could amplify market moves.
Sources: EMIR, ESMA.
40
THE FUTURE OF EUROPEAN COMPETITIVENESS — PART A | CHAPTER 3](https://image.slidesharecdn.com/thefutureofeuropeancompetitivenessacompetitivenessstrategyforeurope-240910144201-24597139/75/The-future-of-European-competitiveness-_-A-competitiveness-strategy-for-Europe-pdf-42-2048.jpg)
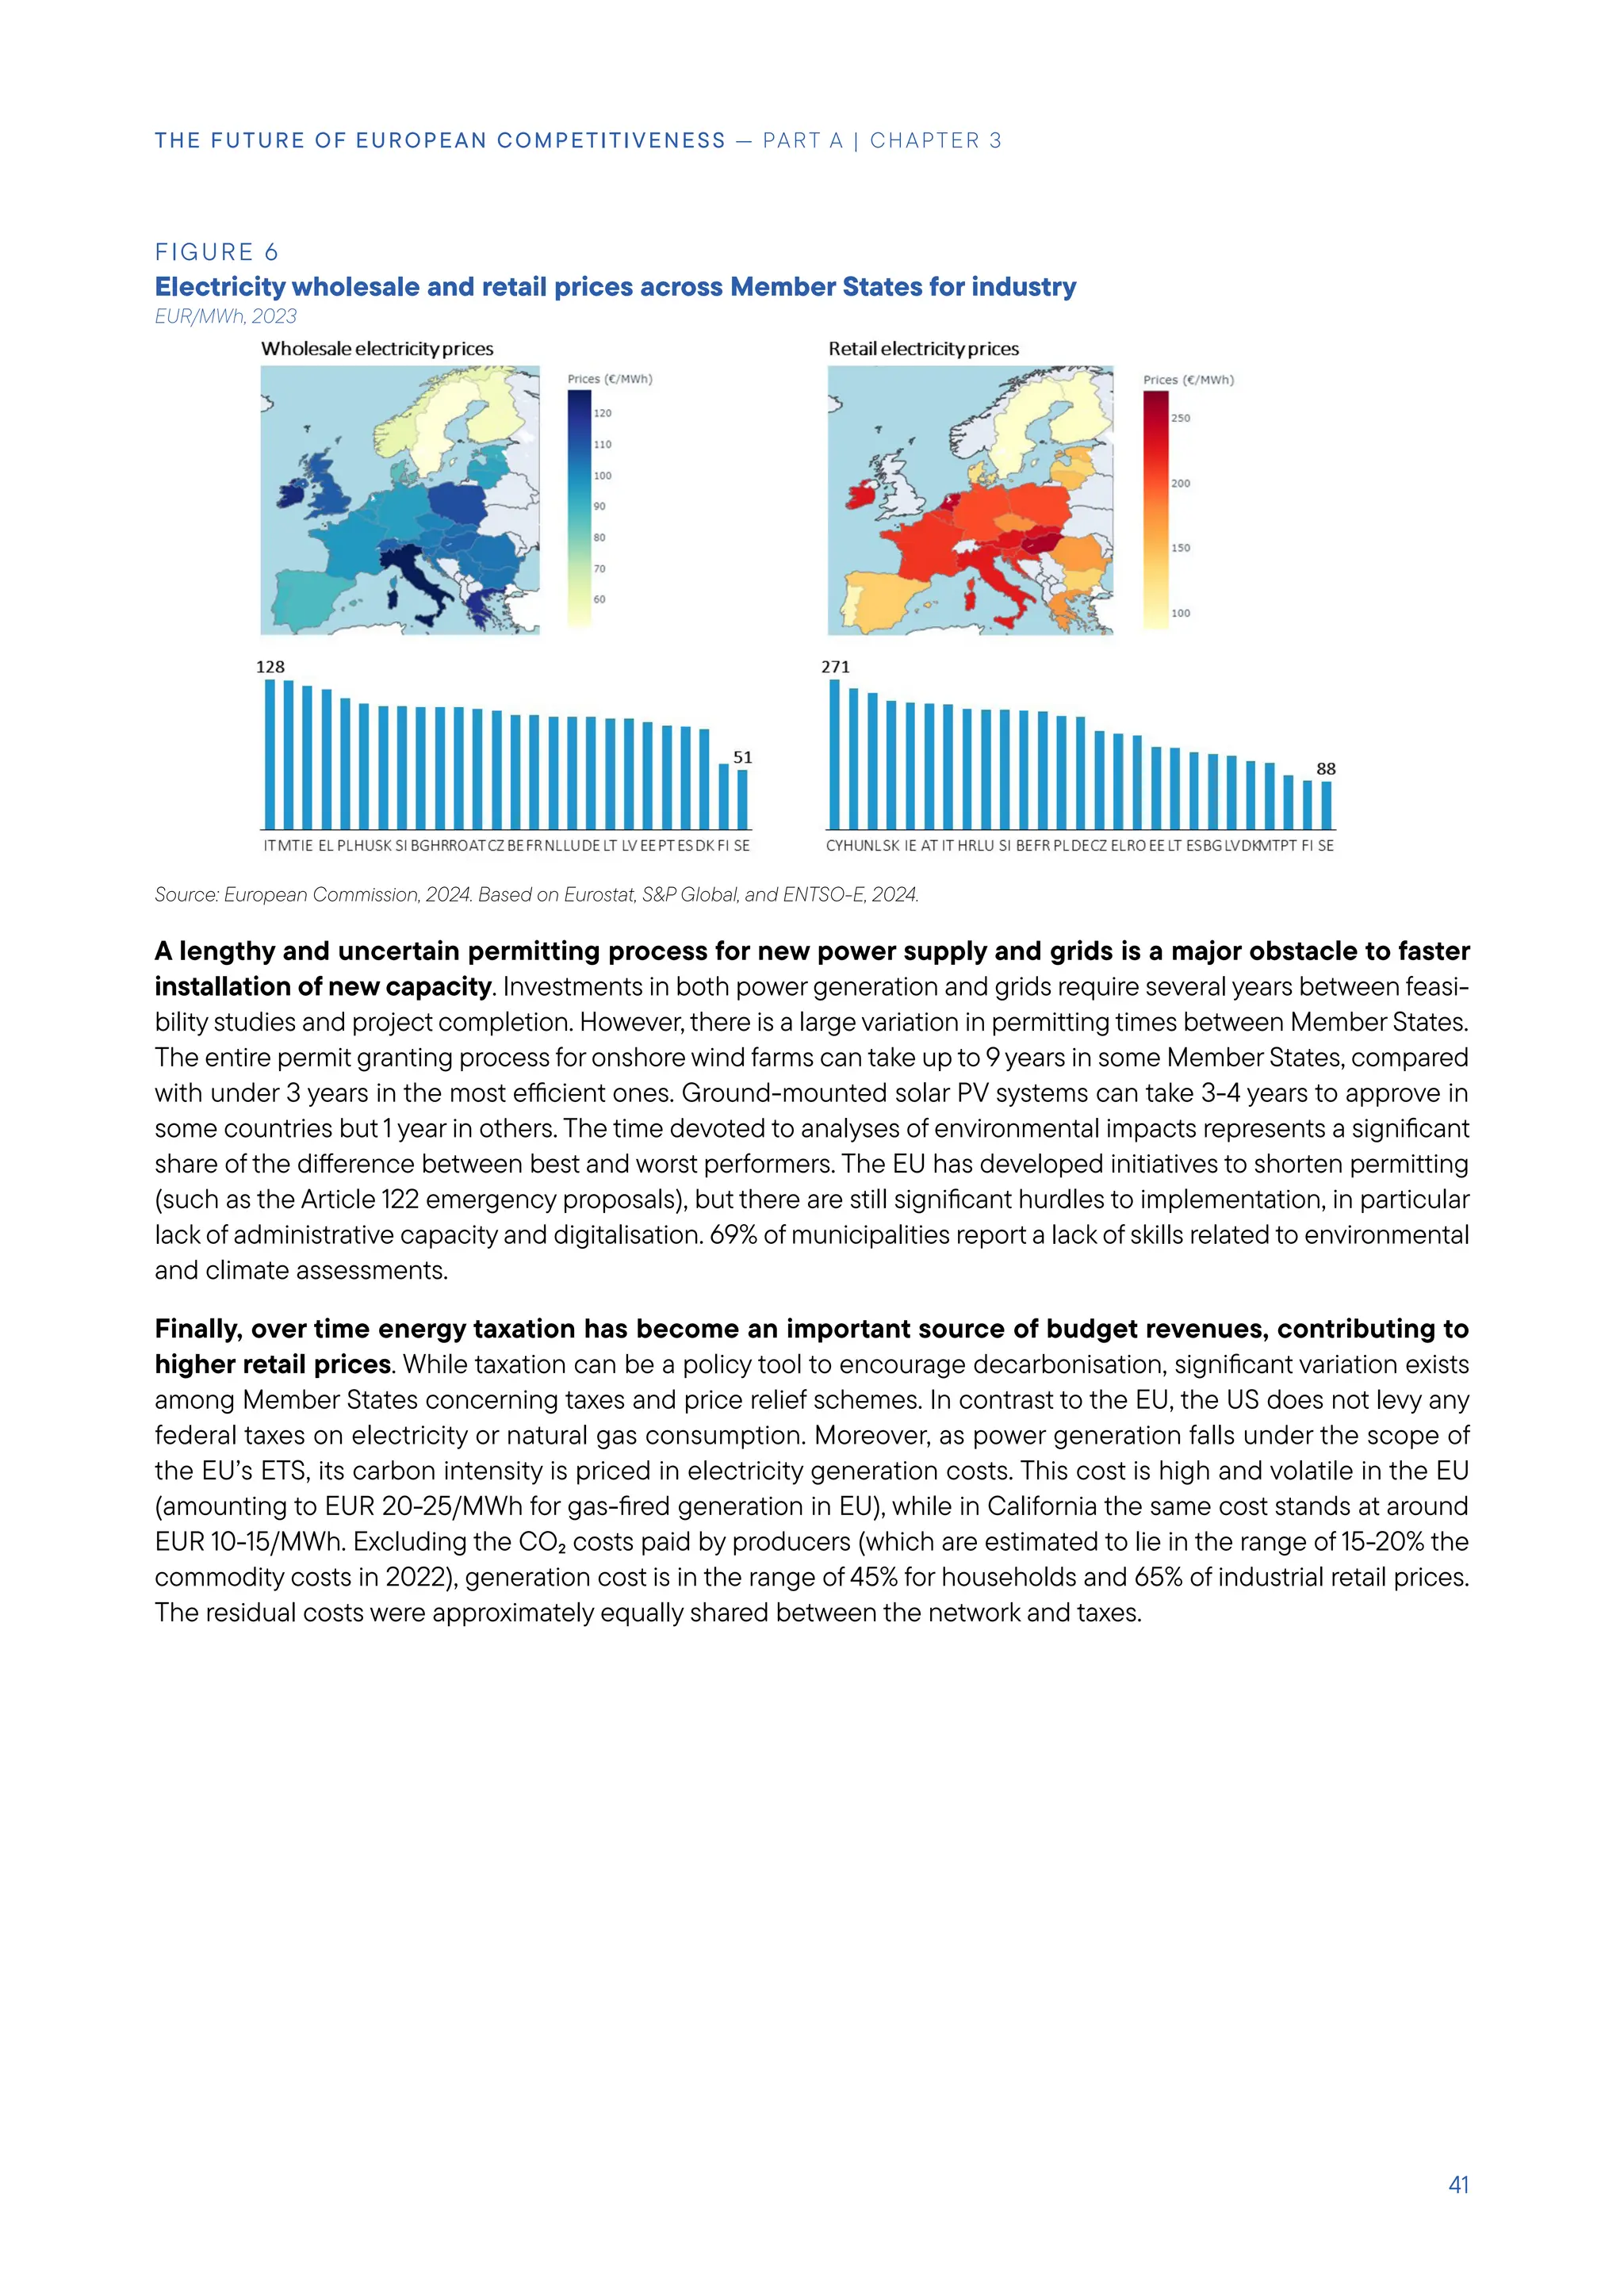
![The threat to Europe’s clean tech sector
Although Europe is a world leader in clean tech innovation, it is squandering early-stage advantages owing
to the weaknesses in its innovation ecosystem [see the chapter on clean technologies]. More than one-fifth of
clean and sustainable technologies worldwide are developed in the EU and the pipeline is still strong: around half
of EU clean tech innovations at a launch or early revenue stage, 22% at scale-up stage and 10% already matureviii
.
However, since 2020 patenting in low-carbon innovation has slowed down in Europe, while in recentyears the sector
has seen its early-stage advantages being challenged. For example, from 2015 to 2019 the EU represented 65% of
global early-stage VC for hydrogen and fuel cells, but this share declined to 10% from 2020 to 2022. The clean tech
sector is suffering from the same barriers to innovation, commercialisation and scaling up in Europe that afflict the
digital sector: a total of 43% and 55% of medium and large companies, respectively, cite consistent regulation within
the Single Market as the main way to foster commercialisation, while 43% of small companies identify lack of finance
as an obstacle to growthix
. As in the digital sector, the lower capacity of EU clean tech companies to scale up leads
to a gap between the EU and US in later-stage funding.
Europe’s innovation potential is not translating into manufacturing superiority for clean tech, despite the
size of its domestic market. The EU is the second largest market in terms of demand for solar PV, wind and EVs.
In many of these sectors, the EU has enjoyed an industrial “first-mover” advantage and has established leadership,
but it has not been able to maintain that lead consistently. In certain sectors, such as solar PV, the EU has already
lost its manufacturing capacities, with production now dominated by China [see Figure 7]. In others, such as wind
power generation equipment, Europe has a solid position but is facing increasing challenges. For example, although
Europe retains primacy in wind turbine assembly – serving 85% of domestic demand and acting as a net exporter –
it has lost significant market shares to China in last few years, declining from 58% in 2017 to 30% in 2022. In several
sectors the EU retains its technological edge, such as electrolysers and carbon capture and storage. But many EU
players still prefer to produce at scale in China owing to higher construction costs in Europe, permitting delays and
more restricted access to critical raw materials. For example, electrolyser production requires at least40 raw materials
and the EU currently produces just 1-5% of these domestically. Overall, despite the EU’s ambition to maintain and
develop clean tech manufacturing capacity, there are multiple signs of an evolution in the opposite direction, with
EU companies announcing production cuts, shutdowns and partial or full relocation.
FIGURE 7
Clean technology manufacturing capacity by region
%, 2021
Source: European Commission, 2024. Based on IEA, Bruegel.
42
THE FUTURE OF EUROPEAN COMPETITIVENESS — PART A | CHAPTER 3](https://image.slidesharecdn.com/thefutureofeuropeancompetitivenessacompetitivenessstrategyforeurope-240910144201-24597139/75/The-future-of-European-competitiveness-_-A-competitiveness-strategy-for-Europe-pdf-44-2048.jpg)
![The challenges of asymmetric decarbonisation
“Hard-to-abate” industries are suffering not onlyfrom high energy prices, but also from lack of public support
to reach decarbonisation targets and investment in sustainable fuels [see the chapters on energy-intensive
industries, and transport]. Despite the massive investment needs facing Energy Intensive Industries (EIIs), and the
challenging business case for investment in “hard-to-abate” sectors, there is limited public supportforthe transition
in Europe. Only a residual share of current ETS resources is earmarked to EIIs, with priority given to residential effi-
ciency, renewables development or, recently, lowering energy bills. While EIIs in other regions face neither the same
decarbonisation targets nor require similar investments, they benefit from more generous state support. China, for
example, provides over 90% of the global USD 70 billion subsidies in the aluminium sector, as well as large subsidies
for steel. Decarbonisation is also a competitive disadvantage for the “hardest-to-abate” parts of the transport sector
(aviation and maritime). Extra-EU flights and sea journeys are partly excluded from the ETS, meaning the prices of
these journeys do not yet reflect their climate impact. Consequently, there is a risk of carbon leakage and business
diversion from transport hubs in the EU to those in the EU’s neighbourhood, unless effective solutions for ensuring
a level playing field are found at the international level. At the same time, although low-carbon fuels will be critical
for the decarbonisation of these industries, ramping up the marginal production capacity that exists today is chal-
lenging. In particular, the EU needs to start building a supply chain for alternative fuels, or the costs of meeting its
targets will be significant.
Overall, transport can play a critical role in the decarbonisation of the EU economy, but whether it proves
to be an opportunity for Europe depends on planning. Transport accounts for one-quarter of all greenhouse
gas emissions and unlike other sectors, CO2
emissions from transport are still higher than in 1990 [see Figure 8].
However, lack of EU-level planning fortransport competitiveness is hindering the ability of Europe to capitalise on the
possibilities of multimodal transportto lower carbon emissions. Sustainable mobility requires an integrated approach
towards energy networks, charging infrastructures, standardisation of manufacturing equipment, telecoms (including
satellite and navigation technologies) and financing. Yet while transport is part of the Commission’s 2040 Climate
Target Plan, it is excluded from the mandatory National Energy and Climate Plans where Member States outline their
strategies to execute decarbonisation. This lack of coordination results, for example, in a precise and binding regu-
latory framework for carmakers and corporate logistics, increasing the demand for EVs and charging infrastructure,
without an analogous obligation for energy providers to supply stable and powerful grid access of sufficient capacity.
The transition to sustainable mobility is further hindered by lack of interoperability of infrastructures and of technical
requirements forthe deployment offleets and equipment, as well as limited uptake of digitalisation. Only1% of cross-
border maritime operations and 5% of rail transport operations in Europe are fully paperless02
.
02. Differences exist across single modes, with 40% of information exchange taking place electronically in aviation,
5% in rail and less than 1% in road and maritime. European Environment Agency, Transport and environment
report 2022, Digitalization in the mobility system: challenges and opportunities, 2022.
44
THE FUTURE OF EUROPEAN COMPETITIVENESS — PART A | CHAPTER 3](https://image.slidesharecdn.com/thefutureofeuropeancompetitivenessacompetitivenessstrategyforeurope-240910144201-24597139/75/The-future-of-European-competitiveness-_-A-competitiveness-strategy-for-Europe-pdf-46-2048.jpg)
![FIGURE 8
Evolution of greenhouse gas emissions by sector in the EU
Greenhouse gas emission1
, Index 1990=1
Notes: 1 Excluding LULUCF emissions and international maritime, including international aviation and indirect CO2. 2 Excluding international maritime (inter-
national traffic departing from the EU), including international aviation. 3 Emissions from Manufacturing and Construction, Industrial Processes and Product
Use. 4 Emissions from Fuel Combustion and other Emissions from Agriculture.
Source: European Commission, 2023
The automotive sector is a key example of lack of EU planning, applying a climate policy without an indus-
trial policy [see the chapter on automotive]. The technology neutrality principle has not always been applied in
the automotive sector. The ambitious target of zero tailpipe emissions by 2035 will lead to a de facto phasing out
of new registrations of vehicles with internal combustion engines and the rapid market penetration of EVs. Yet, the
EU has not followed up these ambitions with a synchronised push to convert the supply chain. For example, the
Commission only launched the European Battery Alliance to build a battery value chain in Europe in 2017, while
Europe as a whole is far behind on installing charging infrastructure. China, by contrast, has been focusing on the
full EV supply chain since 2012 and, as a result, it has moved faster and at a larger scale and is now one generation
ahead in EV technology in virtually all domains, while also producing at lower cost. European companies are already
losing market share and this trend may accelerate as shipping bottlenecks are overcome [see Figure 9]. Chinese
carmakers’ market share for EVs in Europe rose from 5% in 2015 to almost 15% in 2023, while the share of European
carmakers in the European EV market fell from 80% to 60%.
FIGURE 9
Electric car imports to Europe by country of production and manufacturer headquarters
Thousand vehicles, 2021-2022
Source: IEA, 2023
45
THE FUTURE OF EUROPEAN COMPETITIVENESS — PART A | CHAPTER 3](https://image.slidesharecdn.com/thefutureofeuropeancompetitivenessacompetitivenessstrategyforeurope-240910144201-24597139/75/The-future-of-European-competitiveness-_-A-competitiveness-strategy-for-Europe-pdf-47-2048.jpg)
![A joint plan for decarbonisation
and competitiveness
The first key goal for the energy sector is to lower the cost of energy for end users by transferring the
benefits of the decarbonisation [see the chapter on energy]. Natural gas will remain part of the energy mix in
Europe over the medium term – scenarios suggest that EU gas demand will fall by 8%-25% by 2030 – and so this
goal requires reducing the volatility of natural gas prices. The report recommends reinforcing joint procurement
– at least for LNG – to leverage Europe’s market power and establishing long-term partnerships with reliable and
diversified trade partners as part of a genuine EU gas strategy. Europe also needs to reduce its exposure to spot
market by encouraging a progressive move awayfrom spot-linked sourcing and to reduce volatility in EU gas markets
by limiting the possibility of speculative behaviour. Following the US example, regulators should be able to apply
financial position limits as well as dynamic caps in circumstances when EU energy spot or derivatives prices diverge
markedly from global energy prices. The EU should also put in place a common trading rulebook applying to both
spot and derivatives markets and ensure integrated supervision of energy and energy derivatives markets. Finally,
the EU should review the “ancillary activities exemption” to ensure that all trading entities are subject to the same
supervision and requirements.
At the same time, transferring the benefits of decarbonisation requires policies to better decouple the price
of natural gas from clean energy. The EU should decouple the remuneration of renewable energy and nuclear
from fossil-fuel generation by building on the tools introduced under the new Electricity Market Design – such
as PPAs and two-way CfDs – and progressively extending PPAs and CFDs to all renewable and nuclear assets in
a harmonised way. The marginal pricing system should be used to ensure efficient balance in the energy system.
To increase the uptake of PPAs into the industrial sector, the report recommends developing market platforms
to contract resources and pool demand between generators and offtakers. This initiative can be combined with
schemes to provide guarantees to mitigate the financial counterparty risks engendered by using such platforms,
thereby enlarging market access to SMEs. For example, the EIB and National Promotional Banks could provide
counter guarantees and specific financial products for small consumers or suppliers that lack a proper credit rating.
In parallel, a fundamental component of lowering energy costs for end users is reducing energy taxation, which can
be achieved by adopting a common maximum level of surcharges across the EU (including taxes, levies and network
charges). Legislative reform in this area is subject to unanimity, but cooperation among a subset of Member States
or guidance on energy taxation can be considered.
The second key goal is to accelerate decarbonisation in a cost-efficient way, leveraging all available solu-
tions through a technology-neutral approach. This approach should include renewables, nuclear, hydrogen,
bioenergy and carbon capture, utilisation and storage, and should be backed by massive mobilisation of both public
and private finance (based on the proposals laid out in the chapter on investment. However, increasing the supply
of finance for clean energy deployment will not yield the desired results without increasing the pace of permitting
for installation. Different options are available to reduce permitting delays for new energy projects. Systematically
implementing existing legislation can make a major difference: for example, several Member States have experienced
double-digit increases in the volume of permits issued for onshore wind since the entry into force of the Article
122 Emergency Regulation. The report recommends extending acceleration measures and emergency regulation
to heat networks, heat generators, and hydrogen and carbon capture and storage infrastructure. Greater focus is
also needed on digitalising national permitting processes across the EU and addressing permitting authorities’
lack of resources. For instance, administrative fees for procedures could be increased to ensure authorities have
adequate capabilities to deliver prompt approvals. Another potential avenue would be forthe EU to make renewable
acceleration areas and strategic environmental assessments the rule for renewables expansion, replacing individual
assessments per project. Targeted updates to relevant EU Environmental legislation could be used to provide limited
(in time and perimeter) exemptions in EU environmental directives until climate neutrality is achieved. This revised
legislation should appoint last-resort national authorities to ensure the permitting of projects in the event that there
is no answer from local authorities after a predetermined time (e.g. 45 days).
A central element in accelerating decarbonisation will be unlocking the potential of clean energy through
a collective EU focus on grids. If there is one horizontal area in the energy sector whose importance cannot be
46
THE FUTURE OF EUROPEAN COMPETITIVENESS — PART A | CHAPTER 3](https://image.slidesharecdn.com/thefutureofeuropeancompetitivenessacompetitivenessstrategyforeurope-240910144201-24597139/75/The-future-of-European-competitiveness-_-A-competitiveness-strategy-for-Europe-pdf-48-2048.jpg)
![overstated, it is the EU’s energy grids. Delivering a step-change in grid deployment will require a new approach
to planning at the EU and Member State levels, including the ability to effectively reach decisions and accelerate
permitting, to mobilise adequate public and private financing and to innovate grid assets and processes. From a
European perspective, rapidly increasing the installation of interconnectors should be the focus. The report recom-
mends, first, to establish a “28th regime” – i.e. a special legal framework outside of the 27 different national legal
frameworks – for interconnectors deemed to be Important Projects of Common European Interest (IPCEIs). This
regime should shorten the length of national procedures and integrate them into a single process, avoiding the
possibility of projects being blocked by individual national interests. Some very large renewable energy projects,
such as large offshore wind in the North Sea, could also apply via this procedure, bypassing permitting delays at
the local level. Second, the next Multiannual Financial Framework should reinforce the EU instrument dedicated to
financing interconnectors (the Connecting Europe Facility). Third, a permanent European coordinator should be
created in charge of assisting in obtaining the necessary permits. This coordinator would be responsible for moni-
toring progress in the permit granting process and facilitating regional cooperation to ensure political backing for
cross-border infrastructure from all relevant Member States.
In parallel, the EU should develop the governance needed for a genuine Energy Union so that decisions and
market functions of cross-border relevance are taken centrally. A stronger, more robust institutional framework
would entail strengthening monitoring, investigation and decision-making powers at the EU level with the possi-
bility of providing full regulatory oversight over all decisions and processes that have direct cross-border impact.
A genuine Energy Union should ensure that central market functions of relevance for an integrated market are
performed centrally and subject to proper regulatory oversight.
While “hard-to-abate” industries will benefit from lower energy prices, the EU should take a pragmatic
approach to decarbonisation to mitigate potential trade-offs [see the chapters on energy-intensive indus-
tries, and transport]. For the EU to lead the decarbonisation of EIIs, a stronger focus is needed by both the EU and
national governments to provide sufficient financial resources. The report recommends earmaking a larger share
of ETS revenues to EIIs, with resources targeted towards innovating assets and processes and enhancing the skills
needed for decarbonisation, for example by supporting the uptake of green hydrogen or carbon capture and storage
solutions. ETS revenues should also be used to support the decarbonisation of the transport sector, helping reach
the EU’s milestones for shifting more activity to sustainable modes of transport. Decarbonisation funding across the
EU should be based on common, competitive and simple instruments, such as Carbon CfDs or competitive auctions
bythe European Hydrogen Bank. A basket of options should be in place to financially supporttransport decarbonisa-
tion. These could include CfDs to de-risk investment in low carbon fuels, blending EU grants with support by EIB and
National Promotional Banks, and RegulatoryAsset Based models for investment in (high speed) railway infrastructure.
Atthe same time, a global level playing field for EIIs and transport operators should be ensured during the transition.
While CBAM is an important instrumentfor European companies to stay competitive againsttheir international peers
that face lower or no carbon prices, its success is still uncertain. The EU should closely monitor and improve the
CBAM design during the transition phase and consider postponing the phase out of free ETS free allowances for
EIIs if implementation is ineffective.
To capitalise on the decarbonisation push, Europe should refocus its support for clean tech manufac-
turing, focusing on technologies where it either has a lead or where there is a strategic case for developing
domestic capacity [see the chapter on clean technologies]. The next Multiannual Financial Framework (MFF)
should streamline the number of funds devoted to the manufacturing of clean tech, concentrating on technologies
where the EU has an advantage and strong potential for growth – such as the opportunity presented by batteries.
Support under the EU budget should offer companies a single point of entry with a uniform application procedure
and awarding conditions, and should feature support for both capital expenditure and operational expenditure. To
attract more private sectorfunding to clean tech, and especiallytowards innovative companies, dedicated financing
schemes should be developed employing the same financing strategies discussed in chapter 2. At the national
level, to ensure predictable demand for the EU clean tech industry and to offset trade distorting policies abroad,
the report recommends introducing an explicit minimum quota for the local production of selected products and
components in public procurement and in CfD auctions and other forms of local production offtake. This quota
should be combined with criteria established at EU level for orienting local production to the most innovative and
sustainable solutions. The approach could be supported bythe creation of jointventures or cooperation agreements
47
THE FUTURE OF EUROPEAN COMPETITIVENESS — PART A | CHAPTER 3](https://image.slidesharecdn.com/thefutureofeuropeancompetitivenessacompetitivenessstrategyforeurope-240910144201-24597139/75/The-future-of-European-competitiveness-_-A-competitiveness-strategy-for-Europe-pdf-49-2048.jpg)
![for knowledge transfer and sharing between EU and non-EU companies. For “infant industries”, it is recommended
that Member States plan upcoming auctions and public procurement procedures to act as a “launch customer” for
new technologies.
Trade policy will be fundamental to combine decarbonisation with competitiveness, securing supply chains,
growing new markets and offsetting state-sponsored competition. As supply chains for some clean technolo-
gies are highly concentrated, the EU has win-win opportunities to strategically partnerwith other regions in targeted
steps of clean technology supply chains. Like-minded neighbouring regions with access to low-cost renewable
energy sources and raw materials could help Europe accomplish its energy and climate goals in an affordable
manner while widening the diversification of supplies. At the same time, the EU should leverage its strong position
in clean tech and pursue opportunities to invest in other countries to widen the deployment marketfortechnologies
the region is developing, such as near zero-emissions processes for materials production. To enable these goals,
the report recommends for the EU to establish industrial partnerships with third countries in the form of offtake
agreements across the supply chain or co-investment in manufacturing projects. The EU’s Global Gateway could
be leveraged for the necessary investment. However, in situations where otherwise productive EU companies are
being threatened by state-sponsored competition, the EU should be prepared to apply trade measures in line with
principles described above [see the Box in chapter 1 – the starting point].
As part of its decarbonisation strategy, the EU should develop an industrial action plan for the automo-
tive sector [see the chapter on automotive]. In the short term, the main objective for the sector should be to
avoid a radical delocalisation of production away from the EU or the rapid takeover of EU plants and companies by
state-subsidised foreign producers, while continuing decarbonisation. The countervailing tariffs recently adopted
bythe Commission against Chinese automotive companies making battery EVs will help level the playing field in this
regard while accommodating genuine productivity gains in China. Looking forward, the report recommends for the
EU to develop an industrial roadmap that accounts for the horizontal convergence (i.e. electrification, digitalisation
and circularity) and the vertical convergence (i.e. critical raw materials, batteries, transport and charging infrastruc-
ture) of value chains in the automotive ecosystem. As part of this action plan, the EU should evaluate support for
IPCEIs in the automotive sector. Scale, standardisation and collaboration will be crucial for EU manufacturers to
become competitive in areas such as small and affordable European EVs, software-defined vehicle and autonomous
driving solutions, and the circularityvalue chain. A coherent digital policy, encompassing the data ecosystem, should
support these developments. In building such a roadmap, the EU should follow a technology-neutral approach in
defining the path to CO2
and pollutant reductions and should take stock of market and technological developments.
The wider EU strategy towards cross-border and modal integration and sustainable transport needs to plan
for competitiveness and not only for cohesion [see the chapter on transport]. Transport should be based on a
new unified approach to planning atthe EU and national levels, focused on harmonisation and interoperability as well
as cohesion. This approach should be matched by deeper coordination with adjacent network industries (energy and
telecoms) and new incentives in the EU budget for Member States to remove barriers to EU integration and ensure
interoperability and competition in all transport segments, when these goals goes beyond the application of EU law.
The EU should also continue to reinforce its leading position in innovative transport by launching industrial innova-
tion projects for decarbonisation challenges, such as an industrial demonstrator (as part of a new Competitiveness
Joint Undertaking, replacing current public-private partnerships) or an IPCEI forthe zero-emission flight ofthe future.
48
THE FUTURE OF EUROPEAN COMPETITIVENESS — PART A | CHAPTER 3](https://image.slidesharecdn.com/thefutureofeuropeancompetitivenessacompetitivenessstrategyforeurope-240910144201-24597139/75/The-future-of-European-competitiveness-_-A-competitiveness-strategy-for-Europe-pdf-50-2048.jpg)

![4. Increasing security and
reducing dependencies
While dependencies are a two-way street, Europe is vulnerable to both coercion and, in extreme cases,
geo-economic fragmentation. Europe has extensive external dependencies, ranging from critical raw mate-
rials (CRMs) to advanced technologies. Many of these dependencies could become vulnerabilities in a situation
where trade fragments along geopolitical lines. Around 40% of Europe’s imports are sourced from a small number
of suppliers and difficult to substitute, and around half of these imports originate from countries with which it is not
strategically alignedi
. As a result, Europe’s notional exposure to any “sudden stops” in trade caused by geopolitical
conflagration is high. However, absent an extreme unforeseen scenario, a profound and rapid decoupling of global
trade seems unlikely in the medium term. Evidence of de-globalisation is currently limited, with companies preferring
to diversify suppliers rather than re-shore or near-shore production on a significant scaleii
. Neither China nor the
EU has an incentive to accelerate this process: as the previous chapter demonstrated, China is reliant on the EU to
absorb its excess capacity in clean technologies. The more immediate riskfor Europe is that dependencies could be
used to create an opportunity for coercion, making it harder for the EU to maintain a united stance and undermining
its common policy objectives. A growing use of dependencies as a “geopolitical weapon” is in turn likely to increase
uncertainty and have a detrimental effect on business investmentiii
.
Deteriorating geopolitical relations also create new needs for spending on defence and defence industrial
capacity. Europe now faces conventional warfare on its Eastern border and hybrid warfare everywhere, including
attacks on energy infrastructure and telecoms, interference in democratic processes and the weaponisation of
migrationiv
. At the same time, US strategic doctrine is shifting away from Europe and towards the Pacific Rim – for
example in the format ofAUKUS – driven bythe perceived threat of China. As a result, a growing demand for defence
capability is being met by a shrinking supply – a gap which Europe itself must fill. However, thanks to a prolonged
period of peace in Europe and the US security umbrella, only ten Member States now spend more than or equal to
2% of GDP in line with NATO commitments, although defence expenditures are rising [see Figure 1]. The defence
industry requires massive investments to catch up. As a point of reference, if all EU Member States who are NATO
Members and who have notyet reached the 2% targetwere to do so in 2024, defence spending would rise by EUR 60
billion. Additional investments are also needed to restore lost capabilities owing to decades of underinvestment and
to replenish depleted stocks, including those donated to supportthe defence of Ukraine against Russian aggression.
In June 2024, the Commission estimated that additional defence investments of around EUR 500 billion are needed
over the next decade.
FIGURE 1
EU Member States’ defence expenditure
% of GDP
Source: SIPRI. Accessed 2024.
50
THE FUTURE OF EUROPEAN COMPETITIVENESS — PART A | CHAPTER 4](https://image.slidesharecdn.com/thefutureofeuropeancompetitivenessacompetitivenessstrategyforeurope-240910144201-24597139/75/The-future-of-European-competitiveness-_-A-competitiveness-strategy-for-Europe-pdf-52-2048.jpg)

![Reducing external vulnerabilities
As outlined in the previous chapter, access to CRMs is critical forthe clean tech and automotive industry, yet
supply is highly concentrated [see the chapter on critical raw materials]. The global market for critical minerals for
the energytransition has doubled during the pastfive years, reaching EUR 300 billion in 2022v
. Accelerating deploy-
ment of clean energy technologies is driving unprecedented growth in demand. From 2017 to 2022, global demand
for lithium tripled, while demand for cobalt rose by 70% and 40% for nickel. According to IEA projections, mineral
demand for clean energy technologies is expected to grow by a factor of 4 to 6 by 2040. However, the supply of
CRMs is highly concentrated in a handful of providers, especiallyfor processing and refining, which creates two main
risks for Europe. The first is price volatility, which hampers investment decisions. For example, although an extreme
case, the price of lithium increased twelvefold over two years before tumbling again more than 80%, preventing the
opening of competitive mines in the EU. While oil stocks and gas storage play an important role in cushioning shocks
in the energy market, there is no equivalent for critical minerals in the event of large market swings. The second risk
is that CRMs can be used as geopolitical weapon, as a large part of extraction and processing is concentrated in
countries with which the EU is not strategically aligned. For example, China is the single largest processer of nickel,
copper, lithium and cobalt, accounting for between 35-70% of processing activity, and has shown willingness to
use its market power [see Figure 2]. Export restrictions from the country grew by a factor of nine between 2009 and
2020. Little progress is being made so far with diversification. Compared with three years ago, the share of the top
three producers for key CRMs either remains unchanged or has increased further.
FIGURE 2
Concentration of the extraction and processing of critical resources
Share of top-three producing countries in total production of selected resources and minerals, 2022
Source: IEA. Based on S&P Global, USGS, Mineral Commodity Summaries and Wood Mackenzie, 2024.
Faced with these constraints, CRMs are subject to a global race to secure supply chains, and Europe is
currently falling behind. Other major economies are moving to secure independent supply chains and reduce
their vulnerability. Alongside its dominant position in processing and refining, China is actively investing in mining
assets in Africa and Latin America and overseas refining via its Belt and Road initiative. Its overseas investment in
metals and mining through the Belt and Road Initiative reached a record high of USD 10 billion in the first half of 2023
alone, and it plans to double the ownership of overseas mines containing critical minerals by Chinese companies.
The US has deployed the IRA, the Bipartisan Infrastructure Act and defence funding to develop at scale domestic
processing, refining and recycling capacity, as well as using its geopolitical power to secure the global supply chain.
Japan is highly dependent on other regions for CRMs, and since the 2000s it has developed a strategic approach to
increase access to overseas mining projects. The Japan Organization for Metals and Energy Security invests equity in
mining and refining assets around the world, manages strategic stockpiling and, since the introduction of the recent
52
THE FUTURE OF EUROPEAN COMPETITIVENESS — PART A | CHAPTER 4](https://image.slidesharecdn.com/thefutureofeuropeancompetitivenessacompetitivenessstrategyforeurope-240910144201-24597139/75/The-future-of-European-competitiveness-_-A-competitiveness-strategy-for-Europe-pdf-54-2048.jpg)
![economic security law, has powers to develop processing and refining facilities within Japan. Europe, by contrast, has
a comparable level of dependencies, being highly dependent on one or two countries for most of its critical mineral
imports. However, it is not following a similarly coordinated approach. The EU is lacking a comprehensive strategy
covering all stages of the supply chain (from exploration to recycling) and, unlike its competitors, the mining and
trading of commodities is largely left to private actors and the market.
Strategic dependencies also extend to critical technologies for the digitalisation of Europe’s economy [see
the chapter on digitalisation and advanced technologies]. The EU relies on foreign countries for over 80% of digital
products, services, infrastructure and intellectual propertyvi
. Dependencies are particularly acute, however, for semi-
conductors owing to the structure of the industry, which is dominated by a small number of large players. The US
has specialised in chips design, Korea, Taiwan and China in chips manufacturing, and Japan and some EU Member
States in key materials and equipment – optics, chemistry and machinery [see Figure 3]. Europe has little domestic
capacity in many parts of the supply chain. For example, the EU currently has no foundry producing below 22 nm
process nodes and relies on Asia for 75% to 90% of wafer fabrication capacity (as does the US). Europe has become
dependent on non-EU countries for chips design, packaging and assembly as well. Dependencies are also acute for
other advanced tech. The EU’s AI industry relies on hardware produced largely by one US-based company for the
most advanced processors. Similarly, Europe’s dependence on cloud services developed and run by US companies
is massive. For quantum computing platforms, the EU suffers from six critical dependencies across 17 key technolo-
gies, components and materials. China and the US hold technological leadership in most of these critical elements.
In the telecoms sector, Europe is less dependent on foreign technology: top EU vendors are well positioned in the
global supply of telecoms equipment. However, it will be important that dependencies do not increase, especially
on high-risk suppliers that could compromise the security of EU networks and citizens’ data. Currently, 14 Member
States have no restrictions on high-risk suppliers in place.
FIGURE 3
Share in semiconductor value chain by country
% of worldwide total, 2019
Source: SIA, 2021.
To reduce its vulnerabilities, the EU needs to develop a genuine “foreign economic policy” based on
securing critical resources [see the chapter on critical raw materials]. In the short term, the EU needs to imple-
ment the Critical Raw Materials Act (CRMA) rapidly and fully. The report recommends complementing this Act with
a comprehensive strategy covering all stages of the critical mineral supply chain, from extraction to processing
to recycling. To strengthen Europe’s position at the procurement stage, it is proposed to create a dedicated EU
Critical Raw Material Platform. The platform would leverage Europe’s market power by aggregating demand for
the joint purchasing of critical materials (following the model used in South Korea and Japan) and coordinating
the negotiation of joint purchases with producer countries. It would also help lower “insurance costs” for Member
States by managing future strategic stockpiles at the EU level, going beyond the soft request for national stockpiles
53
THE FUTURE OF EUROPEAN COMPETITIVENESS — PART A | CHAPTER 4](https://image.slidesharecdn.com/thefutureofeuropeancompetitivenessacompetitivenessstrategyforeurope-240910144201-24597139/75/The-future-of-European-competitiveness-_-A-competitiveness-strategy-for-Europe-pdf-55-2048.jpg)
![included in the CRMA. In parallel, it is recommended that the EU further develops its “resource diplomacy” for
CRMs. Proposals include upgrading the Global Gateway – which promotes investment in third countries – to focus
on the EU’s strategic needs and developing joint strategies with other buyers from strategically aligned countries,
for example through a G7+ Critical Raw Materials Club (including Japan, South Korea and Australia). The EU should
also carefully explore the potential of environmentally-sustainable deep sea mining: estimates suggest that the sea
bed holds large multiples of the known land-based reserves for example for copper, titanium, manganese, cobalt,
nickel and rare earth elementsvii
.
The EU must also harness the potential of domestic resources through mining, recycling and innovation
in alternative materials. Unlike fossil fuels, the EU has deposits of some critical raw materials, such as lithium in
Portugal. Accelerating the opening of domestic mines could enable the EU to meet its entire demand for some
critical minerals. The CRMA already calls on Member States to implement shorter permitting timeframes for “Strategic
Projects”: 27 months for extraction permits and 15 months for processing, compared with processes that take three
to five times as long today. However, the report recommends additional actions to accelerate the pace of permitting,
for example increasing administrative capacity by mandating pre-defined staff resources to be allocated to Strategic
Projects. At the same time, materials found in retired EVs, windmills and other goods represent a further supply that
could be tapped through recycling. The EU could potentially meet more than half to three quarters of its metal
requirements for clean technologies in 2050 through local recyclingviii
. It is therefore recommended to establish a
true Single Market for waste and circularity. Achieving this goal will require strengthening the secondary market for
critical raw materials waste, effectively enforcing existing legislation on waste collection and shipment to allow the
build-up of scale, and coordinating EU export controls on waste. Finally, boosting R&I for alternative materials or
processes will be crucial to substitute critical raw materials. For example, US tech companies have recently combined
federal research labs to use AI to develop a new material that could reduce the lithium content in batteries by 70%ix
.
For strategic industries, the EU should pursue a coordinated EU strategy to bolster domestic production
capacity and to protect key network infrastructures [see the chapter on digital and advanced technologies].
While EU ownership of large foundries may be unrealistic at this stage owing to the required investment levels,
Europe should maximise its joint efforts to strengthen innovation in semiconductors and its presence in the most
advanced chips segments. The report recommends launching a common strategy based around four elements.
First, funding for innovation and the establishment of testing labs near existing centres of excellence. Second,
providing grants or R&D tax incentives for “fabless” companies active in chips design and foundries in selected
strategic segments. Third, supporting the innovation potential of mainstream chips. Fourth, coordinating EU efforts
in back-end 3D advanced packaging, advanced materials and finishing processes. Total investments in industrial
deployment of around EUR 100 billion have been announced in the EU since the proposal for a European Chips Act,
mostly supported by Member States under State aid control. However, there is a risk that a fragmented approach
leads to weak coordination of priorities and demand requirements, lack of scale for domestic producers, and in turn
less ability to invest in more innovative semiconductor segments. It is therefore proposed to create a centralised
EU budgetary allocation dedicated to semiconductors supported by a new “fast-track” IPCEI. Use of this tool would
entail co-financing from the EU budget and shorter approval times for semiconductor projects. For telecoms, it is
recommended to strengthen security considerations in technology sourcing by favouring the use of EU trusted
vendors for spectrum assignment in all future tenders, and by promoting EU-based telecoms equipment providers
as strategic in trade negotiations.
54
THE FUTURE OF EUROPEAN COMPETITIVENESS — PART A | CHAPTER 4](https://image.slidesharecdn.com/thefutureofeuropeancompetitivenessacompetitivenessstrategyforeurope-240910144201-24597139/75/The-future-of-European-competitiveness-_-A-competitiveness-strategy-for-Europe-pdf-56-2048.jpg)
![Strengthening industrial capacity
for defence and space
The European defence industry not only suffers from lower defence spending but also a lack of focus on
technological development [see the chapter on defence]. The European defence sector is highly competitive
globally, registering an annual turnover of EUR 135 billion in 2022 and strong export volumes. Some EU products
and technologies are superior or at least equivalent in quality to those produced by the US, such as main battle
tanks, conventional submarines, naval shipyard technology and transport aircraft. However, the EU defence industry
is suffering from a capacity gap on two fronts. First, overall demand is lower: aggregate defence spending in the
EU is about one-third as high as in the US. Second, EU spending is less focused on innovation. Defence is a highly
technological industry characterised by disruptive innovation, meaning that massive R&D investments are required
to maintain strategic parity. The US has prioritised R&D spending over all other military spending categories since
2014. In the 2023, it allocated EUR 130 billion (USD 140 billion) for Research, Development, Test and Evaluation,
amounting to around 16% of total defence spending. This category also saw the largest relative percentage increase
in the defence budget. In Europe, total funding for defence R&D was EUR 10.7 billion in 2022, amounting to just
4.5% of total spending. Complex next-generation defence systems in all strategic domains will require massive R&D
investment that exceeds the capacity of single EU Member States.
The European defence industry is also fragmented, limiting its scale and hindering operational effective-
ness in the field. The EU defence industrial landscape is populated mainly by national players operating in relatively
small domestic markets [see Figure 4]. Fragmentation creates two major challenges. First, it means that the industry
lacks scale, which is essential in a capital-intensive sector with long investment cycles. As a result, if EU Member
States were to ramp up defence spending significantly, a supply crisis could occur with Member States competing
between each other on the constrained European defence equipment market. Second, fragmentation leads to
serious issues related to a lack of standardisation and the interoperability of equipment, which have come to light
during the EU’s support for Ukraine. For 155 mm artillery alone, EU Member States have provided ten different types
of howitzers to Ukraine from their stocks, and some have even been delivered in different variants, creating serious
logistical difficulties for Ukraine’s armed forces. In terms of other products, for example, EU Member States operate
twelve types of battle tanks, whereas the US produces only onex
.
FIGURE 4
Comparison of major European and US players
Defence revenues, EUR million, 2023
Source: Elaboration on Defence News Top 100. European players include European non-EU companies
55
THE FUTURE OF EUROPEAN COMPETITIVENESS — PART A | CHAPTER 4](https://image.slidesharecdn.com/thefutureofeuropeancompetitivenessacompetitivenessstrategyforeurope-240910144201-24597139/75/The-future-of-European-competitiveness-_-A-competitiveness-strategy-for-Europe-pdf-57-2048.jpg)
![The EU has developed a world-class space sector, despite much lower levels of funding, but is now starting
to lose ground [see the chapter on space]. The EU funds, owns and manages critical space infrastructure. It has
developed world-class strategic assets and capabilities, with technical competences on parwith other space powers
in most areas. For example, in satellite navigation, Galileo provides the most accurate and secure positioning and
timing information, also for military applications. In Earth Observation, Copernicus offers the most comprehensive
data worldwide, including for environmental and climate change monitoring, disaster management and security.
However, the EU has lost its leading market position in commercial launchers (Ariane 4-5) and geostationary satel-
lites. It had to rely temporarily on the Space X rockets to launch the satellites for its strategic programme Galileo. The
EU also lags the US in rocket propulsion, mega-constellations for telecoms and satellite receivers and applications,
which is a much larger marketthan the other space segments. Like the defence industry, the space sector is suffering
from a marked investment gap with its major competitors. For the past forty years, investment has ranged between
15% and 20% of US levels. In 2023, public expenditure in Europe on space stood at USD 15 billion, compared with
USD 73 billion in the US. China is expected to overtake Europe in the next few years, reaching an expenditure of
USD 20 billion by 2030 [see Figure 5].
FIGURE 5
Government expenditure on space programmes
USD billion
Source: Euroconsult, 2023.
For both defence and space industries, insufficient aggregation and coordination of public spending in
Europe compounds industrial fragmentation. European collaborative procurement accounted for only 18% of
expenditure on defence equipment procurement in 2022, well below the benchmark of 35% agreed upon in the
European Defence Agencyframeworks. This lack of coordination creates a vicious circle forthe EU defence industry.
Without demand aggregation among Member States, it is more difficultforthe industryto predict longer-term needs
and increase supply, in turn decreasing its overall capacityto meet demand and depriving the industry of orders and
opportunities. As a result, defence procurement is diverted outside of the EU. Between June 2022 and June 2023,
78% of procurement spending went to non-EU suppliers, out of which 63% went to the US. At the same time, when
EU Member States organise and cooperate, the results are positive. One such example is the A330 Multi-Role Tanker
Transport, which was developed through a collaborative project allowing participating countries to pool resources
and share operation and maintenance costs. The European space sector is likewise hindered by insufficient demand
aggregation and investment coordination among Member States. Furthermore, the European Space Agency (ESA)
operates based on the principle of “geographical return”, meaning that it invests in each of its member countries
through industrial contracts for space programmes an amountwhich is similarto the country’s financial contribution
to the agency. This principle leads to an inevitable fragmentation of supply chains, the unnecessary duplication of
capacities in relatively small markets and a mismatch between the most competitive industrial actors and the actual
allocation of resources.
56
THE FUTURE OF EUROPEAN COMPETITIVENESS — PART A | CHAPTER 4](https://image.slidesharecdn.com/thefutureofeuropeancompetitivenessacompetitivenessstrategyforeurope-240910144201-24597139/75/The-future-of-European-competitiveness-_-A-competitiveness-strategy-for-Europe-pdf-58-2048.jpg)
![In the absence of common European spending, policy actions for the defence sector need to focus on
aggregating demand and integrating industrial defence assets [see the chapter on defence]. In the short term,
the swift implementation of the European Defence Industrial Strategy and the related European Defence Industry
Programme is needed. In particular, it is essential to increase substantially the aggregation of demand between
groups of Member States, at least among those who opt to do so, and to raise the share of joint defence procure-
ment. The report recommends further steps to develop a medium-term EU Defence Industrial Policy which can
support the structural cross-border integration of defence assets and the selective integration and consolidation of
EU industrial capacity, with the explicit aim of increasing scale, standardisation and interoperability. EU competition
policy should enable such consolidation when increased scale would deliver efficiencies or allow the realisation
of globally competitive investments. In addition, as EU defence spending rises, defence industrial consolidation,
integration and technological innovation should be supported by reinforced European preference principles in
procurement, ensuring that a minimum share of this rising demand is concentrated on European companies rather
than flowing overseas.
Together with the urgent need to increase overall defence investment, there is a strong case to reinforce
cooperation and pooling of resources for defence R&D at the EU level. The defence sector is facing massive
investment needs [see the chapter on investment]. While the defence sector overall will benefit from measures to
deepen EU capital markets, innovative defence SMEs will need additional support. Relevant measures could include
modifying the EIB Group’s lending policies on excluding defence investment and clarifying the EU’s Environmental,
Social and Governance frameworks on the financing of defence products. Defence R&D, however, is a special
category of spending that warrants a unique approach. Currently, the EU invests around EUR 1 billion in defence
R&D per year, while the bulk of investment takes place at the Member State level. But several new or technically
complex segments – such as drones, hypersonic missiles, directed-energy weapons, defence artificial intelligence
and seabed and space warfare – call for pan-European coordination. No Member State can effectively finance,
develop, produce and sustain all the necessary capabilities and infrastructure that are required to maintain leader-
ship in these technologies. At the same time, the spillovers from defence R&D to other sectors of the economy and
privatelyfunded R&D are largexi
. The reporttherefore recommends that European funding for R&D is both increased
and concentrated on common initiatives. This approach could be developed through new dual-use programmes
and a proposed European Defence Projects of Common Interest to organise the necessary industrial cooperation.
The European space sector would benefit from updated governance and investment rules, and greater
coordination of public spending in a true Single Market for space. The report recommends progressively
removing the ESA’s geographical return principle. The ESA’s procurement rules should reflect the outcome of
industrial competition and the choice of the best providers, and resources should be concentrated on projects
that demonstrate the potential for significant scientific or technological advancement, regardless of the location of
the participating entities. This process should be accompanied by the establishment of a functioning Single Market
for space, with common standards and the harmonisation of licensing requirements (in line with the planned EU
Space Law). It is also proposed to establish a multi-purpose Space Industrial Fund that would allow the European
Commission to act as an “anchor customer” to jointly purchase space services and products and fund critical
technologies, helping the EU industrial base to increase its capacity. Similarly, joint strategic priorities for space
research and innovation should be supported by increased coordination, funding and the pooling of resources for
the development of new large EU joint programmes. Finally, as for the defence sector, the growth of innovative EU
space SMEs, start-ups and scale-ups should be enabled by improved access to finance and the introduction of
targeted European preference rules.
57
THE FUTURE OF EUROPEAN COMPETITIVENESS — PART A | CHAPTER 4](https://image.slidesharecdn.com/thefutureofeuropeancompetitivenessacompetitivenessstrategyforeurope-240910144201-24597139/75/The-future-of-European-competitiveness-_-A-competitiveness-strategy-for-Europe-pdf-59-2048.jpg)

![5. Financing investments
The financing needs required for the EU to meet its objectives are massive, but productive investment is
weak despite ample private savings [see the chapter on investment]. To meetthe objectives laid out in this report,
a minimum annual additional investment of EUR 750 to 800 billion is needed, based on the latest Commission esti-
mates, corresponding to 4.4-4.7% of EU GDP in 2023. For comparison, investment under the Marshall Plan between
1948-51 was equivalent to 1-2% of EU GDP. Delivering this increase would require the EU’s investment share to jump
from around 22% of GDP today to around 27%, reversing a multi-decade decline across most large EU economies.
However, productive investment in the EU is not rising to this challenge. Since the Great Financial Crisis (GFC), a
sizeable and persistent gap has opened between private productive investment01
in the EU and the US. At the same
time, the private investment gap across the two economies has not been offset by higher government investment,
which also dropped after the GFC and has been persistently lower in the EU compared to the US as a share of GDP.
EU households provide ample savings to finance higher investment, but at present these savings are not being
channelled efficiently into productive investments. In 2022, EU household savings were EUR 1,390 billion compared
with EUR 840 billion in the US. But, despite their higher savings, EU households have considerably lowerwealth than
their US counterparts, largely because ofthe lower returns they receive from financial markets on their asset holdings.
The EU can meet these investment needs without overstretching the resources of the European economy,
but the private sector will need public support to finance the plan. The European Commission and the IMF’s
Research Department have simulated scenarios of a sustained EU investment push of around 5% of GDP, using their
multi-country models. The results suggest that investment of this magnitude would increase output by around 6%
within 15 years. Since supply adjusts more gradually than demand – as the build-up of additional capital takes time
– the transition phase implies some inflationary pressures, but these pressures dissipate over time. Unlocking the
investment will be challenging. Historically in Europe, around four-fifths of productive investment has been under-
taken bythe private sector, and the remaining one-fifth bythe public sector. Delivering private investment of around
4% of GDPthrough marketfinancing alone would require a reduction in the private cost of capital – by approximately
250 basis points in the European Commission model. Although improved capital market efficiency (e.g. through
the completion of the Capital Markets Union) is expected to reduce private financing costs, the reduction will likely
be substantially smaller. Fiscal incentives to unlock private investment therefore appear necessary to finance the
investment plan, in addition to direct government investment.
The required stimulus to private investment will have some impact on public finances, but productivity gains
can reduce the fiscal costs. If the investment-related government spending is not compensated by budgetary
savings elsewhere, primary fiscal balances may temporarily deteriorate before the investment plan fully exerts its
positive impact on output. However, if the strategy and reforms outlined in this report are implemented in parallel,
the investment push should be accompanied by a significant increase in EU total factor productivity (TFP). A sizable
increase in TFP will improve the government budget surplus, significantly reducing the transitional costs of imple-
menting the plan, provided that the additional revenue is not fully spent on other purposes. For example, a 2%
increase in the level of TFPwithin ten years could already be sufficient to cover up to one third of the fiscal spending
(investment subsidies and government investment) required to implement the plan. The 2% TFP increase can be
considered modest given the current 20% gap TFP levels between the EU and the US.
THE ROOT CAUSES OF LOW INVESTMENT FINANCING IN EUROPE
A key reason for less efficient financial intermediation in Europe is that capital markets remain fragmented
and flows of savings into capital markets are lower. While the Commission has introduced several measures
to build a Capital Markets Union (CMU), three main fault lines remain. First, the EU lacks a single securities market
regulator and a single rulebook for all aspects of trading and there is still high variation in supervisory practices and
interpretations of regulations. Second, the post-trade environment for clearing and settlement in Europe is far less
01. Productive investment is defined as gross fixed capital formation minus residential investment.
59
THE FUTURE OF EUROPEAN COMPETITIVENESS — PART A | CHAPTER 5](https://image.slidesharecdn.com/thefutureofeuropeancompetitivenessacompetitivenessstrategyforeurope-240910144201-24597139/75/The-future-of-European-competitiveness-_-A-competitiveness-strategy-for-Europe-pdf-61-2048.jpg)

![the productivity gains of the strategy, such as investing in breakthrough research and infrastructures to embed
AI into the economy. At the same time, there are other public goods identified in this report – such as investing in
grids and interconnectors, and financing the joint procurement of defence equipment and defence R&I – that will
be undersupplied without common action and funding. Finally, for Member States to converge more closely in their
policies – be it the Single Market or more generally in the policies described in this report such as climate, innova-
tion, defence, space and education – both regulation and incentives will be required. Incentives will also require
common funding. However, if the strategy is not fully implemented and productivity growth does not pick up, a
broader issuance of public debt may be needed to make the funding of the transitions a more realistic proposition.
The issuance of common safe assets to fund joint investment projects could follow existing templates –
however, it would have to be accompanied by all the safeguards that such a fundamental step would entail.
The use of a common safe asset has a well-established precedent in the funding of the NGEU. The present circum-
stances are equally serious, even if less dramatic. But issuing such assets on a more systematic basis would require
a stronger set of fiscal rules which ensure that an increase in common debt is matched by a more sustainable path
of national debt. In this way, all EU Member States could contribute to such an asset without prejudging the sustain-
ability of their public debt. Issuance would also have to remain mission and project-specific.
MOBILISING PRIVATE AND PUBLIC FINANCE AT SCALE
To unlock private capital, the EU must build a genuine Capital Markets Union (CMU) supported by a stronger
pension. As a key pillar of the CMU, the European Securities and Markets Authority (ESMA) should transition from
a body that coordinates national regulators into the single common regulator for all EU securities markets, similar to
the US Securities and Exchange Commission. An essential step to transform ESMA into such an agency is modify its
governance and decision-making processes along similar lines as those of the ECB Governing Council, detaching
them as much as possible from the national interests of EU Member States. Harmonising insolvency frameworks will
also be critical to remove fragmentation created by differing creditor hierarchies, while the EU should continue to
eliminate taxation obstacles to cross-border investing. These measures would in turn make it easierto foster central-
isation in clearing and settlement. Ultimately, the EU should aim to create a single central counterparty platform
(CCP) and a single central securities depository (CSD) for all securities trades. As for smaller clearing houses the
benefits of consolidation may not be large, a practical pathway towards consolidation could start with consolidating
the largest CCPs and CSDs, and then counting on their gravitational pull to attract smaller ones. The EU must also
better channel households’ savings to productive investments. The easiest and most efficient way to do so is via
long-term saving products (pensions). To increase the flow of funds into capital markets, the EU should encourage
retail investors through the offer of second pillar pension schemes, replicating the successful examples of some EU
Member States.
To increase the financing capacity of the banking sector, the EU should aim to revive securitisation and
complete the Banking Union. This report recommends that the Commission makes a proposal to adjust pruden-
tial requirements for securitised assets. Capital charges must be reduced for certain simple, transparent and stan-
dardised categories for which charges do not reflect actual risks. In parallel, the EU should review transparency and
due diligence rules for securitised assets, which are relatively high compared to other asset classes and reduce their
attractiveness. Setting up a dedicated securitisation platform, as other economies have done, would help to deepen
the securitisation market, especially if backed by targeted public support (for example, well-designed public guar-
antees forthe first-loss tranche). The EU should also assess whether current prudential regulation, also in light ofthe
possible upcoming implementation of Basel III, is adequate to have a strong and international competitive banking
system in the EU. A minimal step towards completing the Banking Union would be to create a separate jurisdiction
for European banks with substantial cross-border operations that would be “country blind” from the regulatory,
supervisory and crisis management viewpoints.
The EU budget should be reformed to increase its focus and efficiency, as well as being better leveraged to
support private investment. The EU’s financial resources should be refocused on jointly agreed strategic projects
and objectives, where the EU brings the most added value. Under the next EU budget, the report recommends
establishing a “Competitiveness Pillar” to direct EU funding towards priority projects identified under the Competi-
tiveness Coordination Framework [see the chapter on governance]. As part ofthis process, the EU should streamline
61
THE FUTURE OF EUROPEAN COMPETITIVENESS — PART A | CHAPTER 5](https://image.slidesharecdn.com/thefutureofeuropeancompetitivenessacompetitivenessstrategyforeurope-240910144201-24597139/75/The-future-of-European-competitiveness-_-A-competitiveness-strategy-for-Europe-pdf-63-2048.jpg)
![its budget structure to achieve sufficient scale to support strategic projects and to simplify access to beneficiaries.
It is proposed to regroup and substantially decrease the number of all funding programmes. Dedicated funding
schemes should be put in place to address the investment gap for scale-up technology companies in the EU [see
the chapter on innovation], as well as manufacturing capacities in certain cases, such as clean tech. The flexi-
bility of the EU budget should be enhanced to enable the reallocation of resources across and within programmes
and potential beneficiaries. The EU budget should also be better leveraged to support private investment through
different types of financial instruments and more risk appetite by implementing partners. In particular, it is recom-
mended to increase the size of the EU guarantee for the InvestEU Programme. The InvestEU programme should in
turn focus on financing higher risk and more scale-up investment. This objective will require the EIB Group to take
on more and larger high-risk projects, making greater use of the EIB Group’s own financial firepower.
Finally, the EU should move towards regular issuance of common safe assets to enable joint investment
projects among Member States and to help integrate capital markets. Ifthe political and institutional conditions
are in place as outlined above, the EU should continue – building on the model of NGEU – to issue common debt
instruments, which would be used to finance joint investment projects that will increase the EU’s competitiveness
and security. As several ofthese projects are longer-term in nature, such as financing R&I and defence procurement,
common issuance should over time produce a deeper and more liquid market in EU bonds, allowing this market to
progressively support the integration of Europe’s capital markets. At the same time, together with the above reforms,
to finance a variety of programmes focused on innovation and on raising productivity, Member States could consider
increasing the resources available to the Commission by deferring the repayment of NGEU.
62
THE FUTURE OF EUROPEAN COMPETITIVENESS — PART A | CHAPTER 5](https://image.slidesharecdn.com/thefutureofeuropeancompetitivenessacompetitivenessstrategyforeurope-240910144201-24597139/75/The-future-of-European-competitiveness-_-A-competitiveness-strategy-for-Europe-pdf-64-2048.jpg)

![The consolidation of the EU’s various coordination mechanisms should be matched by a consolidation of
its budgetary resources. EU resources should focus on funding public goods that are critical to the EU’s strategic
priorities and which would otherwise be undersupplied by Member States or the private sector [see the chapter on
investment]. Already underthe current Multiannual Financial Framework (MFF), programmes such as InvestEU could
be made more effective by adjusting the mandates of the implementing partners to enable more risk-taking. Under
the next MFF, the report recommends defining a “Competitiveness Pillar” with funding hypothecated to delivering
the Action Plans. The EU also needs to leverage better the large spending power of the Member States – which
is collectively equivalent to other major economies – by improving cooperation and focus. It is recommended to
create nationally pre-allocated envelopes in the MFFto incentivise and co-finance multi-country industrial projects,
which can be activated by a sub-group of interested Member States if necessary. It is also proposed to deploy two
revamped tools: a new Competitiveness IPCEI allowing State aid for cross-border projects, including industrial infra-
structure, and a new Competitiveness Joint Undertaking to quickly set up public-private partnerships between the
Commission, interested Member States and industries.
At the same time, refocusing implies that the EU should be more rigorous in applying the subsidiarity prin-
ciple and exercise more “self-restraint”. The Commission’s legislative activity has been growing excessively,
also due to passive scrutiny of the subsidiarity principle by national parliaments, which sets the boundaries of the
Commission’s right of initiative. While national parliaments have the power to scrutinise whether EU legislation
complies with the subsidiarity principle through reasoned opinions – and potentially trigger the so-called “yellow
card procedure” – many do not actively exercise this right. For example, ofthe 39 national parliaments or chambers in
the EU, only nine (from seven Member States) issued reasoned opinions in the context of scrutinising subsidiarity in
2023. An EU-wide inquiry should be launched to analyse the reasons behind national parliaments’ passive exercise
of their scrutiny of the subsidiarity principle. Building on its conclusions, initiatives should be taken to reinforce
the administrative capacity and role of national parliaments and Member States in their control over EU legislative
activity. Moreover, EU institutions should apply a “self-restraint” principle in policymaking, both by better filtering
future initiatives and by streamlining the existing acquis, building on the measures described in “Simplifying rules”
below.
ACCELERATING THE WORK OF THE EU
Council votes subject to qualified majority voting (QMV) should be extended to more areas, and if action
at the EU level is blocked, a differentiated approach to integration should be pursued. So far, many efforts
to deepen European integration between Member States have been hindered by unanimity voting in the Council
of the European Union. All possibilities offered by the EU Treaties should therefore be exploited to extend QMV.
The so-called “passerelle” clause should be leveraged to generalise voting by qualified majority in all policy areas
in the Council. This step would require an upfront agreement, subject to unanimity at the level of the European
Council, and would have a positive impact on the pace at which key legislative initiatives are adopted by the EU. If
action at the EU level is hindered by existing institutional procedures, the next-best option is for like-minded groups
of Member States to resort to enhanced cooperation as foreseen by Articles 20 TEU and 329 TFEU. Enhanced
cooperation offers two important safeguards: the consent of the European Parliament (EP) and judicial oversight
of the Court of Justice of the EU (CJEU). It is also based on a Commission proposal. As an illustration, if the EU is
unable to establish a special regime for innovative companies under normal procedures, a voluntary 28th company
rulebook harmonising legislation concerning corporate law and insolvency, as well as a few key aspects of labour law
and taxation, to be made progressively more ambitious, could be explored under enhanced cooperation by willing
Member States. As a last resort, intergovernmental cooperation should be considered. However, acting outside of
the Treaties creates parallel legal frameworks and implies the absence of judicial oversight by CJEU, democratic
legitimacy via the EP, and the Commission’s involvement in preparing texts.
SIMPLIFYING RULES
The regulatory burden on European companies is high and continues to grow, but the EU lacks a common
methodology to assess it. The Commission has been working for years to reduce the “stock” and “flow” of regula-
tion under the Better Regulation agenda. However, this effort has had limited impact so far. The stock of regulation
64
THE FUTURE OF EUROPEAN COMPETITIVENESS — PART A | CHAPTER 6](https://image.slidesharecdn.com/thefutureofeuropeancompetitivenessacompetitivenessstrategyforeurope-240910144201-24597139/75/The-future-of-European-competitiveness-_-A-competitiveness-strategy-for-Europe-pdf-66-2048.jpg)


