The Comingled Code Open Source And Economic Development Joshua Lerner Mark Schankerman
The Comingled Code Open Source And Economic Development Joshua Lerner Mark Schankerman
The Comingled Code Open Source And Economic Development Joshua Lerner Mark Schankerman


![once branded the GPL as ‘‘fundamentally undermin[ing] the indepen-
dent commercial software sector,’’3 released two substantial blocks of
code under this license in July 2009.4
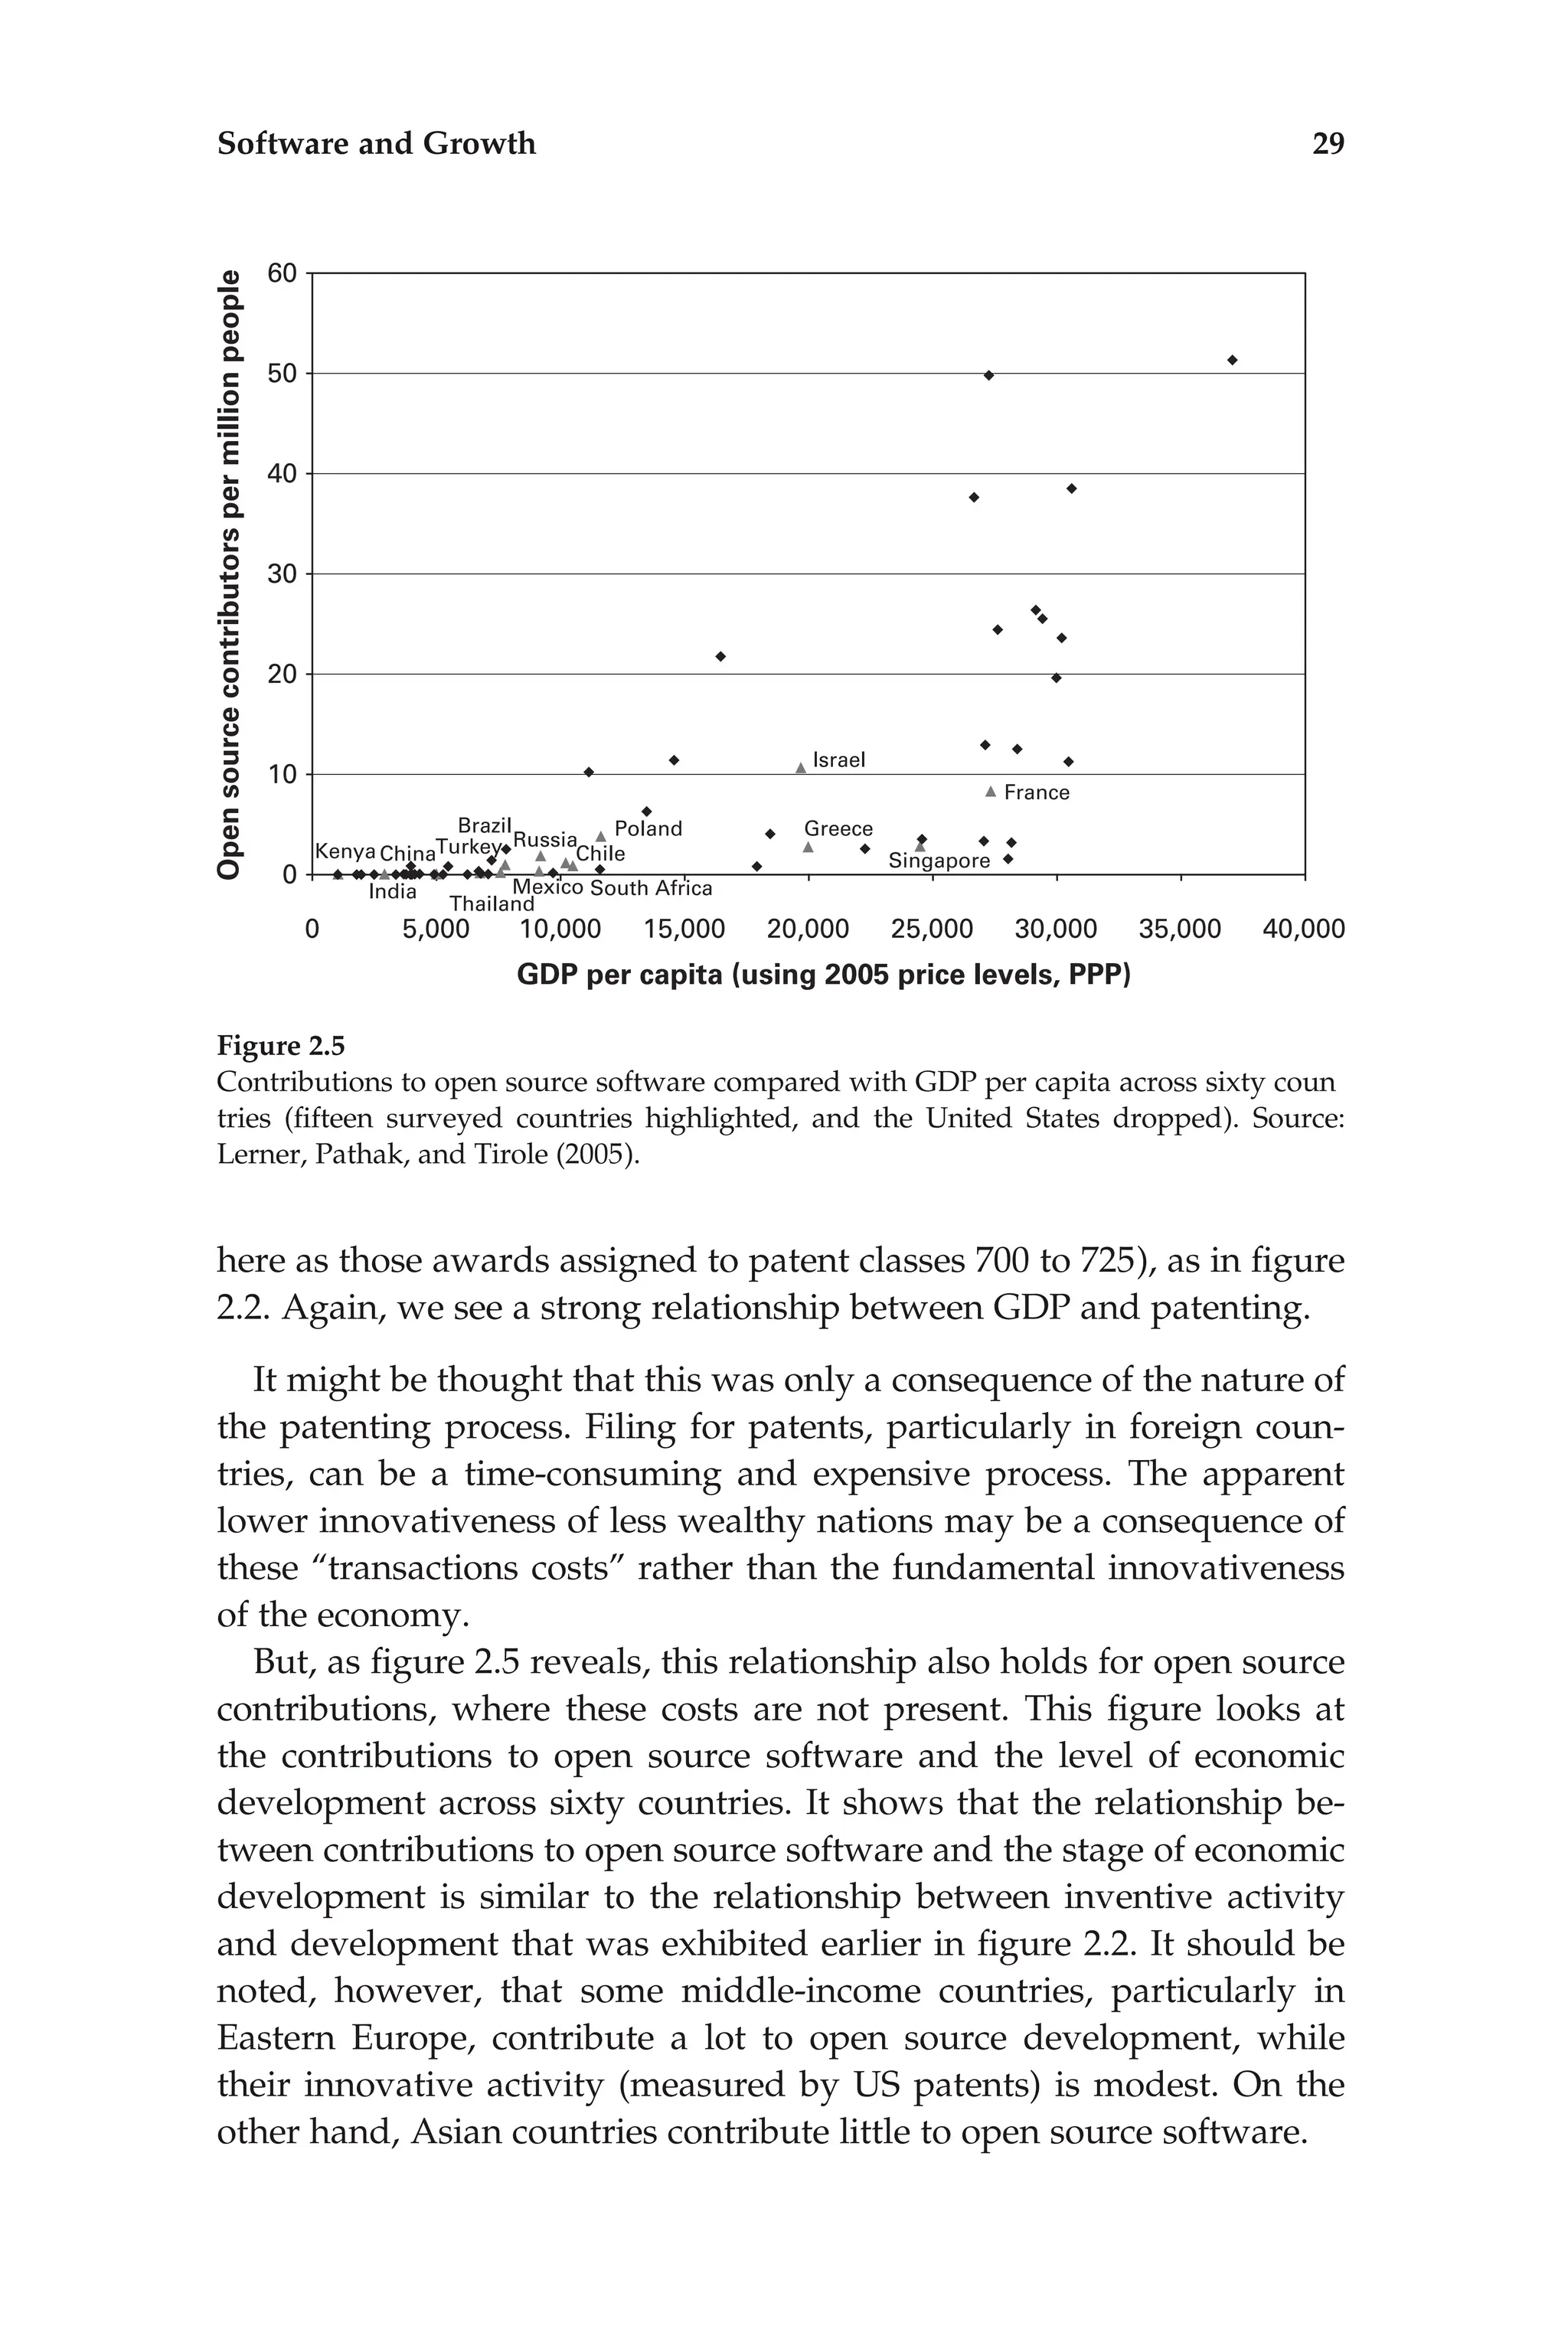
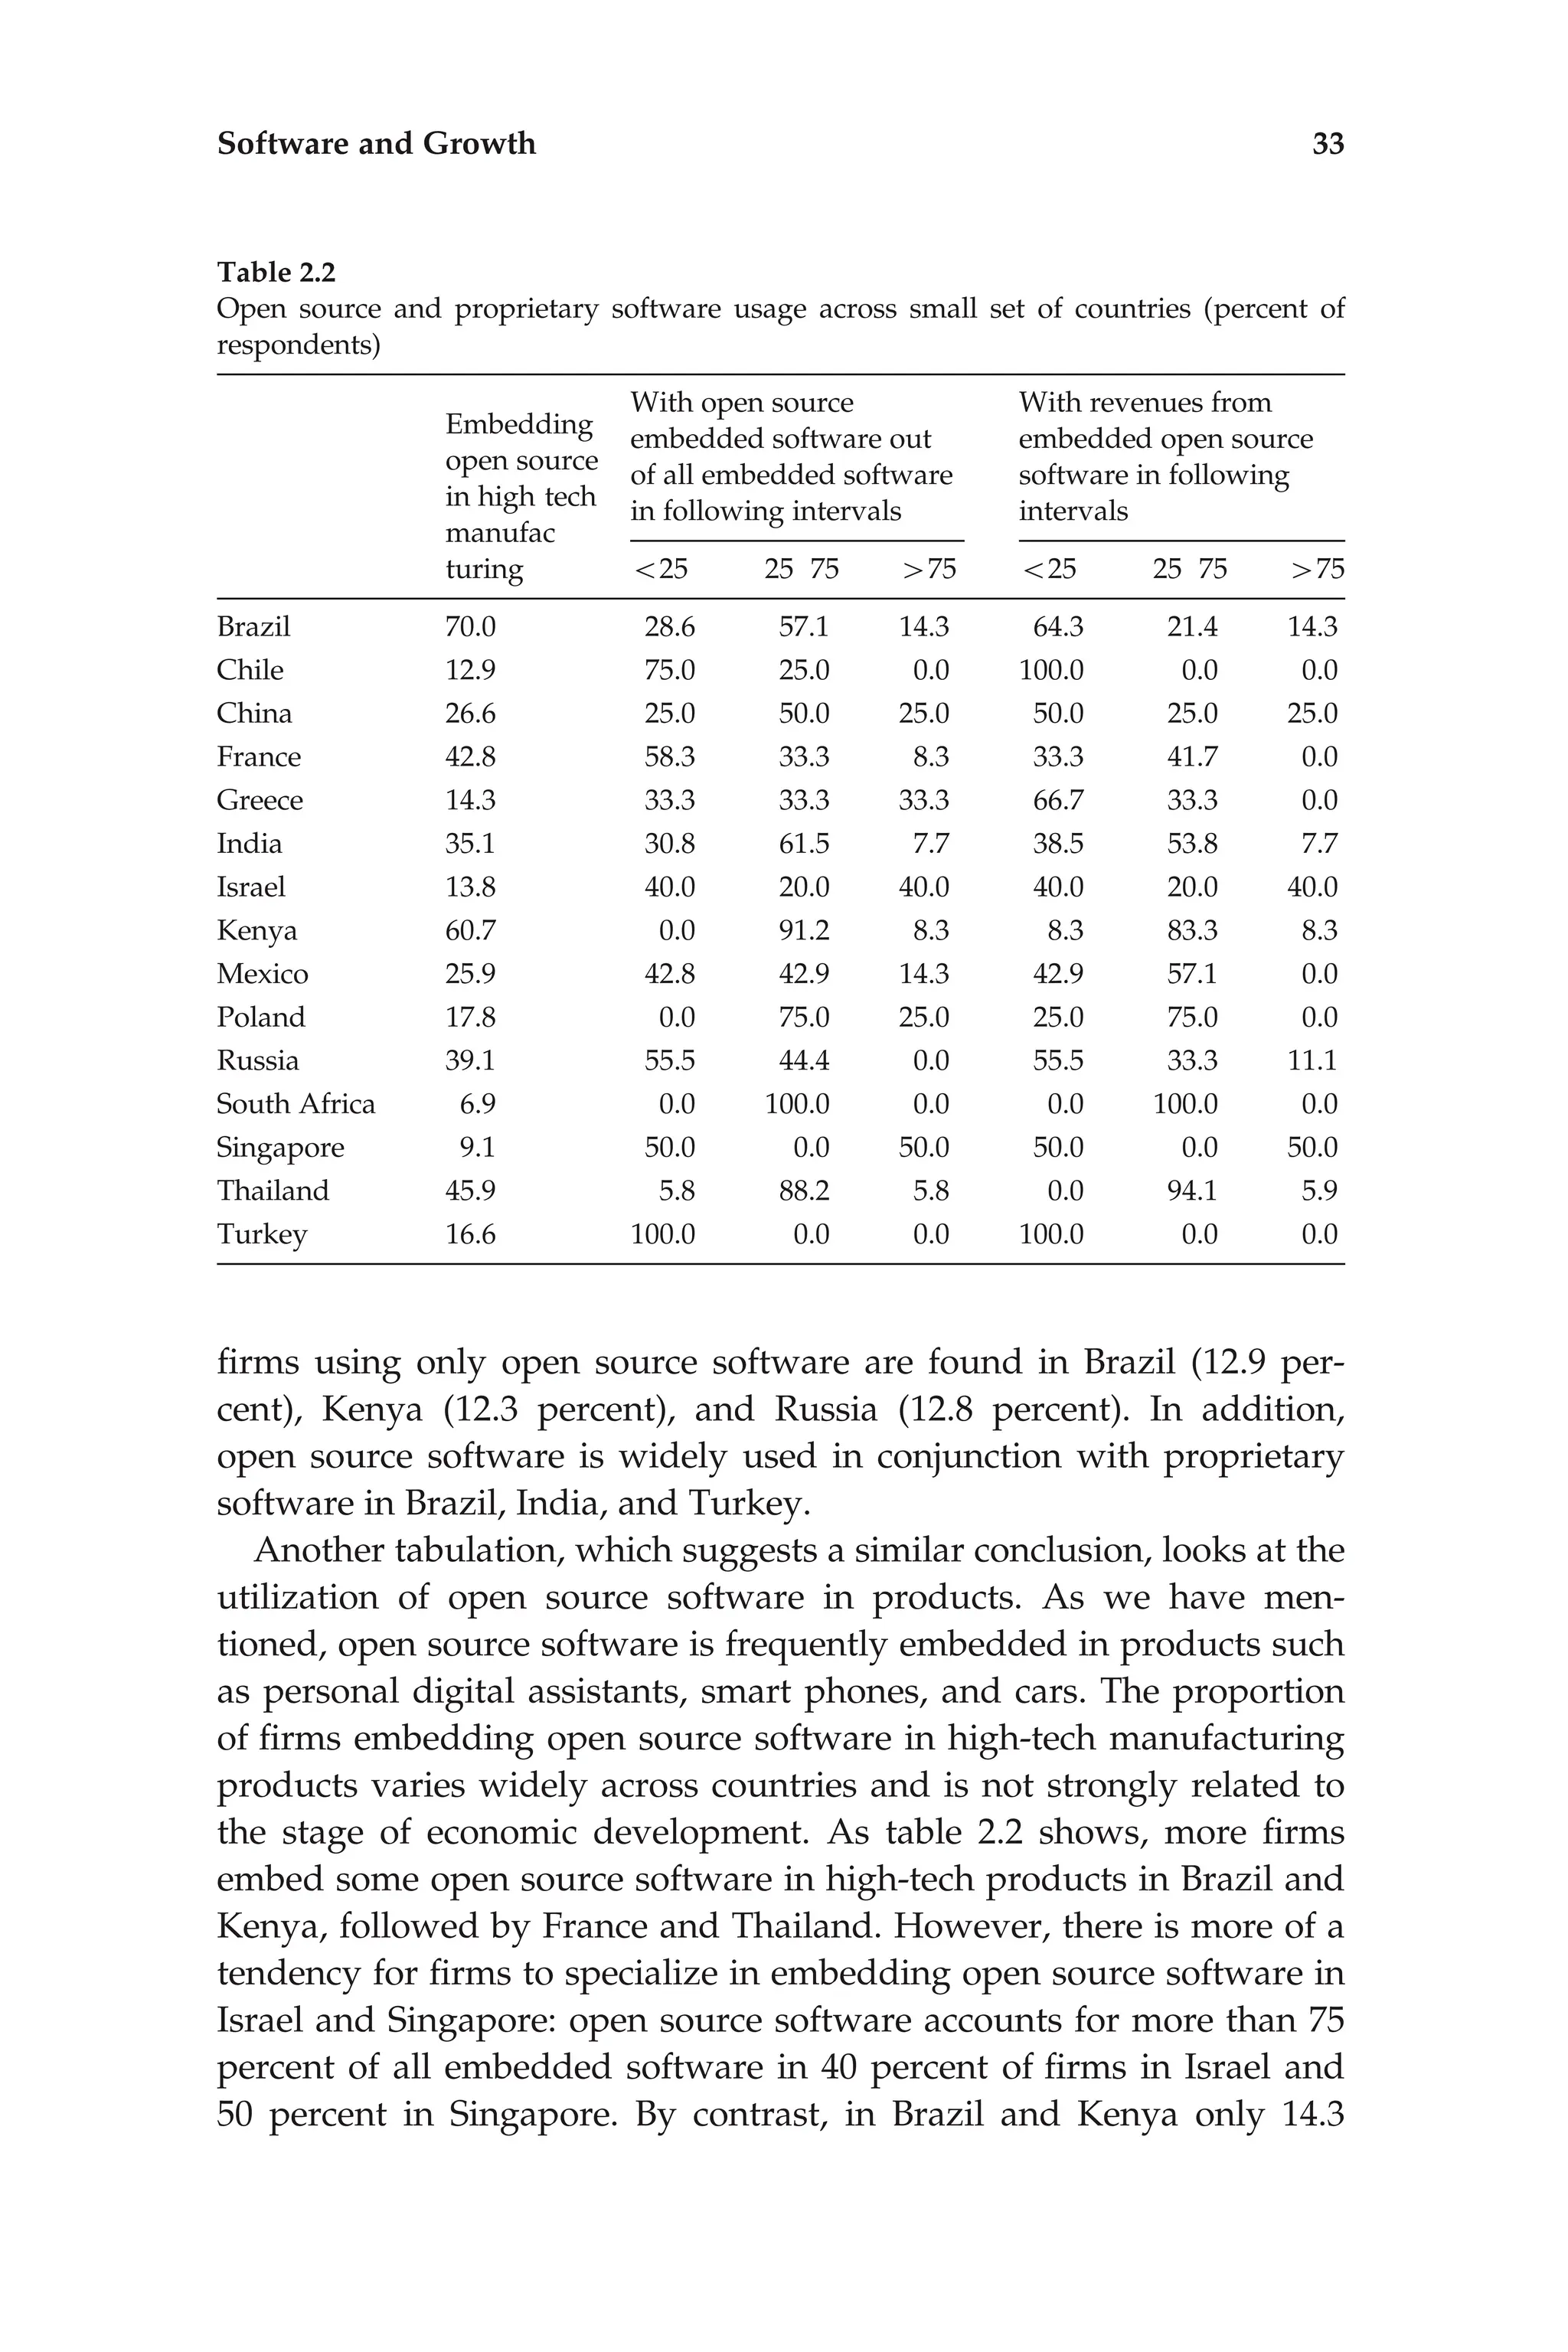
• Open source software is not a phenomenon that is confined to rich
countries. For better or for worse, the Brazilian and many other devel-
oping nation governments are promoting the use of open source soft-
ware as an alternative to proprietary products. Significant numbers of
contributors to open source software, in proportion to the population,
can be found in countries with per capita income as low as $10,000.
Open source software may be poised for rapid growth in the future.
The number of projects has exploded: the website SourceForge.net,
which provides free services to open source software developers, has
grown from a handful of projects in 2000 to well over two hundred
thousand open source projects today.5 Many of the projects seem to
have room to expand: for instance, the operating system Linux has
opportunities in the market for desktop operating systems; in 2009,
only one percent of the Web queries tracked by Net Applications came
from machines running Linux, although that share was gradually ris-
ing.6 More generally, the economic downturn appears to have acceler-
ated corporate interest in and adoption of open source solutions: for
instance, IDC recently revised its projected growth in revenue from
open source products through 2013 upward, to an annual rate of 22.4
percent.7
The growth of open source software is attracting considerable at-
tention from the public sector as well. Government commissions and
agencies have proposed—and in some cases implemented—a variety
of measures to encourage open source developers, including R&D sup-
port, encouragement for open source adoption, explicit preferences
in government procurement, and even mandates regarding software
3. http:/
/www.microsoft.com/presspass/exec/craig/05 03sharedSource.mspx (accessed
August 23, 2009).
4. http:/
/www.microsoft.com/presspass/features/2009/Jul09/07 20LinuxQA.mspx?rss
fdn=Toppercent20Stories (accessed August 23, 2009). It should be noted that Microsoft’s
motivations for this step were hotly questioned and debated (e.g., http:/
/blog.seattlepi
.com/microsoft/archives/174828.asp; accessed August 23, 2009).
5. http:/
/sourceforge.net/apps/trac/sourceforge/wiki/Whatpercent20ispercent20Source
Forge.net? (accessed August 25, 2009).
6. http:/
/marketshare.hitslink.com/report.aspx?qprid=8 (accessed August 23, 2009).
7. http:/
/finance.yahoo.com/news/Open Source Software Market bw 400190557.html?x
=0&.v=1 (accessed August 23, 2009).
2 Chapter 1](https://image.slidesharecdn.com/27848357-250522023909-004308e5/75/The-Comingled-Code-Open-Source-And-Economic-Development-Joshua-Lerner-Mark-Schankerman-19-2048.jpg)
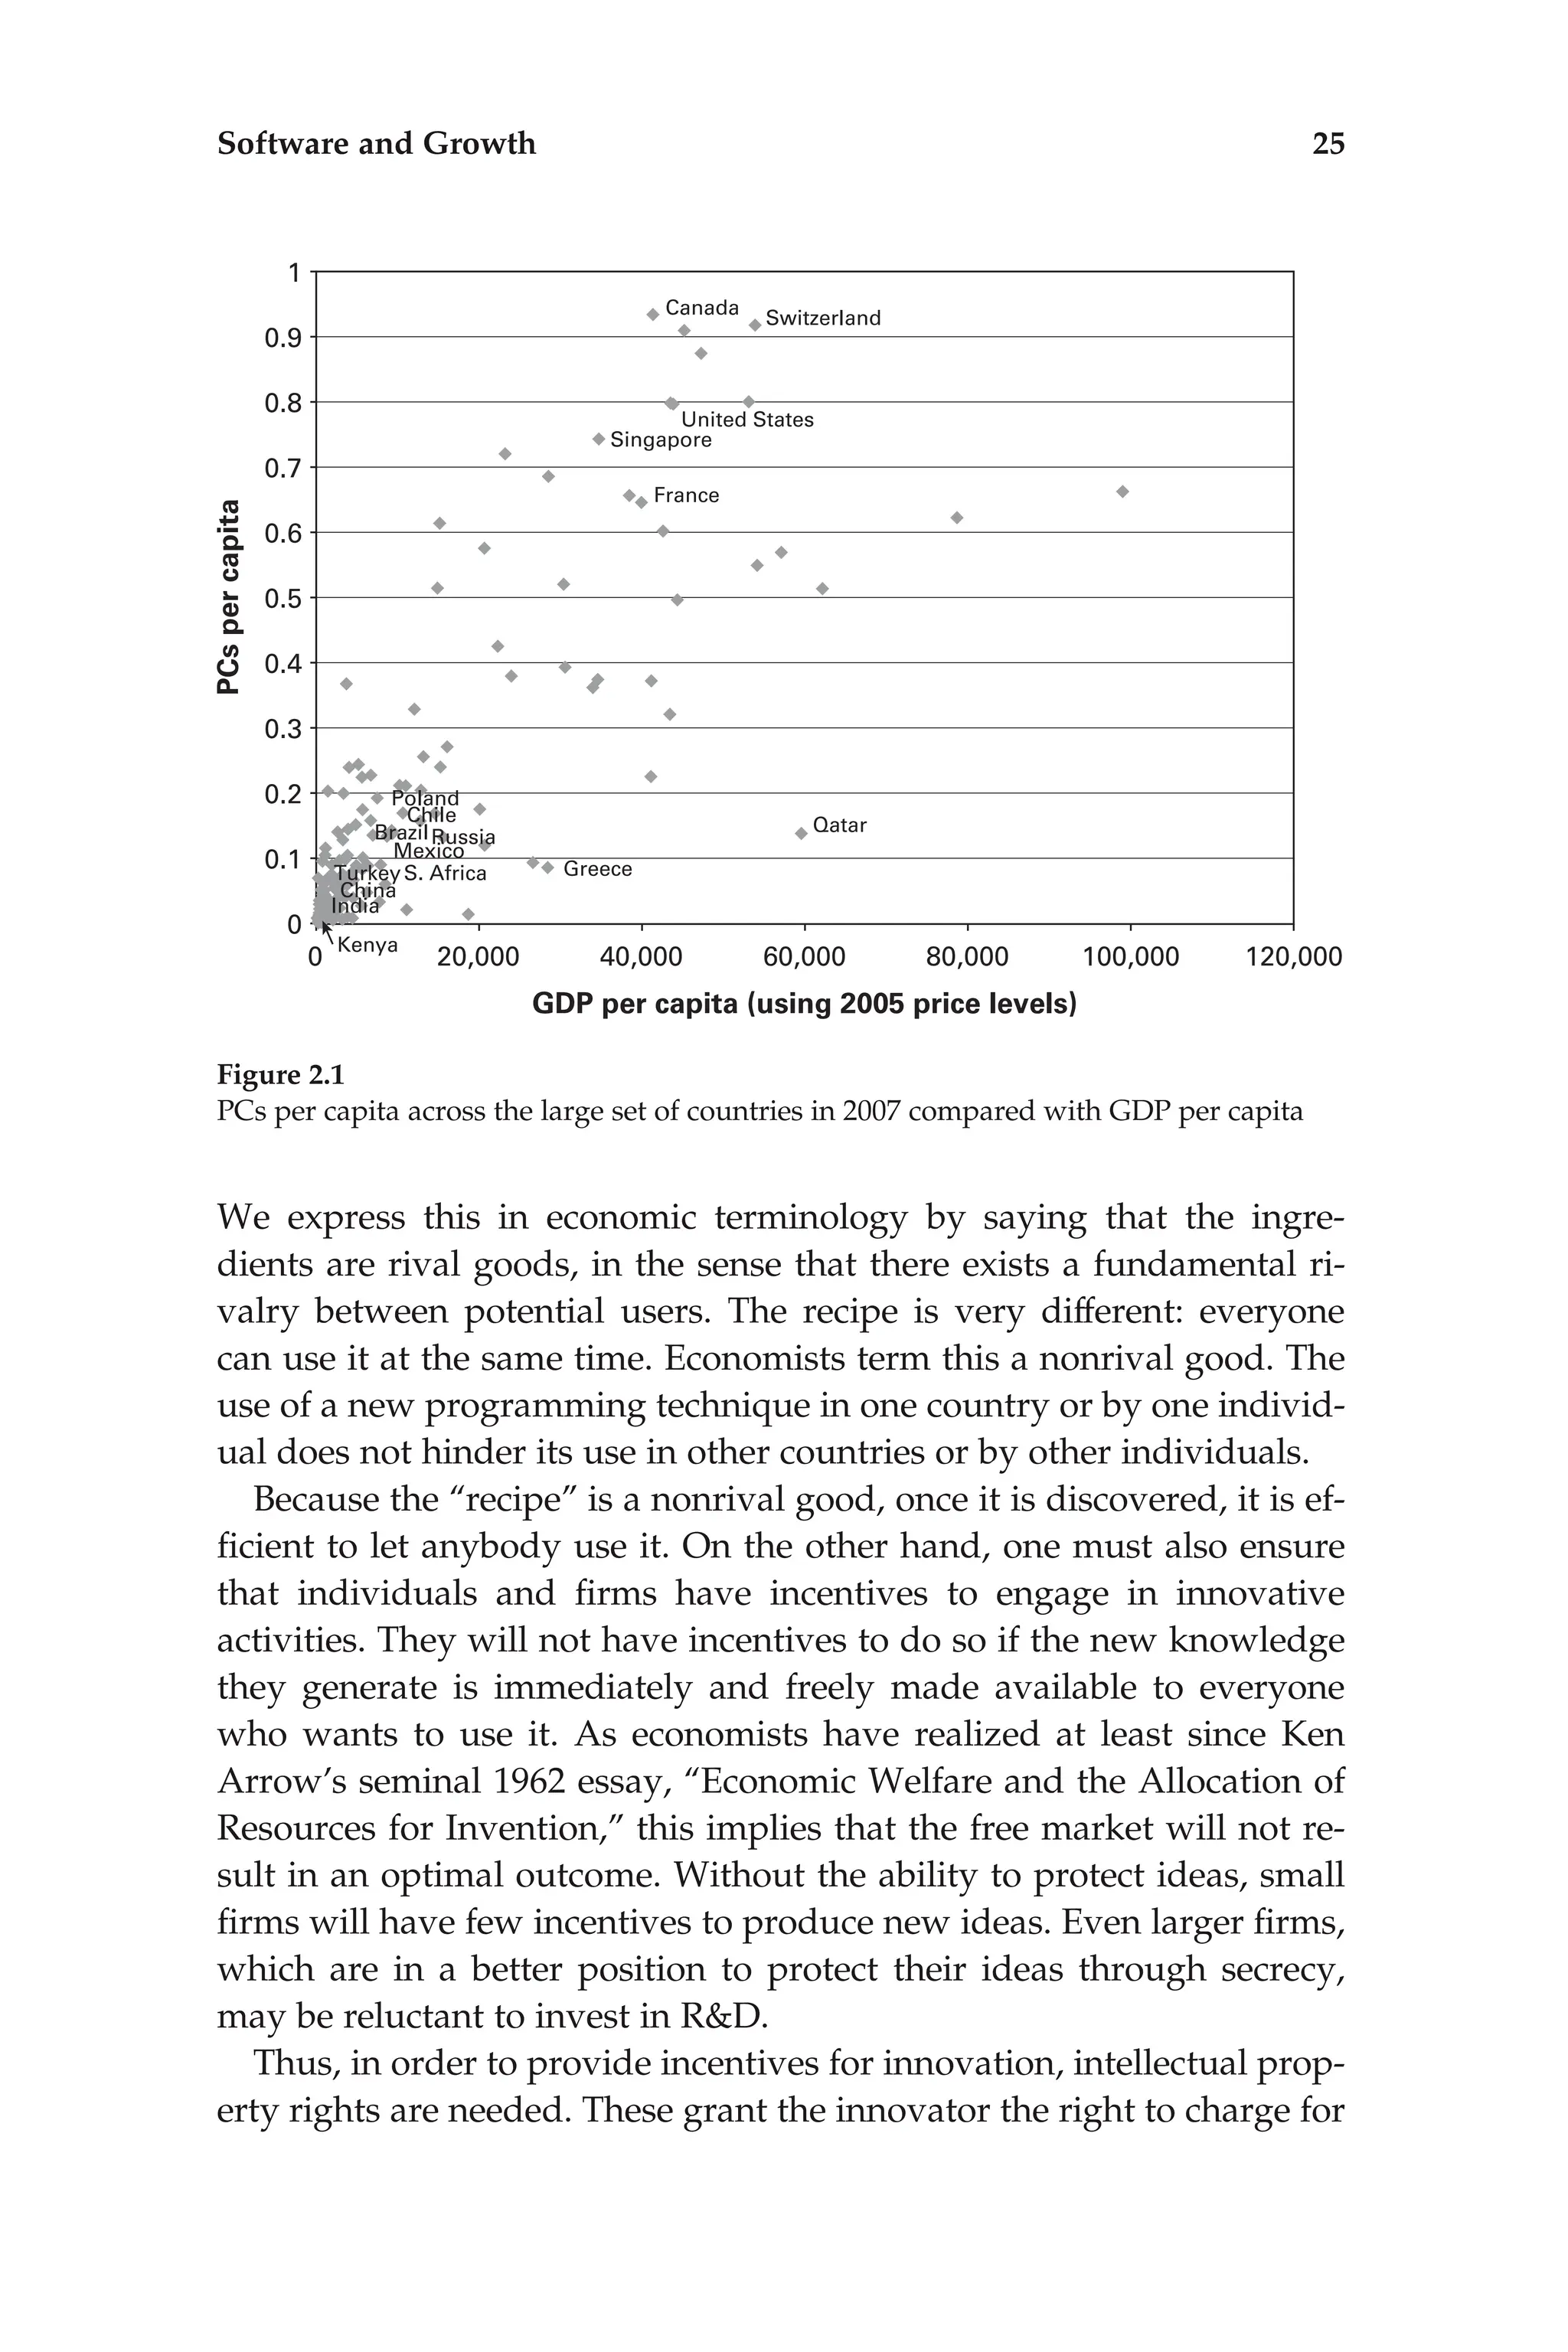
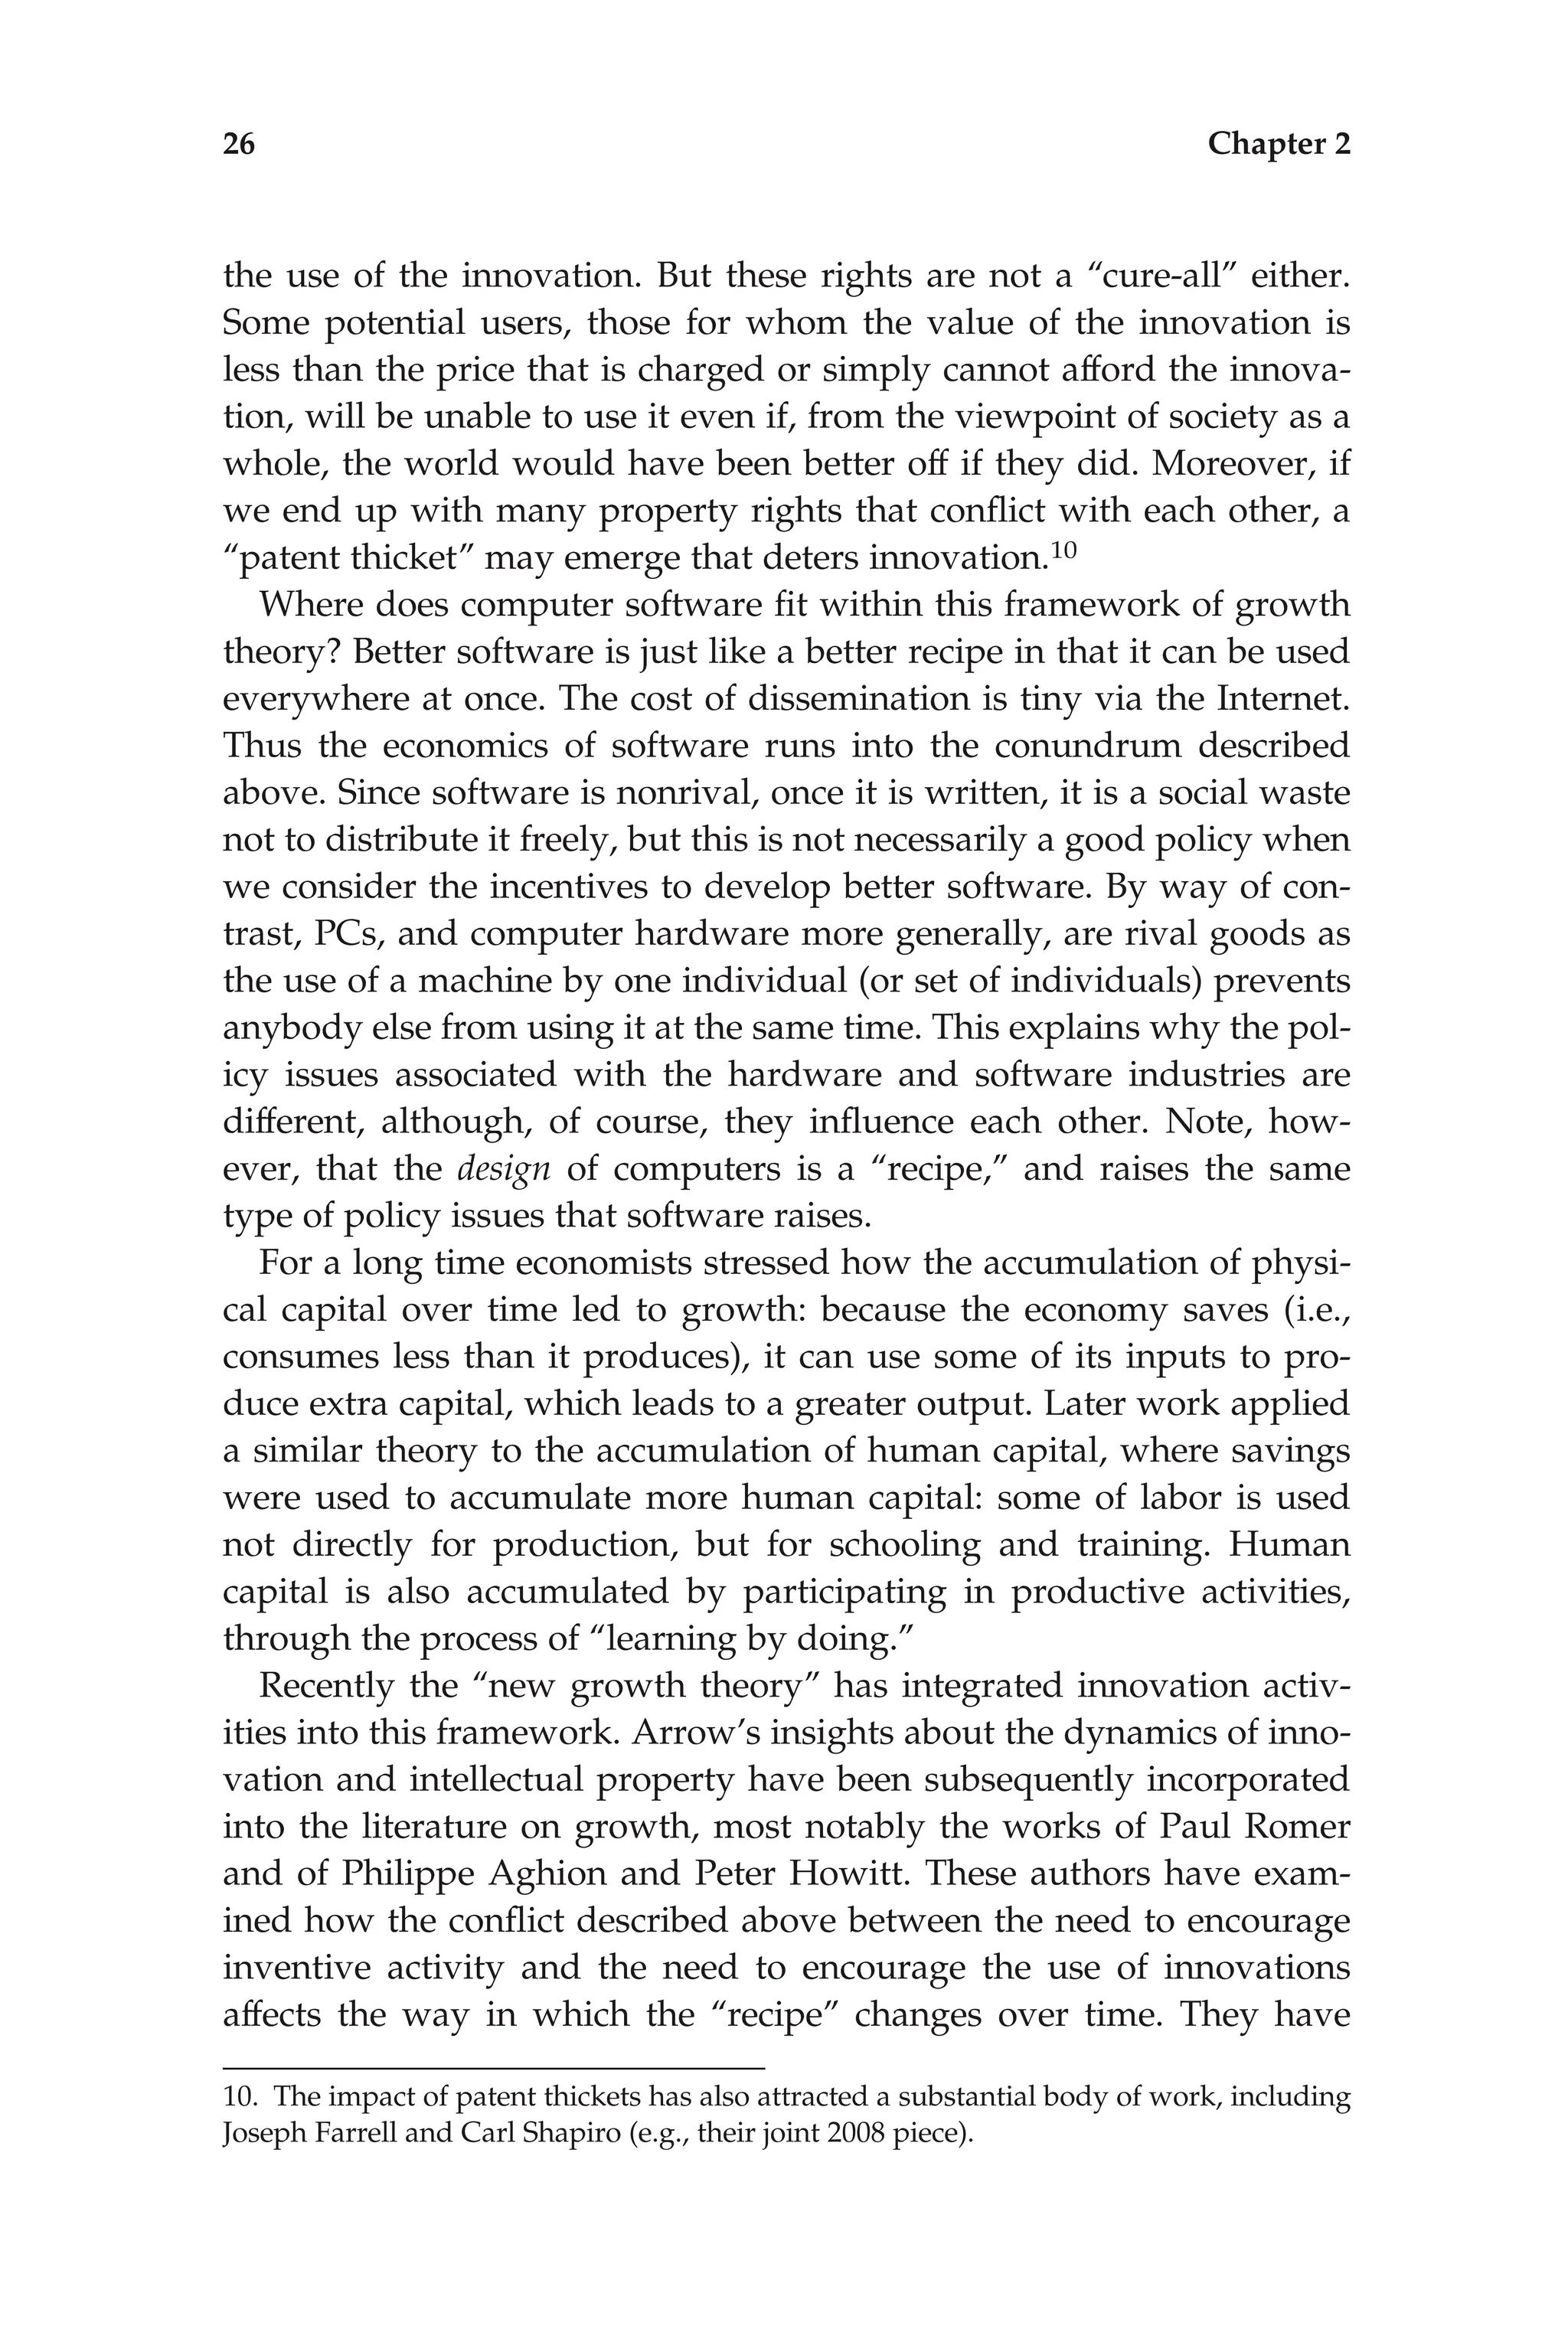
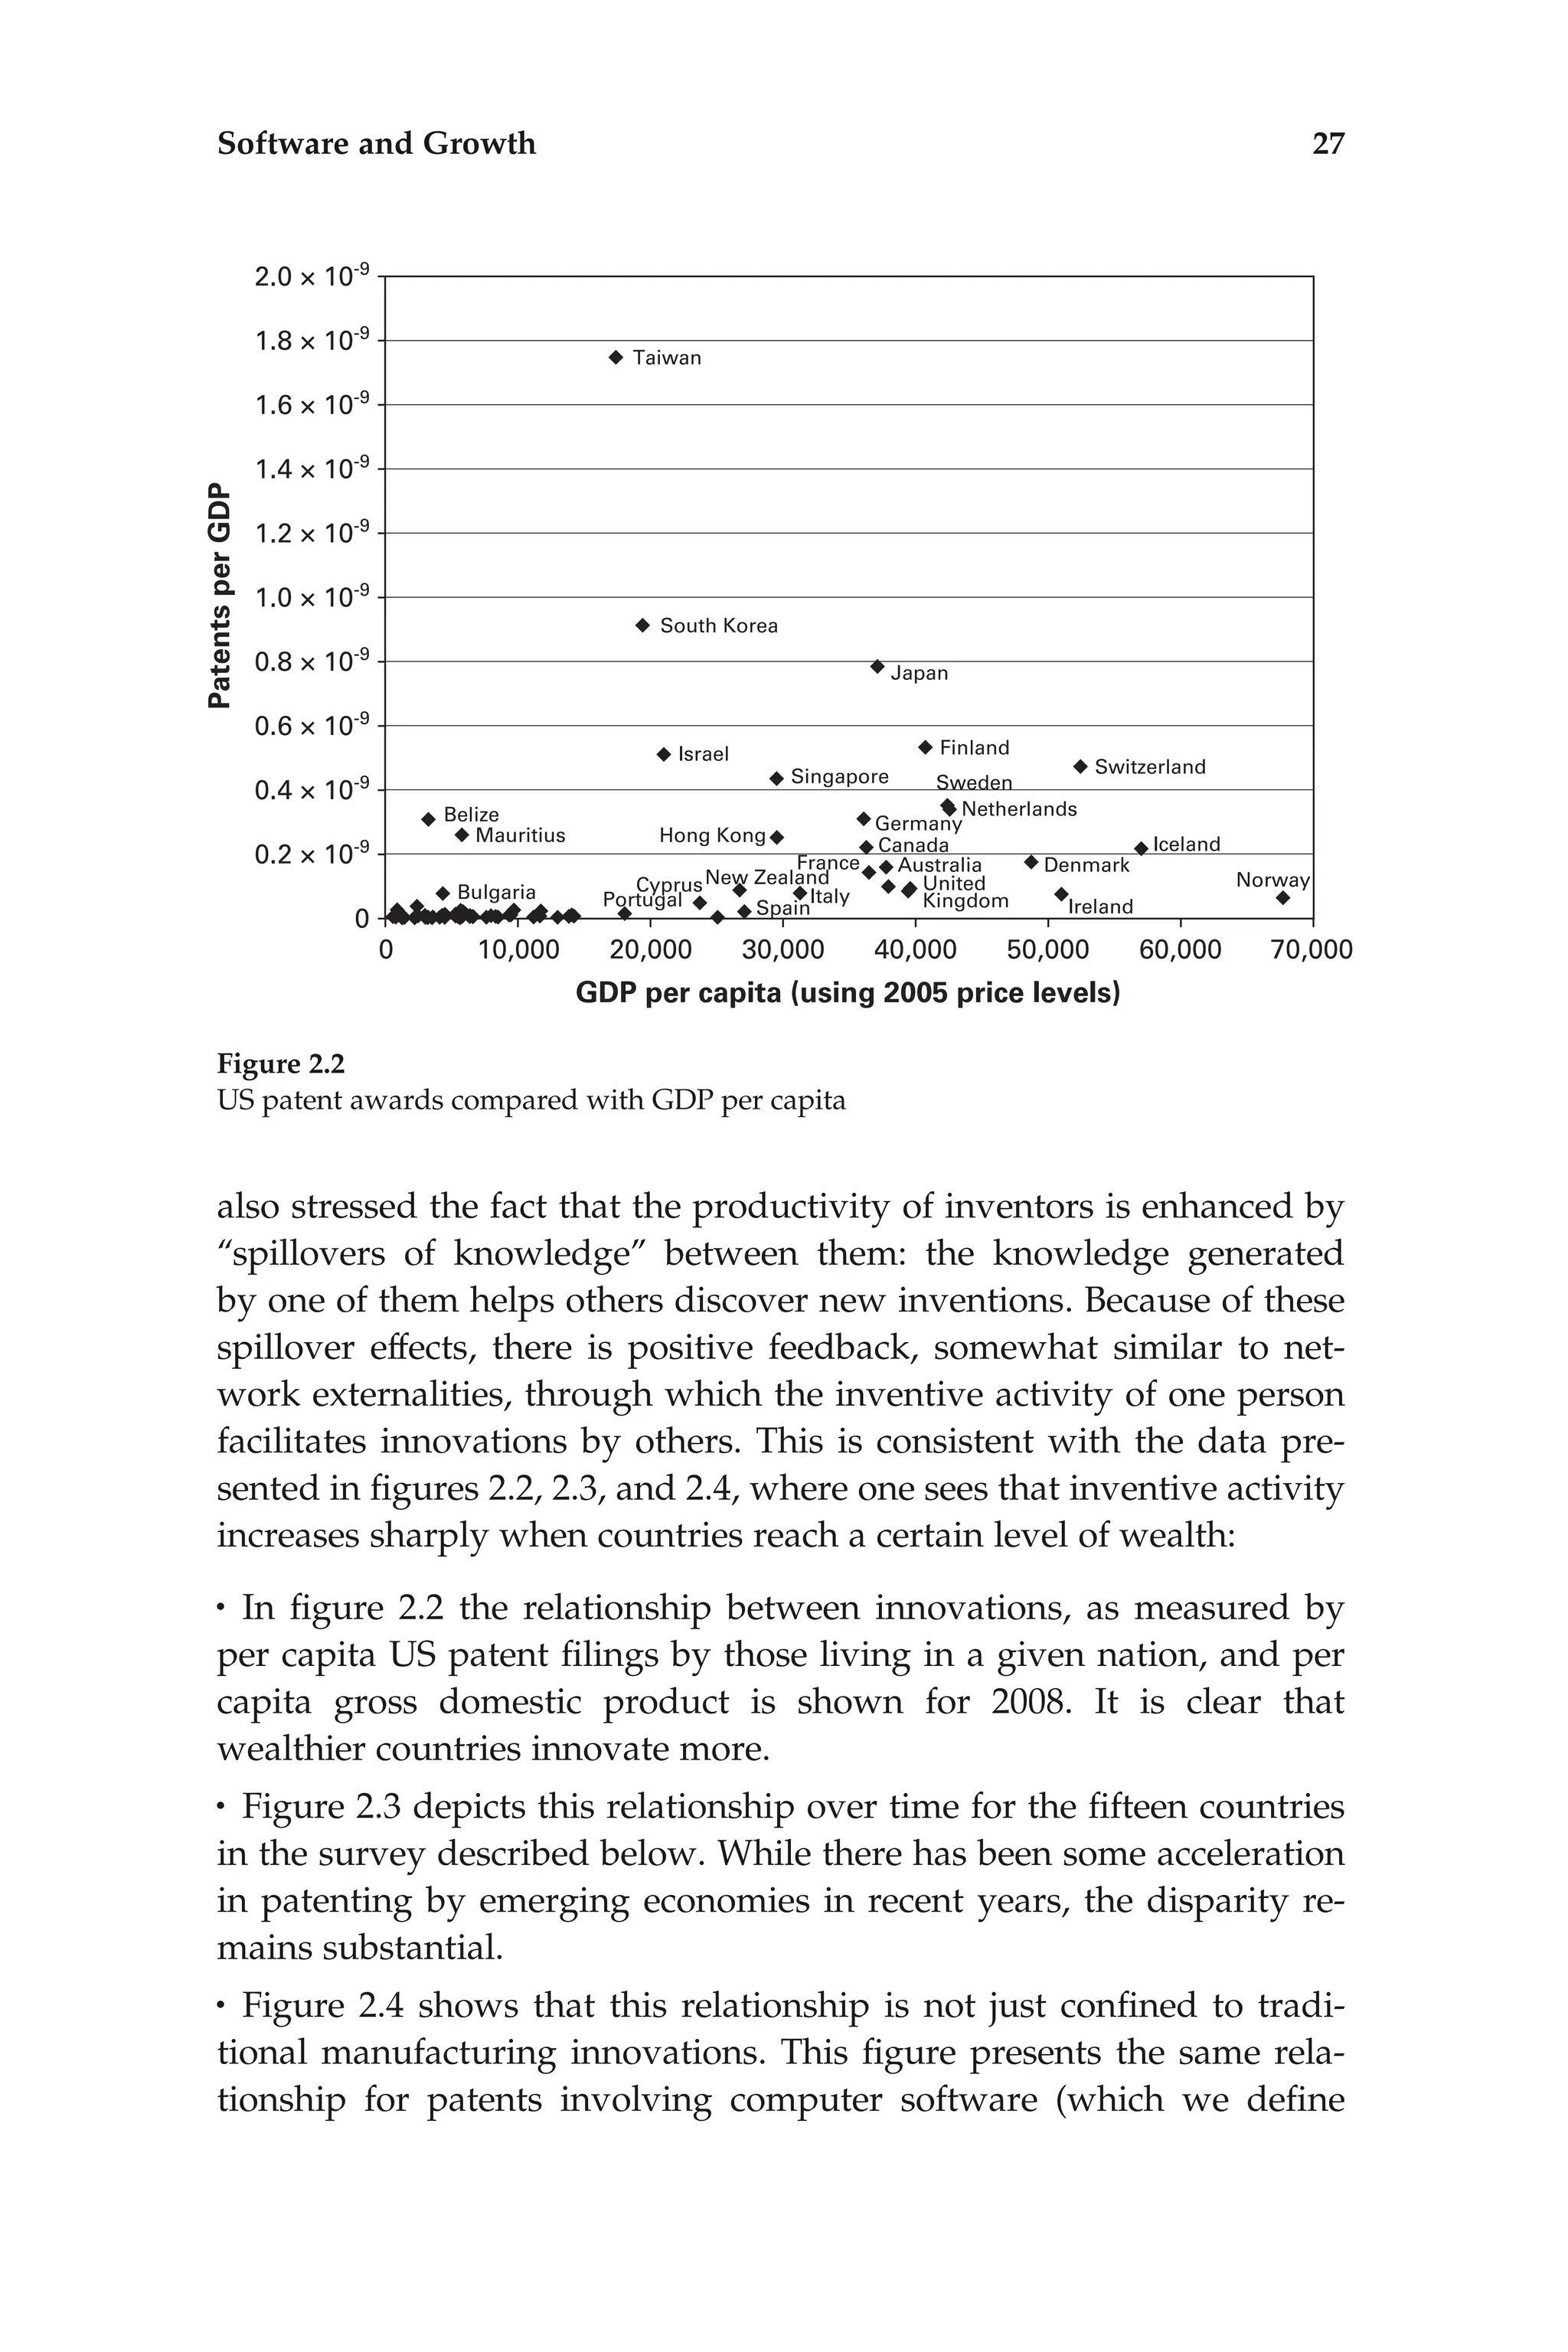
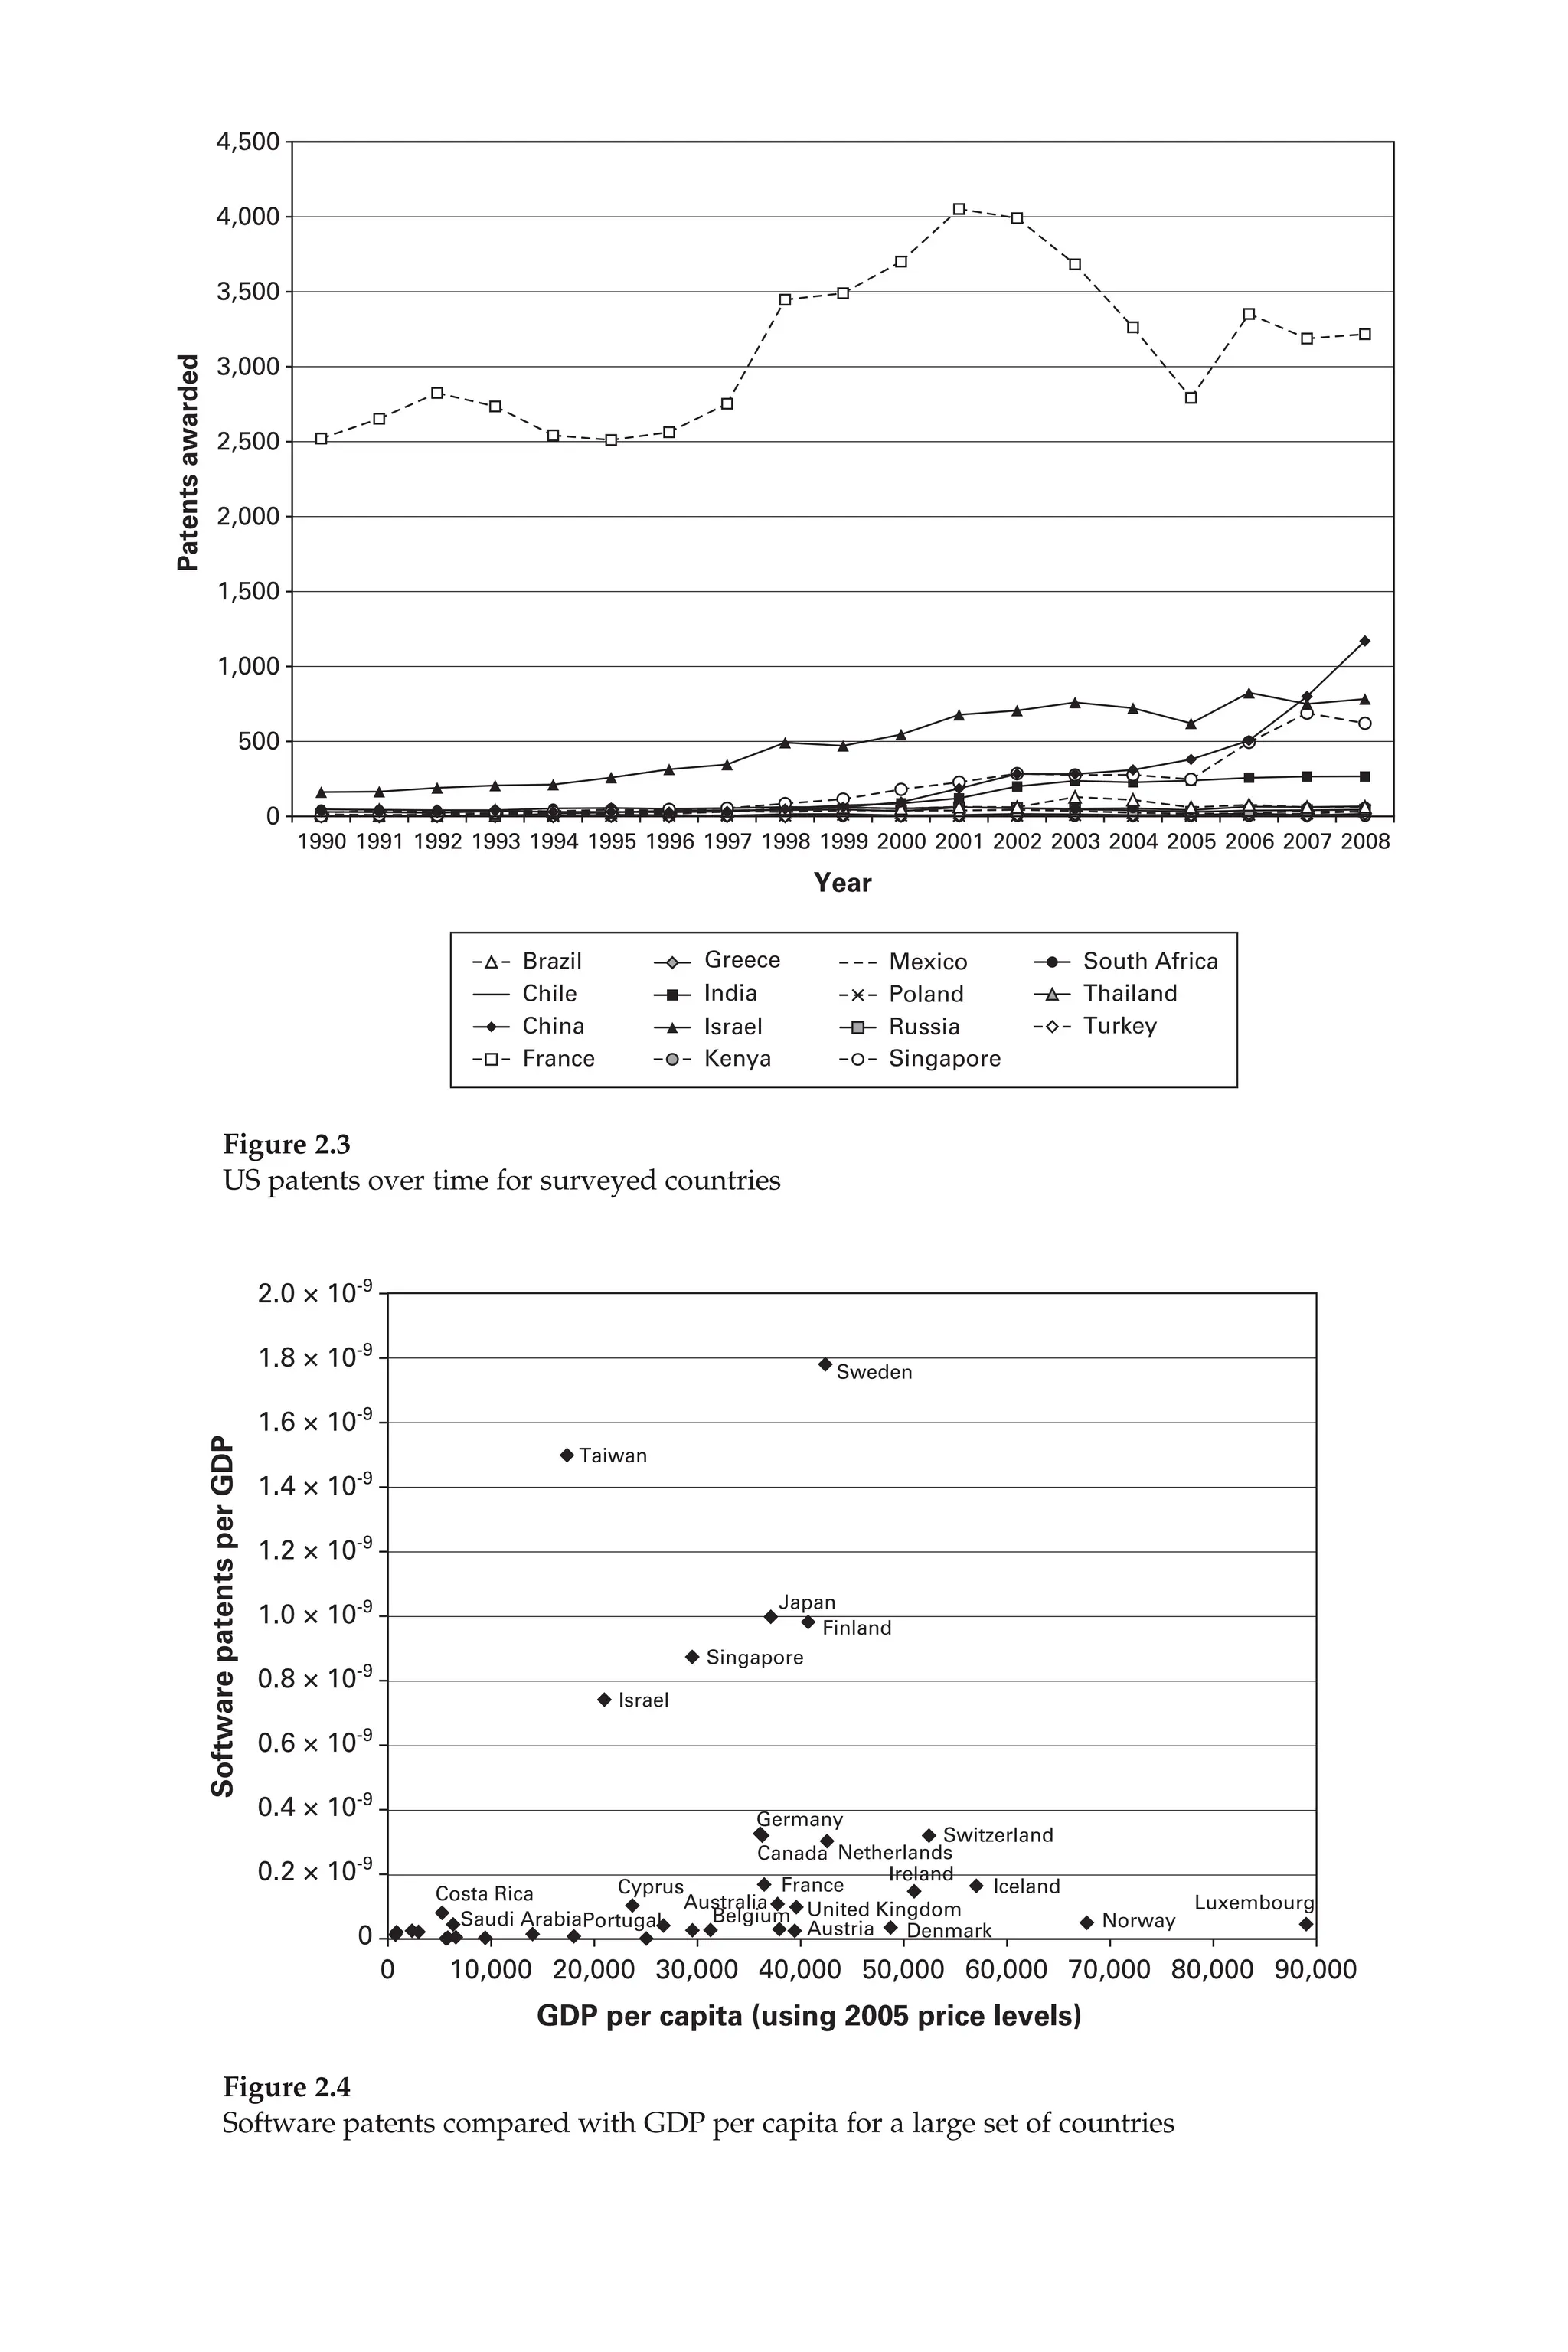
![It may be helpful to begin with a few definitions. Wikepedia1 defines
software as follows: ‘‘Computer software (or simply software) refers to
one or more computer programs and data held in the storage of a com-
puter for some purpose. Program software performs the function of the
program it implements, either by directly providing instructions to
the computer hardware or by serving as input to another piece of
software.’’
From the viewpoint of computer scientists, software can be divided
into two big classes: system software and application software. All
other subclasses belong to these two classes. System software helps
run the computer hardware and computer system. It includes oper-
ating systems, device drivers, programming tools, servers, window-
ing systems, utilities, and more. Application software allows a user
to accomplish one or more specific tasks. Typical applications in-
clude office suites, business software, educational software, databases,
and computer games. These distinctions focus on software as it is
delivered to the user, and forget an important class, ‘‘user-written
software . . . [which] tailors systems to meet the users’ specific needs.
User software includes spreadsheet templates, word processor macros,
scientific simulations, graphics, and animation scripts. Even email fil-
ters are a kind of user software. Users create this software themselves
and often overlook how important it is.’’2
These definitions are mostly applicable to software designed to work
on general purpose computers, as opposed to embedded systems,
which are ‘‘special purpose computer system[s], which [are] com-
pletely encapsulated by the device [they] control.’’ Embedded systems
are extremely important and are integrated in much of modern ma-
chinery from cars to machine tools, but in the discussion that follows
we will focus on software designed for general purpose computers, al-
though much of our discussion should carry over.
One thing is clear about the production of software: it is not just
done by software firms. For instance, a tabulation by Bessen and Hunt
1. http:/
/en.wikipedia.org/wiki/Software (accessed April 10, 2009). Wikipedia is a ‘‘free
content’’ encyclopaedia. Free content is the equivalent of open source for functional
work, art work or any other type of creative content.
2. According to the US Census Bureau (http:/
/www.census.gov/prod/ec02/ec0251i06
.pdf) in 2002, US software publishers had sales of $40 billion for ‘‘system software’’ and
$47 billion for application software. The rest of their revenues were mainly composed of
consulting services, custom development and support services (for a total of $13 billion).
Chapter 4 (on the supply of software) provides more detailed micro level survey evi
dence on the mix of software activities across countries.
16 Chapter 2](https://image.slidesharecdn.com/27848357-250522023909-004308e5/75/The-Comingled-Code-Open-Source-And-Economic-Development-Joshua-Lerner-Mark-Schankerman-33-2048.jpg)

![TENNIS TOPNOTCHERS. (Grantland Rice Sportlight) The Van
Beuren Corp. 1931. 1 reel.
© RKO Pathe Distributing Corp.; 5Apr31; MP2458.
THE TENNIS WIZARD. 1926. 2 reels. Based on a Van Bibber story
by Richard Harding Davis.
Credits: Supervision, George E. Marshall; director, Orville Dull;
adaptation, Edward P. Moran, Henry Johnson.
© William Fox (Fox Film Corp., author); 7Nov26; LP23297.
THE TENOR. Gold Seal. 1915. 3 reels.
Credits: Producer, Leon Kent; story, Hobart Henley, Leon Kent;
scenario, F. McGrew Willis.
© Universal Film Mfg. Co., Inc.; 14Sep15; LP6369.
TENSE MOMENTS. (News World of Sports) 1935. 1 reel, sd.
Credits: Narrative, Jack Kofoed; described by Ford Bond.
© Columbia Pictures Corp.; 9Sep35; MP5848.
TENTH AVENUE. 1928. 7 reels. From the stage play by John
McGowan and Lloyd Griscom.
Credits: Producer and director, William C. De Mille; screenplay,
Douglas Z. Doty; film editor, Adelaide Cannon.
© Pathe Exchange, Inc.; 11Jul28; LP25442.
TENTH AVENUE KID. 1938. 7 reels, sd.
Credits: Associate producer, Harry Grey; director, Bernard
Vorhaus; original story, Gordon Kahn, Adele Buffington;
screenplay, Gordon Kahn; film editor, William Morgan.
© Republic Pictures Corp.; 22Aug38; LP8351.
THE TENTH CASE. Presented by William A. Brady. © 1917.
Credits: Director, George Kelson; story, Budd [pseud. of Robert
Hull].](https://image.slidesharecdn.com/27848357-250522023909-004308e5/75/The-Comingled-Code-Open-Source-And-Economic-Development-Joshua-Lerner-Mark-Schankerman-63-2048.jpg)
![editor, Frederick Bain; music director, Frank Sanucci.
© Grand National Films, Inc.; 1Nov37; LP7591.
THE TEXAN. 1920. 5 reels. From the story by James B. Hendryx.
Credits: Director, Lynn F. Reynolds; scenario, Lynn F. Reynolds,
Julius Furthman.
© William Fox (Fox Film Corp., author); 31Oct20; LP15749.
THE TEXAN. 1930. 7,142 ft., sd. From the story "The Double-Dyed
Deceiver" by O. Henry [pseud. of William Sydney Porter].
Credits: Director, John Cromwell; screenplay, Daniel N. Rubin;
adaptation, Oliver H. P. Garrett; film editor, Verna Willis.
© Paramount Publix Corp.; 10May30; LP1293.
THE TEXANS. Presented by Adolph Zukor. 1938. 10 reels, sd.
Credits: Producer, Lucien Hubbard; director, James Hogan; story,
Emerson Hough; screenplay, Bertrand Millhauser, Paul Sloane,
William Wister Haines.
© Paramount Pictures, Inc.; 12Aug38; LP8203.
THE TEXAS BAD MAN. 1932. 7 reels.
Credits: Director, Edward Laemmle; story and screenplay, Jack
Cunningham.
© Universal Pictures Corp.; 18Jun32; LP3097.
THE TEXAS BEARCAT. Presented by Jesse Goldburg. Released by F.
B. O. 1925. 5 reels.
Credits: Written and directed by Reaves Eason; story, F. J.
Rhetore; continuity, George H. Plympton.
© R-C Pictures Corp.; 31May25; LP21554.
TEXAS BUDDIES. 1932. 6 reels.
Credits: Direction, story, and adaptation, Robert N. Bradbury.
© World Wide Pictures, Inc.; 28Aug32; LP3500.](https://image.slidesharecdn.com/27848357-250522023909-004308e5/75/The-Comingled-Code-Open-Source-And-Economic-Development-Joshua-Lerner-Mark-Schankerman-75-2048.jpg)
![Credits: Director, William A. Seiter; story and continuity, Beatrice
Van.
© Universal Pictures Corp.; 29Nov27; LP24716.
THANKS FOR THE LOBSTER. 1914. 1 reel.
Credits: Director, Wally Van [pseud. of Wally Van Nostrand].
© Vitagraph Co. of America (Roy L. McCardell, author); 14Oct14;
LP3535.
THANKS FOR THE MEMORY. 1938. 1 reel, sd.
Credits: Director, Dave Fleischer; animation, Roland Crandall.
© Paramount Pictures, Inc.; 25Mar38; MP8282.
THANKS FOR THE MEMORY. Presented by Adolph Zukor. 1938. 8
reels, sd. Based on a play by Albert Hackett and Frances
Goodrich.
Credits: Director, George Archainbaud; screenplay, Lynn Starling;
film editor, Alma Macrorie.
© Paramount Pictures, Inc.; 18Nov38; LP8435.
THANKS, MR. CUPID. Presented by E. W. Hammons. 1936. 2 reels,
sd.
Credits: Producer, Al Christie; story, music, and lyrics, Charlie
Williams, Marcy Klauber.
© Educational Productions, Inc.; 24Jan36; LP6084.
THANKSGIVING DAY. 1928. 1 reel, sd.
© Vitaphone Corp.; 18Aug28; MP5266.
THARON OF LOST VALLEY. SEE The Crimson Challenge.
THAT BOY FROM THE EAST. © 1913.
© Société Française des Film et Cinématographes Éclair; title,
descr. & 36 prints, 7Feb13; LU347.
THAT BOY FROM THE POORHOUSE. © 1914.](https://image.slidesharecdn.com/27848357-250522023909-004308e5/75/The-Comingled-Code-Open-Source-And-Economic-Development-Joshua-Lerner-Mark-Schankerman-80-2048.jpg)