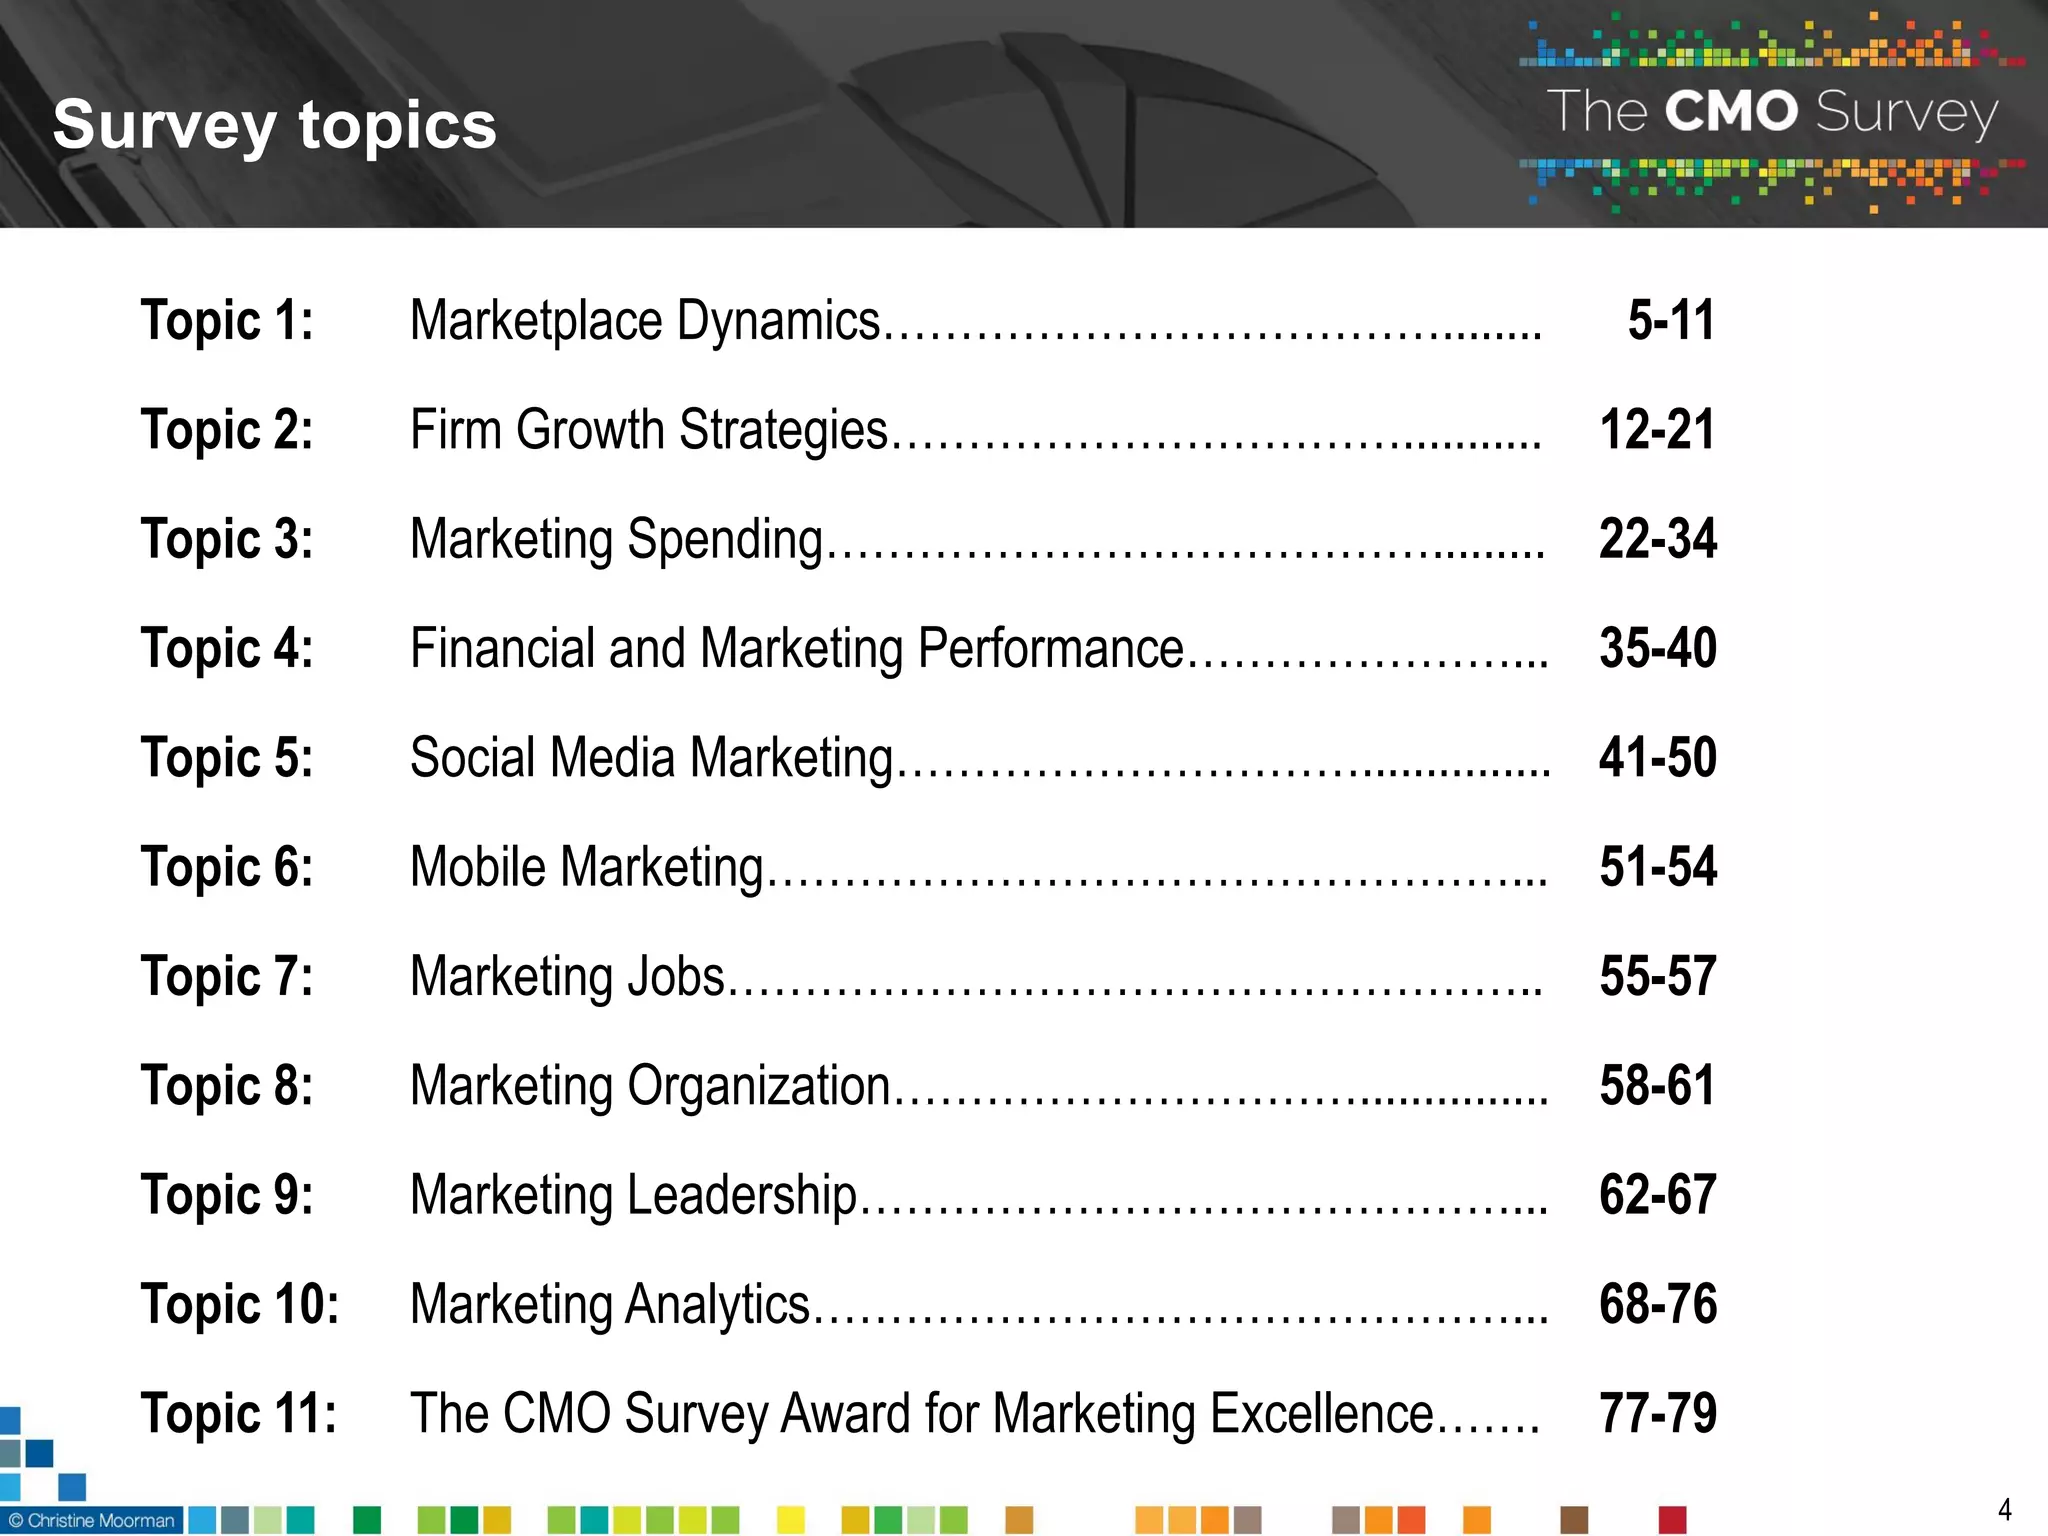
The CMO Survey is administered twice a year via an Internet survey to collect and disseminate the opinions of top marketers. It aims to predict market trends and improve marketing value. The February 2017 survey was the 18th administration, with 388 respondents out of 2813 marketers contacted, a 13.8% response rate. Results are reported in aggregate form or by industry/firm characteristics. The survey covers topics like the economy, growth strategies, marketing spending, performance, social media, mobile, jobs, leadership and analytics.
The CMO Survey Report: Highlight and Insights August 2014christinemoorman
The CMO Survey collects and disseminates the opinions of top marketers in order to predict the future of markets, track marketing excellence, and improve the value of marketing in firms and in society.
The CMO Survey Highlights and Insights February 2015christinemoorman
The CMO Survey collects and disseminates the opinions of top marketers in order to predict the future of markets, track marketing excellence, and improve the value of marketing in firms and in society.
The Chief Marketing Officer Council: Getting Involved as a SponsorCMOCouncil
The CMO Council is a global channel of insight, access and influence, representing over 8,500 members across 110 countries. Tapping into this valuable channel can happen in a number of ways. This presentation shares the makeup of the CMO Council membership, its global reach and digital footprint and ways in which sponsors can engage with the peer-powered network of marketing leaders.
In Q4 of 2013, we surveyed over 100 retail marketing executives across the United States on what technologies, data, and innovative ideas were most important to them. Not only that, we asked them what there current budgets and planned budgets were for all these strategies over the next 5 years. The results were surprising!
More and more, marketers are being tasked with proving the return on investment (ROI) of their marketing initiatives. This can pose a challenge, because there are many ways to determine the results and value of each campaign. For our most recent Marketing Maven survey, we wanted to know more about how industrial marketers handle proving ROI and what challenges they encounter.
Across sectors and regions, business leaders are recognizing the competitive advantage of
superior customer experience and the value that resides not only in what a company delivers
for its customers, but in how it delivers products and services. Where companies once
could differentiate themselves by product or efficiency, distinctiveness today increasingly
lies in creating a seamless, omnichannel customer experience.
As leaders of McKinsey’s Customer Experience Service Line, we are delighted to present this
volume of Customer experience: New capabilities, new audiences, new opportunities. This
compendium draws from the collective thinking of our experts and practitioners, and follows
by just 18 months our first volume of thinking on the subject. That in itself speaks to how
rapidly the landscape of customer experience is evolving, and how intently business leaders
are focused on it.
their reporting and trackingHow Industrial Marketers Track ROI?Andrew Flynn
More and more, marketers are being tasked with proving the return on investment (ROI) of their marketing initiatives. This can pose a challenge, because there are many ways to determine the results and value of each campaign. For our most recent Marketing Maven survey, we wanted to know more about how industrial marketers handle proving ROI and what challenges they encounter.
Thought Leadership Disrupted: New Rules for the Content AgeHeather Taylor
Four rules that help brands and publishers think about their audience and how to reach them. Based on research from The Economist: http://www.missingthemark.ads.economist.com/ & http://tldisrupted.com/
The most comprehensive marketing report of 2015 is here. Salesforce surveyed over 5,000 marketers globally to understand top priorities for 2015 across all digital channels. Inside this second annual report, you get an unparalleled look at the modern marketer’s mindset, including:
3 most pressing business challenges
Top 5 areas for increased spending
Biggest changes from 2014
Hottest trends in social, mobile, and email marketing
It’s no surprise that B2B and B2C marketers have different goals and strategies. In January, we released new research on the overall state of marketing — including businesses of all sizes and types, based on the responses of 5,000+ global marketers.
Now we’re separating B2B from B2C marketers. Today, we present you with data about B2B trends, goals, and obstacles in 2015 with the 2015 State of B2B Marketing.
Using survey responses from 2,100+ B2B marketers, this report takes a look at what B2B marketers are really thinking and dealing with this year.
Marketing Mix Models In a Changing EnvironmentAquent
Marketing Mix Models have been used successfully for years at consumer package goods (CPG) companies to increase their marketing effectiveness and efficiency. The four Ps (Product, Placement, Price, and Promotion) were as far as the models needed to go. Broad–based media was and is very expensive, which kept competition to a minimum. However, the marketing environment has changed in many ways and must be considered when looking to these models to improve marketing performance.
From Digital Attribution to Marketing Mix ModellingPetri Mertanen
MeasureCamp Amsterdam 2018. We are good when it comes to measuring advertising but should you also thing what kind of effect other marketing P's have on sales?
When it comes to engaging with your customers, do you have the right formula to reach them through their CHANNEL of preference, with the CONTENT they want and at their CONVENIENCE ? How engaged is your brand?
This year, Alterian surveyed nearly 1,500 marketing professionals to see just where brands stand when it comes to expenditure, social media, level of personalization, and whether brands are ready for growth or at risk.
In this presentation Donnell Wright and Russ Taufa, of Alterian's research consulting group, examine survey findings and provide insight into how brand engagement is shifting as well as discuss new marketing opportunities for 2011.
Medical Office Marketing ROI MeasurmentMichael Wolfe
This is a case study pertinent to hospitals and multi-office medical and dental practices that will enable them to do smarter and more effective marketing through a marketing effectiveness measurement system
Similar to The CMO Survey Highlights and Insights February 2017 (20)
Personal Brand Statement:
As an Army veteran dedicated to lifelong learning, I bring a disciplined, strategic mindset to my pursuits. I am constantly expanding my knowledge to innovate and lead effectively. My journey is driven by a commitment to excellence, and to make a meaningful impact in the world.
Remote sensing and monitoring are changing the mining industry for the better. These are providing innovative solutions to long-standing challenges. Those related to exploration, extraction, and overall environmental management by mining technology companies Odisha. These technologies make use of satellite imaging, aerial photography and sensors to collect data that might be inaccessible or from hazardous locations. With the use of this technology, mining operations are becoming increasingly efficient. Let us gain more insight into the key aspects associated with remote sensing and monitoring when it comes to mining.
RMD24 | Retail media: hoe zet je dit in als je geen AH of Unilever bent? Heid...BBPMedia1
Grote partijen zijn al een tijdje onderweg met retail media. Ondertussen worden in dit domein ook de kansen zichtbaar voor andere spelers in de markt. Maar met die kansen ontstaan ook vragen: Zelf retail media worden of erop adverteren? In welke fase van de funnel past het en hoe integreer je het in een mediaplan? Wat is nu precies het verschil met marketplaces en Programmatic ads? In dit half uur beslechten we de dilemma's en krijg je antwoorden op wanneer het voor jou tijd is om de volgende stap te zetten.
Accpac to QuickBooks Conversion Navigating the Transition with Online Account...PaulBryant58
This article provides a comprehensive guide on how to
effectively manage the convert Accpac to QuickBooks , with a particular focus on utilizing online accounting services to streamline the process.
Buy Verified PayPal Account | Buy Google 5 Star Reviewsusawebmarket
Buy Verified PayPal Account
Looking to buy verified PayPal accounts? Discover 7 expert tips for safely purchasing a verified PayPal account in 2024. Ensure security and reliability for your transactions.
PayPal Services Features-
🟢 Email Access
🟢 Bank Added
🟢 Card Verified
🟢 Full SSN Provided
🟢 Phone Number Access
🟢 Driving License Copy
🟢 Fasted Delivery
Client Satisfaction is Our First priority. Our services is very appropriate to buy. We assume that the first-rate way to purchase our offerings is to order on the website. If you have any worry in our cooperation usually You can order us on Skype or Telegram.
24/7 Hours Reply/Please Contact
usawebmarketEmail: support@usawebmarket.com
Skype: usawebmarket
Telegram: @usawebmarket
WhatsApp: +1(218) 203-5951
USA WEB MARKET is the Best Verified PayPal, Payoneer, Cash App, Skrill, Neteller, Stripe Account and SEO, SMM Service provider.100%Satisfection granted.100% replacement Granted.
What are the main advantages of using HR recruiter services.pdfHumanResourceDimensi1
HR recruiter services offer top talents to companies according to their specific needs. They handle all recruitment tasks from job posting to onboarding and help companies concentrate on their business growth. With their expertise and years of experience, they streamline the hiring process and save time and resources for the company.
India Orthopedic Devices Market: Unlocking Growth Secrets, Trends and Develop...Kumar Satyam
According to TechSci Research report, “India Orthopedic Devices Market -Industry Size, Share, Trends, Competition Forecast & Opportunities, 2030”, the India Orthopedic Devices Market stood at USD 1,280.54 Million in 2024 and is anticipated to grow with a CAGR of 7.84% in the forecast period, 2026-2030F. The India Orthopedic Devices Market is being driven by several factors. The most prominent ones include an increase in the elderly population, who are more prone to orthopedic conditions such as osteoporosis and arthritis. Moreover, the rise in sports injuries and road accidents are also contributing to the demand for orthopedic devices. Advances in technology and the introduction of innovative implants and prosthetics have further propelled the market growth. Additionally, government initiatives aimed at improving healthcare infrastructure and the increasing prevalence of lifestyle diseases have led to an upward trend in orthopedic surgeries, thereby fueling the market demand for these devices.
Falcon stands out as a top-tier P2P Invoice Discounting platform in India, bridging esteemed blue-chip companies and eager investors. Our goal is to transform the investment landscape in India by establishing a comprehensive destination for borrowers and investors with diverse profiles and needs, all while minimizing risk. What sets Falcon apart is the elimination of intermediaries such as commercial banks and depository institutions, allowing investors to enjoy higher yields.
Putting the SPARK into Virtual Training.pptxCynthia Clay
This 60-minute webinar, sponsored by Adobe, was delivered for the Training Mag Network. It explored the five elements of SPARK: Storytelling, Purpose, Action, Relationships, and Kudos. Knowing how to tell a well-structured story is key to building long-term memory. Stating a clear purpose that doesn't take away from the discovery learning process is critical. Ensuring that people move from theory to practical application is imperative. Creating strong social learning is the key to commitment and engagement. Validating and affirming participants' comments is the way to create a positive learning environment.
Taurus Zodiac Sign_ Personality Traits and Sign Dates.pptxmy Pandit
Explore the world of the Taurus zodiac sign. Learn about their stability, determination, and appreciation for beauty. Discover how Taureans' grounded nature and hardworking mindset define their unique personality.
Cracking the Workplace Discipline Code Main.pptxWorkforce Group
Cultivating and maintaining discipline within teams is a critical differentiator for successful organisations.
Forward-thinking leaders and business managers understand the impact that discipline has on organisational success. A disciplined workforce operates with clarity, focus, and a shared understanding of expectations, ultimately driving better results, optimising productivity, and facilitating seamless collaboration.
Although discipline is not a one-size-fits-all approach, it can help create a work environment that encourages personal growth and accountability rather than solely relying on punitive measures.
In this deck, you will learn the significance of workplace discipline for organisational success. You’ll also learn
• Four (4) workplace discipline methods you should consider
• The best and most practical approach to implementing workplace discipline.
• Three (3) key tips to maintain a disciplined workplace.
Affordable Stationery Printing Services in Jaipur | Navpack n PrintNavpack & Print
Looking for professional printing services in Jaipur? Navpack n Print offers high-quality and affordable stationery printing for all your business needs. Stand out with custom stationery designs and fast turnaround times. Contact us today for a quote!
3.0 Project 2_ Developing My Brand Identity Kit.pptxtanyjahb
A personal brand exploration presentation summarizes an individual's unique qualities and goals, covering strengths, values, passions, and target audience. It helps individuals understand what makes them stand out, their desired image, and how they aim to achieve it.
3.0 Project 2_ Developing My Brand Identity Kit.pptx
The CMO Survey Highlights and Insights February 2017
1.
2. About The CMO Survey
2
Mission
- To collect and disseminate the opinions of top marketers in order to predict the future of markets,
track marketing excellence, and improve the value of marketing in firms and society.
- The survey is an objective source of information about marketing and a non-commercial service
dedicated to the field of marketing.
Survey Operation
- Founded in August 2008, The CMO Survey is administered twice a year via an Internet survey. Many
questions repeat to observe trends over time.
- The February 2017 survey is the 18th administration of The CMO Survey.
Sponsoring Organizations
- Individual survey data and participant lists are held in confidence and not provided to survey
sponsors.
3. Survey methodology
3
Survey Sample
- 2813 top U.S. marketers at for-profit companies
- 388 responded for a 13.8% response rate
Survey Administration
- Email contact with four follow-up reminders
- Survey in field from January 16, 2017 - February 3, 2017
- 94.9% of respondents VP-level or above
Results Interpretation
- M = sample mean; SD = sample standard deviation
- B2B = Business-to-Business firms; B2C = Business-to-Consumer firms
Reports
- The Topline Report: All results reported at the aggregate level
- Results by Firm and Industry Characteristics: All results reported within sectors, size, and
Internet sales
4. Survey topics
4
Topic 1: Marketplace Dynamics………………………………........ 5-11
Topic 2: Firm Growth Strategies……………………………........... 12-21
Topic 3: Marketing Spending…………………………………......... 22-34
Topic 4: Financial and Marketing Performance…………………... 35-40
Topic 5: Social Media Marketing…………………………............... 41-50
Topic 6: Mobile Marketing…………………………………………... 51-54
Topic 7: Marketing Jobs…………………………………………….. 55-57
Topic 8: Marketing Organization…………………………............... 58-61
Topic 9: Marketing Leadership……………………………………... 62-67
Topic 10: Marketing Analytics………………………………………... 68-76
Topic 11: The CMO Survey Award for Marketing Excellence……. 77-79
5.
6. Marketplace Growth Spending Performance Social Media Mobile Jobs Organization Leadership Analytics
Marketer economic optimism increases
6
More
Optimistic
42.5%
Less
Optimistic
26.6%
No Change
30.9%
Figure 1.1. Are you more or less optimistic about the overall U.S. economy compared to last quarter?*
30.6%
34.9%
42.5%
0%
20%
40%
60%
80%
100%
Feb-16 Aug-16 Feb-17
More Optimistic
7. Marketplace Growth Spending Performance Social Media Mobile Jobs Organization Leadership Analytics
Marketer economic outlook varies by
industry
7
Top 3 Industry Sectors
Transportation
Education
Pharmaceuticals
Top 3 Industry Sectors
Consumer Services
Consumer Packaged Goods
Service/Consulting
Top 3 Industry Sectors
Healthcare
Banking/Finance/Insurance
Mining/Construction
More
Optimistic
42.5%
Less
Optimistic
26.6%
No Change
30.9%
Figure 1.2. Are you more or less optimistic about the overall U.S. economy compared to last quarter?*
8. Marketplace Growth Spending Performance Social Media Mobile Jobs Organization Leadership Analytics
All customer indictors positive: Customer
acquisition and sales volume lead forecasts
8
67%
63%
60%
44% 42%
31%
73%
67%
61%
53%
49%
35%
0%
10%
20%
30%
40%
50%
60%
70%
80%
Increased
acquisition of
new customers
Increased
customer
purchase volume
Increased purchase
of related products
& services
Increased
customer
retention
Increased entry of
new customers
into the market
Increased
customer price
per unit
August 2016 February 2017
Figure 1.3. Forecasted customer outcomes in next 12 months (% of respondents)
9. Marketplace Growth Spending Performance Social Media Mobile Jobs Organization Leadership Analytics
9
Quality, service, and trusting relationships remain
top customer priorities; trust largest yearly gain
29%
27%
17%
14%
13%
27%
22% 23%
17%
11%
25%
24% 24%
16%
12%
0%
5%
10%
15%
20%
25%
30%
35%
Superior
Product Quality
Excellent
Service
Trusting
Relationship
Low
Price
Superior
Innovation
February 2016 August 2016 February 2017
Figure 1.4. Customers’ top priority in next 12 months (% of respondents)
10. Marketplace Growth Spending Performance Social Media Mobile Jobs Organization Leadership Analytics
Fewer companies using channel partners to
go to market
10
70.7%
29.3%
55.5%
44.5%
0%
20%
40%
60%
80%
100%
Use channel partners Do not use channel partners
February 2013 February 2017
Figure 1.5. Percent of Companies Using Channel Partners to Reach Market (% of respondents)*
* Question asked irregularly. Full time series available shown.
11. Marketplace Growth Spending Performance Social Media Mobile Jobs Organization Leadership Analytics
All channel partner indicators forecasted
to improve
11
64%
44%
23% 22%
67%
50%
26%
31%
0%
20%
40%
60%
80%
Increased partner
purchase volume
Increased partner purchase
of related products
and services
Increased partner power
in relationship
Increased partner
price per unit
August 2013 February 2017
Figure 1.6. Forecasted channel partner outcomes in next 12 months (% of respondents)*
* Question asked irregularly. Full time series available shown.
12.
13. Marketplace Growth Spending Performance Social Media Mobile Jobs Organization Leadership Analytics
Investments in existing markets and
offerings dominate growth spending
13
Existing
Products/
Services
New
Products/
Services
Existing
Markets
Market
Penetration
Strategy
Product/Service
Development
Strategy
New
Markets
Market
Development
Strategy
Diversification
Strategy
* % of spending for each growth strategy
Growth
Strategy
Aug-16 Feb-2017
Market
Penetration
Strategy
52.1% 51.1%
Product/Service
Development
Strategy
23.6% 24.2%
Market
Development
Strategy
15.4% 15.0%
Diversification
Strategy
8.9% 9.7%
Table 2.1. Spending on Growth Strategies in
Past 12 Months*
Types of growth strategies
14. Marketplace Growth Spending Performance Social Media Mobile Jobs Organization Leadership Analytics
Internal activities drive overall
firm growth investments
14
Internal Partnerships Acquisitions Licensing
Overall 73.0% 11.4% 10.8% 4.9%
B2B Product 72.0% 11.4% 9.6% 7.0%
B2B Services 71.3% 15.3% 10.4% 3.0%
B2C Product 78.7% 7.7% 7.8% 5.8%
B2C Services 72.1% 6.7% 18.5% 2.7%
76.1%
10.1% 8.6%
5.2%
73.0%
11.4% 10.8%
4.9%
0%
20%
40%
60%
80%
100%
Growth from within your
firm
Growth from partnerships Growth from acquisitions Growth from licensing
February 2015 February 2017
Figure 2.2. How firms will grow in the next 12 months*
* Percentage of growth spending in each category. Question asked irregularly. Full time series available shown.
15. Marketplace Growth Spending Performance Social Media Mobile Jobs Organization Leadership Analytics
Company sales through Internet remain
modest at 11.8%
15
Figure 2.1. Percent of company sales through the Internet
Overall 11.8%
B2B Product 8.7%
B2B Services 13.7%
B2C Product 14.2%
B2C Services 12.5%
9.2% 8.9% 9.9% 11.3% 12.4% 10.3% 11.3% 10.3% 11.8%
0%
20%
40%
60%
80%
100%
Feb-12 Aug-13 Feb-14 Aug-14 Feb-15 Aug-15 Feb-16 Aug-16 Feb-17
Percent of sales through the Internet
16. Marketplace Growth Spending Performance Social Media Mobile Jobs Organization Leadership Analytics
Internet sales are a quarter or less of total
sales across all industries
16
Figure 2.1. Percent of company sales from Internet
6.7%
25.1%
6.5%
21.0%
9.3%
13.3%
9.4% 8.8%
0.3% 0.0%
6.9%
15.2%
13.2%
19.9%
0%
5%
10%
15%
20%
25%
30%
17. Marketplace Growth Spending Performance Social Media Mobile Jobs Organization Leadership Analytics
Company sales from domestic markets
continue to dominate
17
Figure 2.2. Percent of company sales from domestic markets
Overall 84.4%
B2B Product 80.9%
B2B Services 86.2%
B2C Product 81.1%
B2C Services 93.0%
77.6% 79.4%
77.5%
79.4%
85.4%
81.0%
83.0%
81.2%
84.4%
50%
60%
70%
80%
90%
100%
Feb-12 Aug-13 Feb-14 Aug-14 Feb-15 Aug-15 Feb-16 Aug-16 Feb-17
Percent of sales - domestic
18. Marketplace Growth Spending Performance Social Media Mobile Jobs Organization Leadership Analytics
Marketing budget spent on international
markets drops further
18
Overall 10.2%
B2B Product 8.7%
B2B Services 13.7%
B2C Product 14.2%
B2C Services 12.5%
Figure 2.3. Percent of marketing budget spent on international markets
21.9%
17.4%
10.2%
0%
5%
10%
15%
20%
25%
30%
February 2016 August 2016 February 2017
19. Marketplace Growth Spending Performance Social Media Mobile Jobs Organization Leadership Analytics
Western Europe leads sales for current
international markets
19
Figure 2.4. Which international market is currently your largest (in terms of sales)?
Western
Europe:
32.9%Canada:
14.5%
China:
13.2%
Japan:
5.3%
Mexico:
6.6%
Northern
Europe:
6.6%
Middle East:
5.3%
Brazil:
5.3%
Australia & New
Zealand: 3.9%
Central
America:
1.3%
Indonesia
& SE Asia:
1.3%
Eastern
Europe:
1.3% Korea:
1.3%
20. Marketplace Growth Spending Performance Social Media Mobile Jobs Organization Leadership Analytics
Location of international sales across
different economic sectors
20
Table 2.1. Which international market is currently your largest (in terms of sales)?
B2B
Product
B2B
Services
B2C
Product
B2C
Services
Western Europe 33.3% 42.3% 8.3% 40.0%
Canada 15.2% 11.5% 16.7% 20.0%
China 3.0% 23.1% 16.7% 20.0%
Japan 6.1% 3.8% 8.3% -
Mexico 6.1% - 25.0% -
Northern Europe 3.0% 7.7% 8.3% 20.0%
Middle East 6.1% - 16.7% -
Brazil 9.1% 3.8% - -
Australia/New Zealand 6.1% 3.8% - -
Central America 3.0% - - -
Indonesia and SE Asia 3.0% - - -
21. Marketplace Growth Spending Performance Social Media Mobile Jobs Organization Leadership Analytics
China and Western Europe are largest
future growth opportunities
21
Figure 2.5. Which international market that you are currently not in is your biggest opportunity for the future?
Western
Europe:
14.4%Canada:
8.7%
China: 16.3%
Japan: 1.9%
Mexico:
4.8%
Northern
Europe:
3.8%
Middle East:
5.8%
Brazil:
10.6%
Australia & New
Zealand: 5.8%
Central
America:
2.9%
Indonesia &
SE Asia: 5.8%
Eastern
Europe:
2.9%
South American
Countries*: 6.7%
South
Africa: 3.8%
India:
3.8%
Russia: 1%
Taiwan: 1%
*South American Countries excludes Brazil
22.
23. Marketplace Growth Spending Performance Social Media Mobile Jobs Organization Leadership Analytics
Marketing budgets expected to increase
23
Prior 12 months Next 12 months
Overall 7.3% 10.9%
B2B Product 6.6% 8.9%
B2B Services 9.1% 14.4%
B2C Product 5.2% 8.8%
B2C Services 7.0% 8.5%
Figure 3.1. Percent change in marketing budgets
6.0%
7.2%7.3%
10.9%
0%
2%
4%
6%
8%
10%
12%
Actual change in marketing budget
in prior 12 months
Expected change in marketing budget
in next 12 months
August 2016 February 2017
24. Marketplace Growth Spending Performance Social Media Mobile Jobs Organization Leadership Analytics
Forecasted marketing budgets expected to
increase 51.4%
24
Figure 3.2. Expected percent change in marketing budgets in next 12 months
0.5%
1.1%
5.9%
9.2%
6.7%
9.1%
8.1%
6.4% 6.1%
4.3%
6.7%
5.1%
8.7%
5.5%
6.9%
7.2%
10.9%
0%
2%
4%
6%
8%
10%
12%
Feb-09 Aug-09 Feb-10 Aug-10 Feb-11 Aug-11 Feb-12 Aug-12 Feb-13 Aug-13 Feb-14 Aug-14 Feb-15 Aug-15 Feb-16 Aug-16 Feb-17
Change in Marketing Spending
25. Marketplace Growth Spending Performance Social Media Mobile Jobs Organization Leadership Analytics
Nearly all industries expect growth in
marketing budgets
25
Figure 3.3. Expected percent change in marketing budgets in next 12 months
10.9% 10.4%
12.0%
8.7%
15.5%
20.4%
-14.0%
10.1%
6.6%
17.0%
5.0%
12.6% 12.2%
15.2%
7.5%
-15%
-10%
-5%
0%
5%
10%
15%
20%
25%
26. Marketplace Growth Spending Performance Social Media Mobile Jobs Organization Leadership Analytics
Digital spend dominates; positive growth expected for
traditional advertising spend for first time in 5 years
2626
*Refers to media advertising not using the Internet. Showing only data from February surveys.
Figure 3.4. Percent change in traditional advertising* vs. digital marketing spend in next 12 months
-0.8%
-2.7%
-0.1%
-1.1%
-3.2% 0.6%
12.8%
10.2%
8.2%
14.7%
13.2%
14.6%
-5%
0%
5%
10%
15%
20%
Feb-12 Feb-13 Feb-14 Feb-15 Feb-16 Feb-17
Traditional Advertising Spend Digital Marketing Spend
27. Digital marketing dominates overall
marketing spend across economic sectors
27
*Refers to media advertising not using the Internet.
Figure 3.5. Percent change in traditional advertising* vs. digital marketing spend in next 12 months
Marketplace Growth Spending Performance Social Media Mobile Jobs Organization Leadership Analytics
13.0%
16.0%
12.1%
17.4%
-1.0% 0.4%
3.1% 2.7%
-5%
0%
5%
10%
15%
20%
B2B Product B2B Services B2C Product B2C Services
Digital marketing spending Traditional advertising spending
28. Marketplace Growth Spending Performance Social Media Mobile Jobs Organization Leadership Analytics
Brand building expected to continue strong
spending gains
28
Figure 3.6. Percent change in CRM and brand spending expected in next 12 months
7.9%
7.5%
8.0%
7.1% 7.4%
7.9%
4.3%
5.6% 5.4%
5.0% 6.3%
9.7%
0%
2%
4%
6%
8%
10%
12%
Aug-14 Feb-15 Aug-15 Feb-16 Aug-16 Feb-17
Customer Relationship Management Brand Building
29. Marketplace Growth Spending Performance Social Media Mobile Jobs Organization Leadership Analytics
Marketing budgets represent 11.1% of
firm budgets
29
Figure 3.7. Marketing budget as percent of firm budget*
Overall 11.1%
B2B Product 10.9%
B2B Services 10.1%
B2C Product 16.9%
B2C Services 8.2%
8.1%
10.0% 10.4%
11.4%
10.6%
9.4%
10.9% 10.9%
10.1%
11.4%
12.1%
11.3% 11.1%
0%
4%
8%
12%
16%
20%
Feb-11 Aug-11 Feb-12 Aug-12 Feb-13 Aug-13 Feb-14 Aug-14 Feb-15 Aug-15 Feb-16 Aug-16 Feb-17
% Marketing Budget
*Question asked in Feb-11 for the first time.
30. Marketplace Growth Spending Performance Social Media Mobile Jobs Organization Leadership Analytics
Marketing spend is 8.1% of company
revenues
30
Figure 3.8. Marketing spending as percent of company revenues*
*Question asked in Feb-12 for the first time.
Overall 8.1%
B2B Product 7.88%
B2B Services 6.92%
B2C Product 12.4%
B2C Services 7.75%
8.5%
11.0%
7.9% 7.8%
9.3%
8.3% 8.3%
6.6%
8.4%
7.5% 8.1%
0%
3%
6%
9%
12%
15%
Feb-12 Aug-12 Feb-13 Aug-13 Feb-14 Aug-14 Feb-15 Aug-15 Feb-16 Aug-16 Feb-17
% Marketing Spend
31. Marketplace Growth Spending Performance Social Media Mobile Jobs Organization Leadership Analytics
Marketing spend varies across industries
31
Figure 3.9. Marketing spending as percent of company revenues*
4.3%
11.0%
10.0%
13.9%
4.6%
0.5%
10.2%
2.7%
0.6%
6.2%
11.6%
12.2%
11.2%
0%
2%
4%
6%
8%
10%
12%
14%
16%
*Pharmaceuticals are not displayed due to too few respondents.
32. Marketplace Growth Spending Performance Social Media Mobile Jobs Organization Leadership Analytics
Figure 3.10. Percent change in marketing knowledge investments expected in next 12 months
Firms emphasize knowledge investments;
capability investments to increase 113%
32
*Developing knowledge about how to do marketing refers to the development of new marketing capabilities; marketing training involves transferring
existing marketing knowledge to employees.
1.7% 1.8%
2.7%
6.2%
4.9%
5.3%
4.6%
3.1%
6.6%
3.7% 2.4%
2.6%
0%
2%
4%
6%
8%
10%
February 2013 February 2014 February 2017
Marketing consulting
services
Marketing research and
intelligence
Developing knowledge
about how to do marketing
Marketing training
33. Marketplace Growth Spending Performance Social Media Mobile Jobs Organization Leadership Analytics
Firms to increase their investments on
knowledge building
33
Overall Mean
(SD)
B2B
Product
B2B
Services
B2C
Product
B2C
Services
Marketing consulting
services
2.7% 2.5% 4.4% -1.2% 2.5%
Marketing research and
intelligence
5.3% 5.0% 6.0% 3.9% 5.6%
Developing knowledge about
how to do marketing
6.6% 4.9% 8.5% 7.0% 5.5%
Marketing training 2.6% 2.4% 2.5% 3.2% 2.9%
*Developing knowledge about how to do marketing refers to the development of new marketing capabilities; marketing training involves
transferring existing marketing knowledge to employees.
Table 3.1. Percent change in marketing knowledge investments expected in next 12 months
34. Marketplace Growth Spending Performance Social Media Mobile Jobs Organization Leadership Analytics
Percentage of marketing budget devoted to training and development
(Overall mean = 3.8%, SD = 4.9, 95% Percent Confidence Interval Around the Mean: 3.2%-4.4%)
Overall budget spend averages 3.8% for
training and development
34
Table 3.2a. Industry sector differences
Sector* Mean
Banking/Finance/Insurance 3.4
Communications/Media 4.9
Consumer Packaged Goods 3.1
Consumer Services 1.8
Education 6.1
Energy 5.0
Healthcare 4.1
Manufacturing 4.4
Mining/Construction 0.7
Retail/Wholesale 2.5
Service/Consulting 3.2
Tech/Software/Biotech 4.4
Transportation 4.6
Sector Mean
B2B Product 4.3
B2B Services 3.8
B2C Product 3.6
B2C Services 2.7
Table 3.2b. Firm sector differences
Table 3.2c. Firm Internet sales differences
Firm sales Mean
0% of sales 3.0
1-10% of sales 4.1
>10% of sales 4.4
*Pharmaceuticals are not displayed due to too few respondents.
35.
36. Marketplace Growth Spending Performance Social Media Mobile Jobs Organization Leadership Analytics
Performance metrics increased across all
economic sectors in past year
36
Overall Mean
(SD)
B2B
Product
B2B
Services
B2C
Product
B2C
Services
Sales 3.8% (5.8%) 3.9% (6.5%) 3.9% (5.4%) 4.7% (4.6%) 1.7% (6.3%)
Profits 3.1% (5.3%) 3.1% (5.3%) 2.7% (4.7%) 4.1% (5.4%) 2.8% (7.0%)
Marketing ROI 3.1% (4.5%) 3.2% (4.1%) 3.1% (4.6%) 3.2% (4.2%) 3.0% (5.7%)
Customer acquisition 3.1% (4.6%) 4.1% (4.0%) 3.0% (4.8%) 2.5% (4.4%) 1.6% (5.6%)
Customer retention 1.5% (4.8%) 1.1% (4.7%) 2.0% (5.0%) 2.0% (4.2%) 0.3% (5.2%)
Brand value 3.8% (4.2%) 4.1% (4.4%) 4.2% (4.4%) 3.9% (3.9%) 1.9% (3.7%)
Table 4.1. Percent change in financial and marketing performance in prior 12 months: Mean (S.D.) reported
37. Marketplace Growth Spending Performance Social Media Mobile Jobs Organization Leadership Analytics
Revenues, profits, and market ROI all
increased over prior 12 months
37
Figure 4.1. Percent change in performance on financial metrics in prior 12 months
3.8% 3.7%
3.3%
3.8%
3.1%
2.9%
2.4%
3.1%
2.8% 2.8%
2.4%
3.1%
0%
1%
2%
3%
4%
5%
Aug-15 Feb-16 Aug-16 Feb-17
Sales revenues Profits Marketing ROI
38. Marketplace Growth Spending Performance Social Media Mobile Jobs Organization Leadership Analytics
Customer acquisition and brand value
performance improve
38
Figure 4.2. Percent change in performance on customer and brand metrics in prior 12 months
2.9%
3.5%
2.4%
3.1%
1.7%
1.5%
1.8%
1.5%
2.8%
3.3%
3.2%
3.8%
0%
1%
2%
3%
4%
5%
Aug-15 Feb-16 Aug-16 Feb-17
Customer acquisition Customer retention Brand value
39. Marketplace Growth Spending Performance Social Media Mobile Jobs Organization Leadership Analytics
Marketing excellence ratings remain flat
39
* Question asked in Aug-13 for the first time.
Figure 4.3. How would you rate your company’s marketing excellence?*
(7-point scale where 1=Very weak, 7=Leader)
4.5 4.5
4.7
4.5 4.6 4.5 4.5 4.4 4.5
1
2
3
4
5
6
7
Aug-13 Feb-13 Feb-14 Aug-14 Feb-15 Aug-15 Feb-16 Aug-16 Feb-17
Excellence rating
40. Marketplace Growth Spending Performance Social Media Mobile Jobs Organization Leadership Analytics
B2C Product companies more likely to be
marketing leaders
40
Figure 4.4. How would you rate your company’s marketing excellence?
(7-point scale where 1=Very weak and 7=Leader)
8.1% 10.1%
5.6% 9.4% 7.7%
41.0%
47.8%
40.9% 34.4%
30.7%
27.8%
17.4%
35.2%
28.1% 34.6%
23.3% 24.6%
18.3%
28.1% 26.9%
0%
10%
20%
30%
40%
50%
60%
70%
80%
90%
100%
Overall B2B Product B2B Services B2C Product B2C Services
A Leader/ Excellent=6-7
Strong=5
Fair/Good=3-4
Very Weak/Weak=1-2
41.
42. Marketplace Growth Spending Performance Social Media Mobile Jobs Organization Leadership Analytics
Marketers to expand social media spend by
90% in next 5 years
42
Figure 5.1. Social media spending as percent of marketing budgets
10.5%
12.9%
18.5%
0%
5%
10%
15%
20%
25%
Current Levels Over Next 12 Months In Next 5 Years
% of Marketing Budget
43. Marketplace Growth Spending Performance Social Media Mobile Jobs Organization Leadership Analytics
B2C Product leads social media spend; all
sectors to grow by ~20% in next year
43
Overall
B2B
Product
B2B
Services
B2C
Product
B2C
Services
Current social media spending 10.5% 9.4% 10.7% 14.6% 7.9%
Social media spending in the
next 12 months
12.9% 11.4% 13.2% 17.1% 11.0%
Social media spending in the
next 5 years
18.6% 17.0% 17.9% 25.5% 16.3%
Table 5.1. Changes in social media spending across sectors
44. Marketplace Growth Spending Performance Social Media Mobile Jobs Organization Leadership Analytics
Social media spend fails to grow at prior
rate and fails to meet 5-year projections
44
Figure 5.2. Actual versus predicted social media spending as percent of marketing budget
*Predicted level is based on responses to 5-year predicted social media spend five years earlier (e.g., Aug-14 based on response from Aug-09).
13.7%
17.7% 17.7% 18.1%
17.5%
19.5%
3.5%
5.6% 5.9% 5.6%
7.1% 7.4% 7.6% 8.4%
6.6%
7.4%
9.4% 9.9%
10.6% 10.6%
11.7%
10.5%
0%
5%
10%
15%
20%
Aug-09 Feb-10 Aug-10 Feb-11 Aug-11 Feb-12 Aug-12 Feb-13 Aug-13 Feb-14 Aug-14 Feb-15 Aug-15 Feb-16 Aug-2016 Feb-17
Predicted Level* Current Level
45. Marketplace Growth Spending Performance Social Media Mobile Jobs Organization Leadership Analytics
Integration of social media and marketing
strategy shows minimal progress
45
Figure 5.3. How effectively is social media linked to your firm’s marketing strategy?
(1=Not integrated, 7=Very integrated)
3.8 3.8 3.8 3.9 3.8 3.9 3.9
4.2 4.2
3.9
4.1
1
2
3
4
5
6
7
Feb-12 Aug-12 Feb-13 Aug-13 Feb-14 Aug-14 Feb-15 Aug-15 Feb-16 Aug-16 Feb-17
Mean Integration Level
46. Marketplace Growth Spending Performance Social Media Mobile Jobs Organization Leadership Analytics
Integration of customer information across
channels shows no improvement
46
Figure 5.4. How effectively does your company integrate customer information across purchasing,
communication, and social media channels? (1=Not at all effectively, 7=Very effectively)
*Question asked in Feb-11 for the first time.
3.8 3.8 3.8 3.8 3.9 3.8 3.9
3.7 3.6
3.4
3.2
3.4
1
2
3
4
5
6
7
Feb-11 Feb-12 Aug-12 Feb-13 Aug-13 Feb-14 Aug-14 Feb-15 Aug-15 Feb-16 Aug-16 Feb-17
Mean Integration Level
47. Marketplace Growth Spending Performance Social Media Mobile Jobs Organization Leadership Analytics
Use of outside social media agencies
experiences a significant drop
47
Figure 5.5. Percent of company’s social media activities performed by outside agencies
17.4%
18.9%
21.7%
20.0%
20.7%
16.6%
0%
5%
10%
15%
20%
25%
Feb-14 Feb-15 Aug-15 Feb-16 Aug-16 Feb-17
Percentage Outside Agencies
48. Marketplace Growth Spending Performance Social Media Mobile Jobs Organization Leadership Analytics
The impact of social media remains
difficult to prove
48
Figure 5.6.. Which best describes how you show the impact of
social media on your business?
Haven’t
shown impact
Qualitative
sense
Proven
quantitatively
Overall 43.3% 38.2% 18.4%
B2B Product 47.3% 36.5% 16.2%
B2B Services 44.4% 43.2% 12.3%
B2C Product 39.4% 33.3% 27.3%
B2C Services 34.5% 34.5% 31.0%
45.0% 41.5% 41.5% 47.9% 44.1% 43.3%
40.4% 43.5% 43.5%
40.6%
35.7% 38.2%
14.6% 15.0% 15.0% 11.5%
20.3% 18.4%
0%
20%
40%
60%
80%
100%
Aug-14 Feb-15 Aug-15 Feb-16 Aug-16 Feb-17
Have proven the impact quantitatively
Have a good qualitative sense of the imact, but not a quantitative impact
Haven't been able to show the impact yet
49. Marketplace Growth Spending Performance Social Media Mobile Jobs Organization Leadership Analytics
Social media perceived to contribute little
to company performance
49
Figure 5.7. To what degree does the use of social media contribute to
your company's performance? (1=Not at all, 7=Very highly)
Feb-16 Aug-16 Feb-17
Overall 3.2 3.1 3.2
B2B Product 2.5 2.7 2.9
B2B Services 3.4 3.1 3.1
B2C Product 3.2 3.8 3.9
B2C Services 4.0 3.4 3.2
3.2 3.1 3.2
1
2
3
4
5
6
7
Feb-16 Aug-16 Feb-17
Contribution to company performance
* Question asked in Feb-16 for the first time.
50. Marketplace Growth Spending Performance Social Media Mobile Jobs Organization Leadership Analytics
Top reason firms use social media:
Brand building and brand awareness
50
% Using
B2B
Product
B2B
Services
B2C
Product
B2C
Services
Brand awareness and brand building 46.1% 45.3% 48.9% 45.6% 43.9%
Acquiring new customers 31.4% 27.0% 30.4% 36.8% 40.4%
Introducing new products and services 28.9% 29.9% 27.4% 35.1% 24.6%
Retaining current customer 28.4% 26.3% 24.4% 33.3% 38.6%
Brand promotions (e.g., contests, coupons) 28.4% 27.7% 27.4% 38.6% 22.8%
Improving employee engagement 20.1% 17.5% 23.0% 15.8% 24.6%
Marketing research 14.7% 12.4% 14.8% 17.5% 17.5%
Identifying new customer groups you currently don't target 13.7% 14.6% 14.1% 15.8% 8.8%
Identifying new product and service opportunities 11.1% 8.8% 14.8% 7.0% 12.3%
Improving current products or services 7.2% 6.6% 8.9% 5.3% 7.0%
Table 5.2. How does your firm use social media? (Check all that apply)
51.
52. Marketplace Growth Spending Performance Social Media Mobile Jobs Organization Leadership Analytics
Marketing spend on mobile expected to
increase 127% in three years
52
Figure 6.1. Percent of marketing budget spend on mobile Now 3 years
Overall 5.1% 11.6%
B2B Product 3.6% 9.1%
B2B Services 4.9% 10.1%
B2C Product 7.1% 17.2%
B2C Services 7.7% 15.6%
5.1%
11.6%
0%
5%
10%
15%
20%
Current Levels In Next 3 Years
53. Marketplace Growth Spending Performance Social Media Mobile Jobs Organization Leadership Analytics
Figure 6.2. Rate the performance of your company’s mobile marketing activities
(7-point scale where 1=Poor, 7=Excellent)
53
3.1
3.8
3.2
3.6
3.3
3.03.0
3.5
3.1
3.4
3.0
2.8
1
2
3
4
5
6
7
Customer
acquisition
Customer
engagement
Customer
retention
Delivering your
brand message
Sales Profits
August 2016 February 2017
Mobile marketing performance decreases
on key metrics
54. Marketplace Growth Spending Performance Social Media Mobile Jobs Organization Leadership Analytics
Mobile shows slight gain in contribution to
company performance; still too low
54
Figure 6.3. To what degree does the use of mobile marketing contribute
to your company's performance? (1=Not at all, 7=Very highly)
Feb-16 Aug-16 Feb-17
B2B Product 2.0 2.3 2.2
B2B Services 2.4 2.3 2.6
B2C Product 3.0 3.1 3.4
B2C Services 2.8 3.2 3.1
2.4 2.5
2.7
1
2
3
4
5
6
7
Feb-16 Aug-16 Feb-17
Overall Company Performance
55.
56. Marketplace Growth Spending Performance Social Media Mobile Jobs Organization Leadership Analytics
Positive but declining forecast in marketing
hires planned in next year
56
Figure 7.1. Percentage change in marketing hires planned in next 12 months
Overall 3.7%
B2B Product 4.2%
B2B Services 4.3%
B2C Product 3.7%
B2C Services 0.8%
5.2%
6.5%
5.4% 5.5%
4.7%
3.8% 3.5%
6.6%
5.1% 5.4%
3.7%
0%
3%
6%
9%
12%
15%
Feb-12 Aug-12 Feb-13 Aug-13 Feb-14 Aug-14 Feb-15 Aug-15 Feb-16 Aug-16 Feb-17
Percentage Change in Marketing Hires in Next 12 Months
57. Marketplace Growth Spending Performance Social Media Mobile Jobs Organization Leadership Analytics
Marketing outsourcing expected to increase
4.1% in next year
60
Percentage change in outsourcing of marketing in next 12 months (Overall mean = 4.1%, SD = 11.5)
Table 7.1a. Industry sector differences
Sector Mean
Banking/Finance/Insurance 7.4%
Communications/Media 5.3%
Consumer Packaged Goods 0.5%
Consumer Services 4.0%
Education 10.0%
Healthcare 5.5%
Manufacturing 0.9%
Mining/Construction 12.5%
Retail/Wholesale 7.1%
Service/Consulting 0.1%
Tech Software Biotech 2.6%
Transportation 5.0%
Sector Mean
B2B Product 3.6%
B2B Services 6.0%
B2C Product 2.3%
B2C Services 2.6%
Table 7.1b. Firm sector differences
Table 7.1c. Firm Internet sales differences
Firm sales Mean
0% of sales 3.4%
1-10% of sales 5.8%
>10% of sales 2.7%
Energy and Pharmaceuticals are not displayed due to too few respondents
58. Marketplace Growth Spending Performance Social Media Mobile Jobs Organization Leadership Analytics
Marketing outsourcing expected to
increase 4.1% in next year
Percentage change in outsourcing of marketing in next 12 months (Overall mean = 4.1%, SD = 11.5)
Table 7.1a. Industry sector differences
Sector Mean
Banking/Finance/Insurance 7.4%
Communications/Media 5.3%
Consumer Packaged Goods 0.5%
Consumer Services 4.0%
Education 10.0%
Healthcare 5.5%
Manufacturing 0.9%
Mining/Construction 12.5%
Retail/Wholesale 7.1%
Service/Consulting 0.1%
Tech Software Biotech 2.6%
Transportation 5.0%
Sector Mean
B2B Product 3.6%
B2B Services 6.0%
B2C Product 2.3%
B2C Services 2.6%
Table 7.1b. Firm sector differences
Table 7.1c. Firm Internet sales differences
Firm sales Mean
0% of sales 3.4%
1-10% of sales 5.8%
>10% of sales 2.7%
60
Energy and Pharmaceuticals are not displayed due to too few respondents
59. Marketplace Growth Spending Performance Social Media Mobile Jobs Organization Leadership Analytics
Marketing and sales are equal partners in
most companies
59
Figure 8.1. The marketing-sales relationship (% of respondents)
72.2%
10.2%
7.8% 8.3%
1.5%
0%
10%
20%
30%
40%
50%
60%
70%
80%
Sales and marketing work
together on an equal level
We don't have a sales
function
Sales is in charge of
marketing
Sales is within the marketing
function
We have a sales function,
but not a marketing function
60. Marketplace Growth Spending Performance Social Media Mobile Jobs Organization Leadership Analytics
Product / service structure remains
dominant
60
Figure 8.2. Organizational structure in companies
% customer
groups
Overall 29.9%
B2B Product 25.4%
B2B Services 34.2%
B2C Product 26.5%
B2C Services 34.6%
*Question not asked in Aug-14.
26.5% 28.6% 26.7%
30.2% 29.4% 31.9% 30.7% 29.9%
73.5% 71.4% 73.3%
69.8% 70.6% 68.1% 69.3% 70.1%
0%
20%
40%
60%
80%
100%
Feb-13 Aug-13 Feb-14* Feb-15 Aug-15 Feb-16 Aug-16 Feb-17
Customer Groups Product/Service Groups
61. Marketplace Growth Spending Performance Social Media Mobile Jobs Organization Leadership Analytics
External information sharing increases
in companies
61
Figure 8.3. Company market focus approach to strategy (1 = “Not at all” and 7 = “All the time”)
Information about customers and competitors is …
4.9
4.3 4.4 4.6 4.7 4.7
5.1
4.7 4.6 4.6 4.7 4.7
1
2
3
4
5
6
7
Collected on
a regular basis
Shared vertically across
different levels of the
firm and
business units
Shared horizontally
across different
functions and
business units
Shapes the design
of firm strategies
Influences the
implementation of
firm strategies
Impacts the
evaluation of
firm strategies
February 2015 February 2017
* Question asked irregularly. Showing most recent data.
62.
63. Marketplace Growth Spending Performance Social Media Mobile Jobs Organization Leadership Analytics
Marketing leadership losses outweigh gains
63
Table 9.1. Percentage of
companies in
which marketing
leads activity
Activity Aug-15 Feb-16 Aug-16 Feb-17**
Brand 82.1% 87.5% 89.4% 86.5%
Social media 79.5% 83.9% 75.7% 76.8%
Advertising 82.7% 82.1% 79.2% 76.3%
Public relations 64.1% 64.9% 65.5% 70.0%
Promotion 76.3% 76.2% 73.3% 69.1%
Positioning 80.1% 75.6% 67.8% 67.6%
Marketing research 70.5% 70.2% 67.1% 59.9%
Lead generation 55.8% 62.5% 60.8% 58.5%
Marketing analytics 75.0% 79.2% 69.0% 57.5%
Competitive intelligence 55.1% 56.5% 54.5% 42.0%
CRM 39.1% 37.5% 42.0% 41.1%
Market entry strategies 55.8% 46.4% 43.5% 35.3%
Revenue growth* - - 38.4% 34.3%
New products 37.8% 36.3% 40.0% 32.4%
Pricing 30.8% 32.1% 33.7% 26.6%
Innovation 23.1% 28.6% 29.8% 26.6%
e-commerce* - - 35.7% 23.7%
Market selection 30.1% 29.8% 32.9% 23.7%
Sales 32.1% 25.0% 24.7% 21.3%
Customer service 19.9% 17.3% 18.0% 12.6%
Distribution 12.2% 9.5% 10.2% 5.8%
Stock market performance 3.8% 1.8% 2.7% 0.5%
*Revenue growth and e-commerce were added in Aug-16.
**Red reflects a decrease and Green reflects an increase
of more than 2 percent between Aug-16 and Feb 17.
64. Marketplace Growth Spending Performance Social Media Mobile Jobs Organization Leadership Analytics
Marketing leader retention (6.0 years) while
total tenure at all-time high (11.4 years)
64
Figure 9.1. Marketing leader retention
8.0
9.0 8.8 9.2
10.0 10.0
8.0
9.8
11.4
4.3 4.6 4.3 4.1
5.1 5.3
4.5
6.6
6.0
0
3
6
9
12
15
Aug-09 Aug-10 Aug-11 Aug-12 Aug-13 Aug-14 Aug-15 Aug-16 Feb-17
Years top marketer in any role in the firm Years top marketer in current role in the firm
65. Marketplace Growth Spending Performance Social Media Mobile Jobs Organization Leadership Analytics
Direct reports decreases while indirect
reports show significant growth
65
Figure 9.2. Number of people reporting to top marketers*
*Aug-15 are revised from Highlights and Insights Feb-16 where the median levels were reported instead of mean levels.
8.6
6.9
5.5
6.8 6.5
5.0
24.6
16.1 16.2
18.6
15.7
24.6
0
5
10
15
20
25
30
Aug-12 Aug-13 Aug-14 Aug-15 Aug-16 Feb-17
Number of direct reports Number of indirect reports
66. Marketplace Growth Spending Performance Social Media Mobile Jobs Organization Leadership Analytics
Marketers experience less pressure to
prove the value of marketing over time
66
*Question asked irregularly. A complete time series of available data is shown.
Figure 9.3. Percent of CMOs reporting pressure from CEO or Board to prove the value of marketing*
66.4%
62.0% 61.0%
56.9%
0%
10%
20%
30%
40%
50%
60%
70%
80%
90%
100%
Aug-13 Aug-14 Feb-15 Feb-17
67. Leading practices from marketing leaders
See full interviews at https://cmosurvey.org/cmo-insights/
67
Senior Vice President and Chief Marketing Officer Beth Comstock discusses how GE approaches
marketing: “You have to create a platform that invites innovative ideas.” This platform involves four
capabilities that have produced an array of new products, services, customers, and business models.
Chief Marketing Officer Kim Feil discusses how she built a marketing function. From insights to
accountability, she describes the organization, processes, metrics, and talent management strategies
important to this effort.
Executive Vice President and Chief Marketing Officer Geert van Kuyck shares ideas on building an
essential skill set for CMOs and the importance of defining the CMO’s mission. He discusses the use
of the Net Promoter Score and other metrics to evaluate business results at Philips, touching on
Philips’ engagement with LinkedIn and social media metrics.
Executive Vice President and Chief Marketing Officer Stephen Quinn describes how Walmart rebuilt
its customer focus. Key steps involved harnessing internal support, generating market insight, using
customer-focused metrics, living the brand internally, and building marketing talent.
Global Marketing Officer Marc Pritchard shares views on how marketing contributes to P&G’s
performance. He talks about how P&G learns about customers and how it is relentless in its attention
to building loyal customers and strong brands in the store, on the web, and around the world.
68.
69. Marketplace Growth Spending Performance Social Media Mobile Jobs Organization Leadership Analytics
Spending on marketing analytics forecasted
to increase 376% in three years
69
Figure 10.1. Percent of marketing budget spent on marketing analytics
4.6%
21.9%
0%
5%
10%
15%
20%
25%
Current Levels In Next 3 Years
+376% Growth
70. Marketplace Growth Spending Performance Social Media Mobile Jobs Organization Leadership Analytics
Spending on marketing analytics by firm
and industry characteristics
70
Current
In Next
3 years
<$25M 4.7 17.8
$26-99M 4.1 15.0
$100-499M 4.8 23.3
$500-999M 3.6 18.1
$1-9.9B 5.2 32.4
$10+B 4.1 29.4
Table 10.1c. Firm size differences
Table 10.1b. Firm Internet sales differences
Current
In Next
3 years
0% 4.3 25.7
1-10% 3.9 20.9
>10% 5.9 15.9
Table 10.1a. Firm sector differences
Current
In Next
3 years
B2B Product 4.7 20.9
B2B Services 4.9 21.2
B2C Product 3.5 26.9
B2C Services 4.3 20.6
71. Marketplace Growth Spending Performance Social Media Mobile Jobs Organization Leadership Analytics
No improvement in use of marketing
analytics: B2C companies biggest users
71
Figure 10.2. Use of marketing analytics in decision making*
*This question was asked in Feb-12 for the first time.
Overall 31.6%
B2B Product 31.0%
B2B Services 29.0%
B2C Product 33.2%
B2C Services 38.5%
37.0% 35.0%
30.4% 29.0%
32.5% 32.3%
29.0% 31.0%
35.3% 34.7%
31.6%
0%
20%
40%
60%
80%
100%
Feb-12 Aug-12 Feb-13 Aug-13 Feb-14 Aug-14 Feb-15 Aug-15 Feb-16 Aug-16 Feb-17
Percent of projects using marketing analytics before a decision is made
72. Marketplace Growth Spending Performance Social Media Mobile Jobs Organization Leadership Analytics
Contribution of marketing analytics
remains low
72
Figure 10.3. To what degree does the use of marketing analytics contribute to
your company's performance? (1 = Not at all, 7 = Very highly)
*This question was asked in Aug-12 for the first time.
Overall 3.8 (SD=1.8)
B2B Product 3.8 (SD=1.8)
B2B Services 3.4 (SD=1.8)
B2C Product 4.6 (SD=1.6)
B2C Services 4.3 (SD=1.9)
3.9
3.7
3.5
3.7 3.7
3.2
3.7 3.8 3.8 3.7
1
2
3
4
5
6
7
Aug-12 Feb-13 Aug-13 Feb-14 Aug-14 Feb-15 Aug-15 Feb-16 Aug-16 Feb-17
Mean Contribution Level
73. Marketplace Growth Spending Performance Social Media Mobile Jobs Organization Leadership Analytics
Process and people failures largest
disruptors of marketing analytics use
73
32.2%
28.6%
16.5%
14.9%
9.5%
7.5%
0% 10% 20% 30% 40% 50%
Lack of process/tools to measure success through analytics
Lack of people who can link to marketing practice
Not highly relevant to our decisions
Does not offer sufficient insight
Overly complex
Does not arrive when needed
Figure 10.4. What factors prevent your company from using more marketing analytics?
74. Marketplace Growth Spending Performance Social Media Mobile Jobs Organization Leadership Analytics
Most firms do not evaluate quality of
marketing analytics
74
30.4%
69.6%
34.9%
65.1%
0%
20%
40%
60%
80%
100%
Evaluate Do not evaluate
February 2015 February 2017
Figure 10.5. Does your company formally evaluate the quality of marketing analytics?
75. Marketplace Growth Spending Performance Social Media Mobile Jobs Organization Leadership Analytics
Marketing analytics contributions by sector
and firm differences
75
Table 10.2. To what degree does the use of marketing analytics contribute to your company's
performance? (1=Not at all, 7=Very highly)
Table 10.2a. Industry sector differences
Sector* Mean
Banking/Finance/Insurance 3.1
Communications/Media 4.2
Consumer Packaged Goods 4.4
Consumer Services 5.9
Education 5.4
Healthcare 3.9
Manufacturing 3.6
Mining/Construction 2.3
Retail/Wholesale 3.3
Service/Consulting 3.1
Tech Software Biotech 3.9
Transportation 3.5
Sector Mean
B2B Product 3.7
B2B Services 3.6
B2C Product 4.0
B2C Services 4.1
Table 10.2b. Firm sector differences
Table 10.2c. Firm Internet sales differences
Firm sales Mean
0% of sales 3.3
1-10% of sales 3.8
>10% of sales 4.2
*Energy and Pharmaceuticals are not displayed due to too few respondents.
76. Marketplace Growth Spending Performance Social Media Mobile Jobs Organization Leadership Analytics
Most firms lack quantitative metrics to
demonstrate marketing spending impact
76
Figure 10.6. How companies demonstrate the impact of marketing spending
37.1%
42.4%
20.5%
34.5%
47.2%
18.3%
0%
10%
20%
30%
40%
50%
60%
Proved the impact quantitatively Good qualitative sense of the impact,
not quantitative
Haven't been able to show
the impact yet
Short-Term Impact Long-Term Impact
77.
78. The 2017 CMO Survey Award for
Marketing Excellence – Overall Winner
78
Participants were asked to nominate a company in response to the question:
Which company across all industries sets the standard for excellence in marketing?
Apple Inc. Apple has won this award for ten
consecutive years. Christine Moorman’s
review of this accomplishment in 2012
still largely holds:
http://www.forbes.com/sites/christinemo
orman/2012/07/10/why-apple-is-a-great-
marketer/#7897d34b6cb0
79. Participants were asked to nominate a company in response to the question:
Which company in your industry sets the standard for excellence in marketing?
The 2017 CMO Survey Award for Marketing
Excellence – Industry Winners
79
(Retail) (Transportation) (Consumer Packaged Goods) (Consumer Services)
(Consumer Goods)(Consulting/Services)(Communications/Media)(Manufacturing)
80. Preview
80
Next survey: July 2017
Participate: Sign up here
Media: Press release and coverage
Feedback: Send comments to moorman@duke.edu