Download to read offline
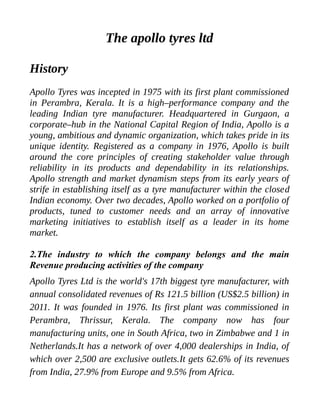
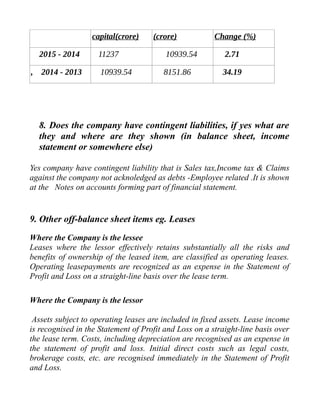
![YEAR INVENTORY (crore) TOTAL CURRENT
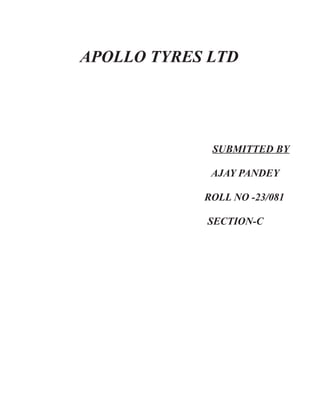
ASSETS (crore)
Inventory as %age of
current assets
2013 20310.75 36861.65 55.09
2014 20664.24 41718.03 49.53
2015 17782.06 37084.08 47.95
•The absolute and percentage change in inventory value from
1st
year to 2nd
and from 2nd
year to 3rd
year in absolute
Absolute change
[current year inventory – previous year inventory]
Year Current year
inventory
(crore)
Previous year
inventory
(crore)
Absolute change
(crore)
2015 - 2014 17782.06 20664.24 -2882.18
2014 - 2013 20664.24 20310.75 353.49
Percentage change
[(absolute change / previous year inventory)*100]
Year Absolute
Change (crore)
Previous year
inventory
(crore)
Percentage
change (%)
2015 - 2014 -2882.18 20664.24 -13.94
2014 - 2013 353.49 20310.75 1.74](https://image.slidesharecdn.com/18de9d1f-c297-4458-8e40-2b4674892167-161014172548/85/The-apollo-tyres-ltd-4-320.jpg)
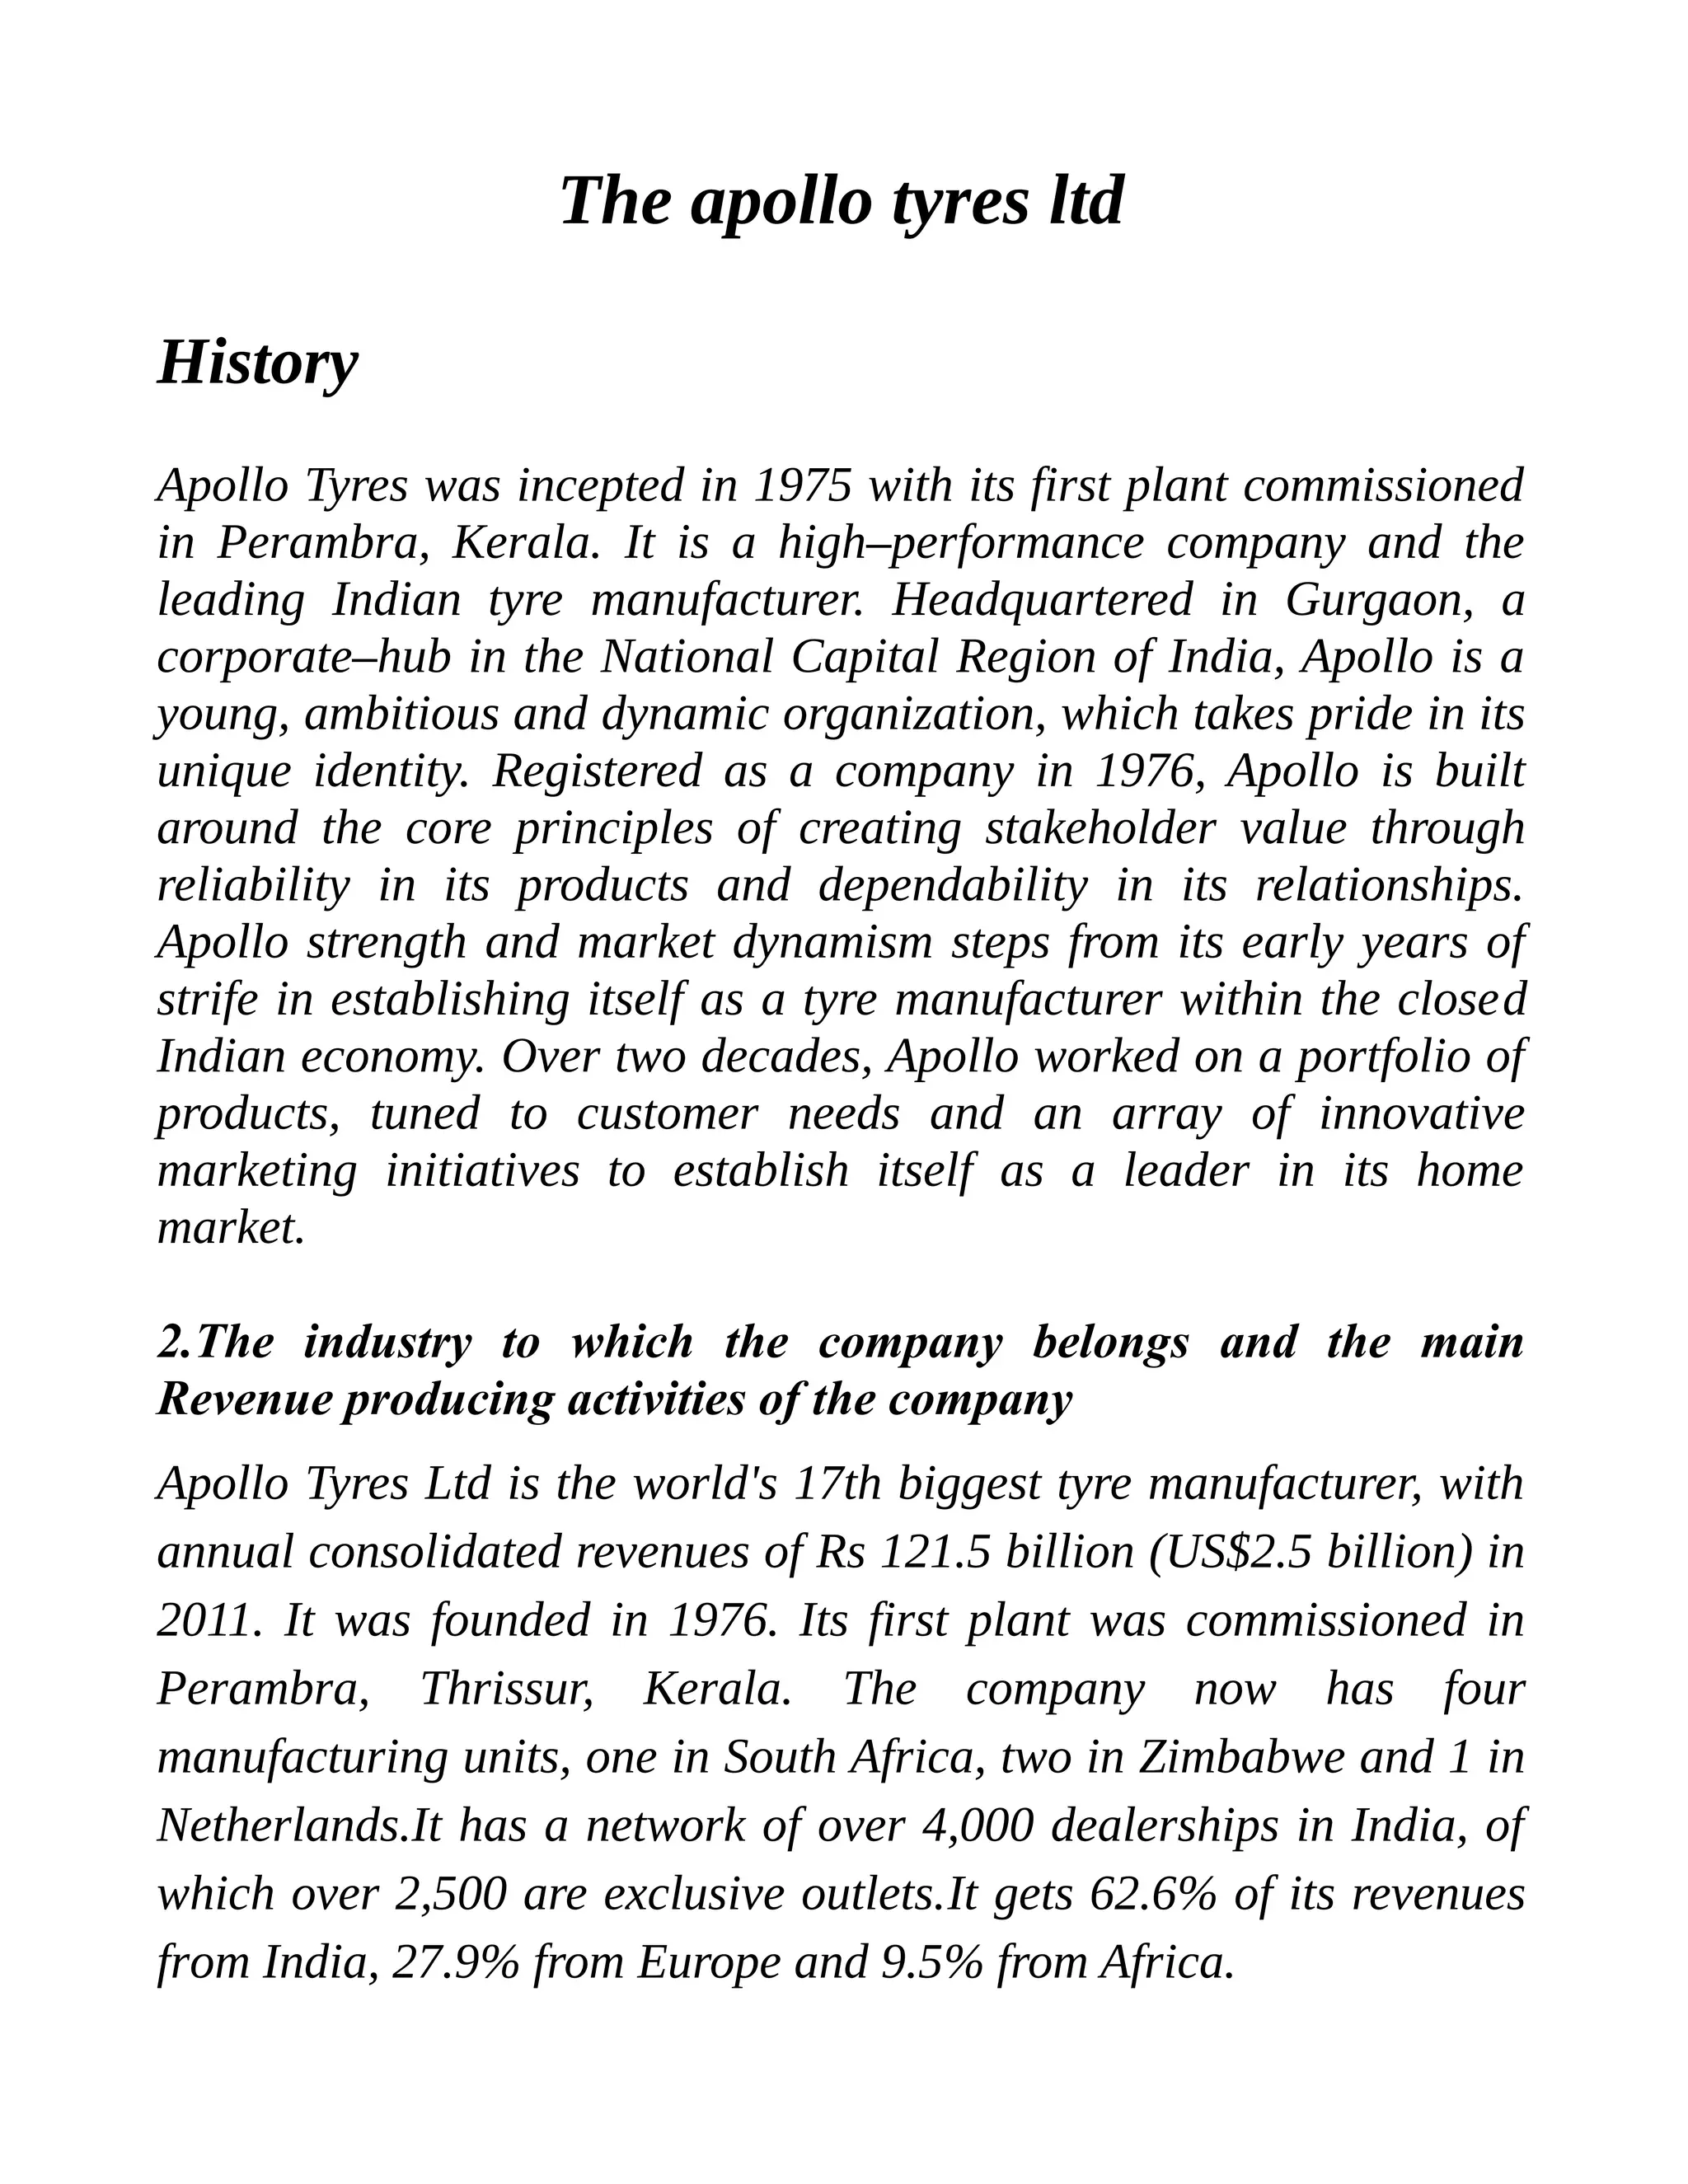
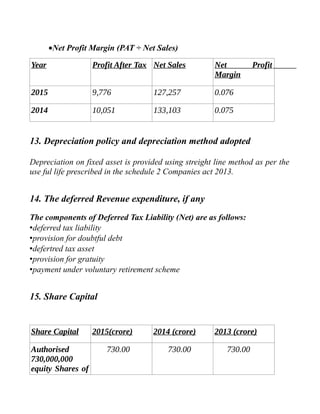
![6. The absolute and percentage change in current assets from 1st
year to 2nd
and from 2nd
year to 3rd
year
Absolute change
[current year's current asset – previous year's current asset]
Year Current Year's
current asset
(crore)
Previous Year's
current asset
(crore)
Absolute
Change (crore)
2015 - 2014 37084.08 41718.03 -4633.95
2014 - 2013 41718.03 36861.65 4856.38
Percentage change
[(absolute change / previous year current asset)*100]
Year Absolute
Change (crore)
Previous Year's
current asset
(crore)
Percentage
change (%)](https://image.slidesharecdn.com/18de9d1f-c297-4458-8e40-2b4674892167-161014172548/85/The-apollo-tyres-ltd-5-320.jpg)
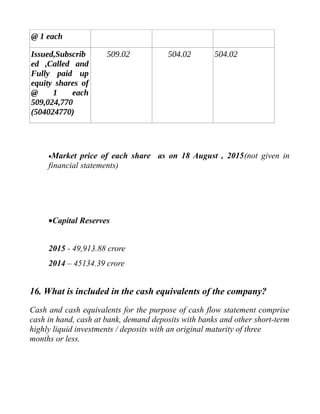
![2015 - 2014 -4633.95 41718.03 -11.10
2014 - 2013 4856.38 36861.65 13.17
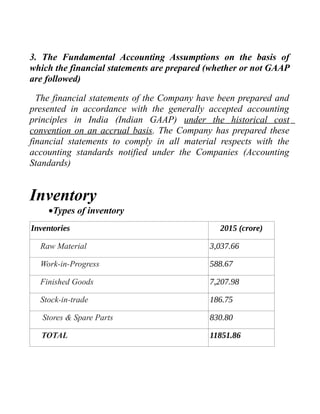
7. Working capital (net current assets ) in each of the 3 years and
the percentage change in working capital from 1st
year to 2nd
and
from 2nd
year to 3rd
year (Note: Working capital = Current Assets –
Current Liabilities)
WORKING CAPITAL
[Total Current Assets – Total Current Liabilities]
Year Total of Current
Assets (crore)
Total of Current
Liabilities
(crore)
Working Capital
(crore)
2013 36861.65 28709.79 8151.86
2014 41718.03 30778.49 10939.54
2015 37084.08 25847.08 11237
Percentage change
(current year – previous year)/previous year *100
Year Current year
working
Previous Year
Working Capital
Percentage](https://image.slidesharecdn.com/18de9d1f-c297-4458-8e40-2b4674892167-161014172548/85/The-apollo-tyres-ltd-6-320.jpg)
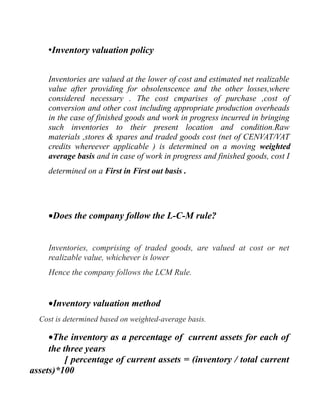
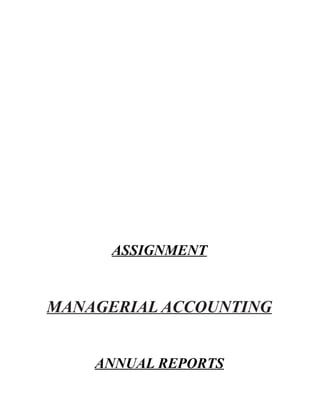
![10. Events occurring after the balance sheet date
No events occurring after balancesheet
11. Revenue trends
•The absolute change and percentage change in revenue from 1st year
to 2nd and from 2nd year to 3rd year
Absolute change
[Current Year Net Revenue – Previous Year Net Revenue]
Year Current Year
Net Revenue
Previous Year
Net Revenue
Absolute
Change
2015 - 2014 127,257 133,103 -5846
2014 - 2013 133,103 127,950 5153
Percentage change:
[(Absolute Change / Previous Year Net Revenue)*100]
Year Absolute
Change
Previous Year
Net Revenue
Percentage
Change (%)
2015 - 2014 -5846 133103 -4.39
2014 - 2013 5153 127950 4.02
Profit after tax](https://image.slidesharecdn.com/18de9d1f-c297-4458-8e40-2b4674892167-161014172548/85/The-apollo-tyres-ltd-8-320.jpg)
![Absolute change
[Current Year Net Revenue – Previous Year Net Revenue
Year Current Year Net
Revenue
Previous Year Net
Revenue
Absolute Change
2015 - 2014 9,776 10,051 -275
2014 - 2013 10,051 6130 3921
Percentage change:
[(Absolute Change / Previous Year Net Revenue)*100]
Year Absolute
Change
Previous Year
Net Revenue
Percentage
Change (%)
2015 - 2014 -275 10051 -2.73
2014 - 2013 3921 6130 63.96
EPS
Absolute change
[Current Year Net Revenue – Previous Year Net Revenue]
Year Current Year
Net Revenue
Previous Year
Net Revenue
Absolute
Change
2015 - 2014 6,450.81 4426.19 2024.62
2014 - 2013 4426.19 4002.14 424.05](https://image.slidesharecdn.com/18de9d1f-c297-4458-8e40-2b4674892167-161014172548/85/The-apollo-tyres-ltd-9-320.jpg)
![Percentage change:
[(Absolute Change / Previous Year Net Revenue)*100]
Year Absolute
Change
Previous Year
Net Revenue
Percentage
Change (%)
2015 - 2014 2024.62 4426.19 45.74
2014 - 2013 424.05 4002.14 10.59
•Gross Profit Margin (Gross Profit ÷ Net Sales)
Year Gross Profit Net Sales Gross Profit
Margin
2015 14,133.17 12726 1.11
2014 12787.14 13310 0.96
•Operating Profit Margin (Operating Profit ÷ Net Sales)
Year Operating Profit Net Sales Operating Profit
Margin
2015 19,844 127,257 0.155
2014 19,734 133,103 0.148](https://image.slidesharecdn.com/18de9d1f-c297-4458-8e40-2b4674892167-161014172548/85/The-apollo-tyres-ltd-10-320.jpg)

Apollo Tyres Ltd is an Indian tyre manufacturer founded in 1976 and headquartered in Gurgaon, India. It has four manufacturing plants located in India, South Africa, and Zimbabwe. Apollo Tyres generates most of its revenue from India but also has sales in Europe and Africa. The company prepares its financial statements according to Indian GAAP and uses the weighted average method to value its inventory, which includes raw materials, work in progress, finished goods, and stores/spare parts. Between 2013-2015, Apollo Tyres' revenues declined slightly but profits increased. The company also saw decreases in inventory levels and current assets over this period. Contingent liabilities are disclosed in the notes to the financial statements


