Downloaded 116 times

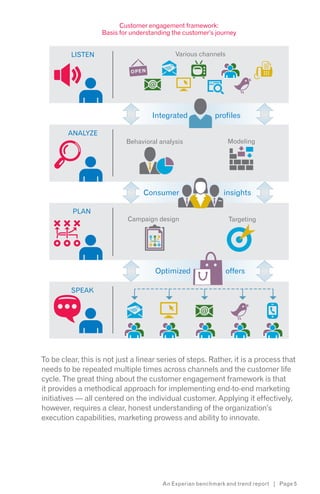
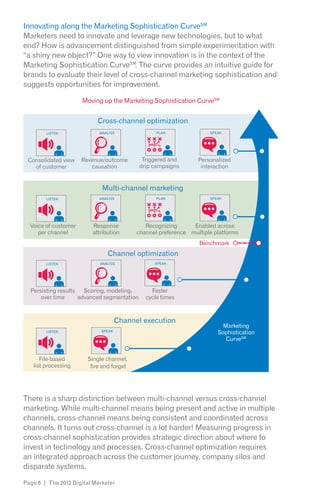
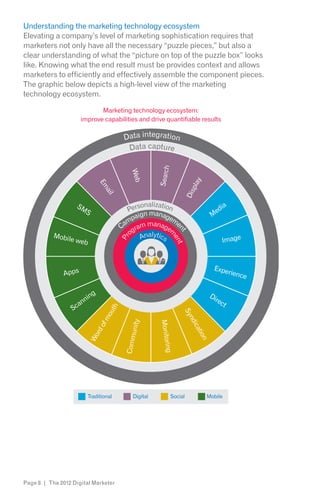
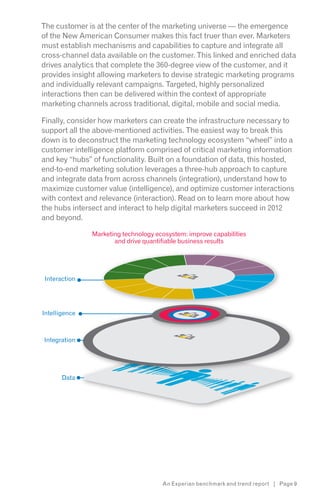


This report focuses on putting customers at the center of marketing strategies through customer obsession. It discusses the need for cross-channel coordination and integration to provide optimized customer experiences across different touchpoints. The report also outlines a customer engagement framework to help marketers listen to customers, analyze their behaviors, plan campaigns, and effectively engage with customers through personalized interactions.


