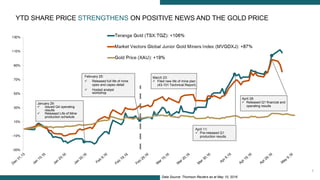
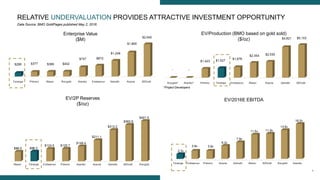
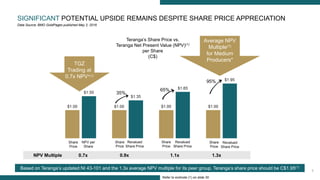
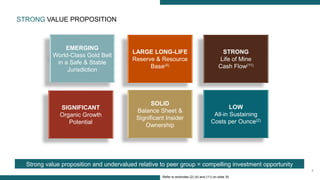
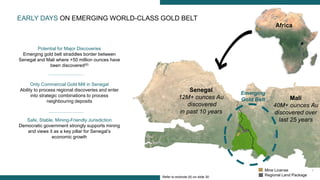
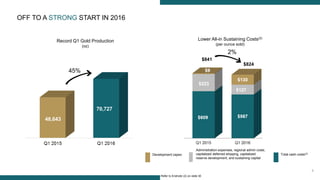
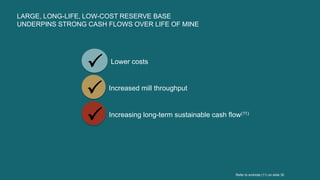
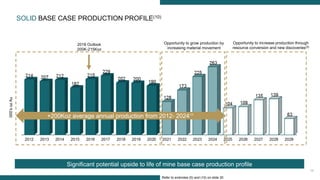
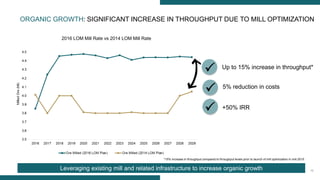
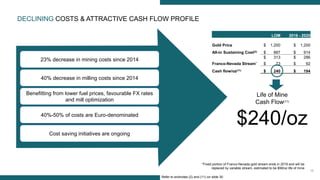
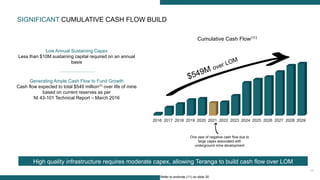
This investor presentation provides an overview of Teranga Gold Corporation and highlights its strong value proposition as an emerging gold producer in West Africa. Key points include:
- Teranga is an emerging gold producer with operations in Senegal, located within a prospective gold belt along the Senegal-Mali border where over 50 million ounces have been discovered.
- In the first quarter of 2016, Teranga achieved record gold production of 45,000 ounces at lower all-in sustaining costs of $824 per ounce sold.
- Teranga has a large, long-life reserve and resource base that supports strong cash flows over the mine life based on the current life of mine plan. There is also potential to
Anglo American hosted a presentation for investors and analysts, providing a detailed update on its operational turnaround and the next phase of transformation to position the business to outperform, by realising its full potential and delivering enhanced and sustainable returns to shareholders.
Kumba Iron Ore Interim Results - for the six months ended 20 June 2013Anglo American
You can find out more about Anglo American here:
http://www.angloamerican.com/
http://www.facebook.com/angloamerican
http://www.twitter.com/angloamerican
http://www.youtube.com/angloamerican
http://www.flickr.com/photos/angloamerican
http://www.linkedin.com/company/anglo-american
Copper North Mining - Corporate Presentation - October 22, 2015coppernorthmining
Copper North Mining Corp. (TSX.V:COL) is a Canadian mining exploration and development company, spun out from Western Copper Corporation (TSX:WRN) in October 2011. Copper North's key asset is the Carmacks Copper Project, located in the Yukon Territory, Canada. Carmacks is permitted for construction and will produce 30 million pounds of cathode copper per year. The project is being re-engineered as a copper-gold-silver leach operation. A Preliminary Economic Assessment was completed in May 2014 and indicates that the addition of gold and silver recovery provides a positive improvement in project economics. A second phase of engineering work is in progress to evaluate opportunities to further improve operations and reduce capital and operating costs. The company intends to resume exploration of the Carmacks deposits to increase mineral resources for inclusion in the mine plan, and expansion of mine life.
The Company has also recently acquired the Thor property, immediately south of the Kemess Mine in north central British Columbia. Thor provides Copper North with an attractive exploration and discovery opportunity adjacent a major dormant mine-mill complex. An exploration program, including drilling of porphyry copper-gold targets, is planned for summer 2015.
Copper North also holds the high-grade Redstone property located in the Northwest Territories, Canada.
This presentation was given at a meeting of the Cooperating Agencies for Rosemont Copper Project on April 1, 2009. The presentation by Rosemont was designed to give a project orientation and show the project components as presented in the Mine Plan of Operations. This presentation was given after the public scoping was complete and also highlights some adjustments Rosemont was contemplating to address those concerns.
Engineering analytics presented information on the groundwater modeling performed for the Rosemont Copper Project to a group of well owners. The presentation was given on April 3, 2012.
A presentation on the Heap Leach Facilities associated with the Rosemont Copper Project developed by the Tetra Tech. This presentation was given to the Forest Service and their contractors during technical transfer meetings in November 2008.
2. 2
This presentation contains certain statements that constitute forward-looking information within the meaning of applicable securities laws (“forward-looking statements”),
which reflects management’s expectations regarding Teranga Gold Corporation’s (“Teranga” or the “Company”) future growth, results of operations (including, without
limitation, future production and capital expenditures), performance (both operational and financial) and business prospects (including the timing and development of new
deposits and the success of exploration activities) and opportunities. Wherever possible, words such as “plans”, “expects”, “does not expect”, “budget”, “scheduled”,
“estimates”, “forecasts”, “anticipate” or “does not anticipate”, “believe”, “intend”, “ability to” and similar expressions or statements that certain actions, events or results “may”,
“could”, “would”, “might” or “will” be taken, occur or be achieved, have been used to identify such forward looking information. Although the forward-looking information
contained in this presentation reflect management’s current beliefs based upon information currently available to management and based upon what management believes to
be reasonable assumptions, Teranga cannot be certain that actual results will be consistent with such forward looking information. Such forward-looking statements are
based upon assumptions, opinions and analysis made by management in light of its experience, current conditions and its expectations of future developments that
management believe to be reasonable and relevant. These assumptions include, among other things, the ability to obtain any requisite Senegalese governmental approvals,
the accuracy of mineral reserve and mineral resource estimates, gold price, exchange rates, fuel and energy costs, future economic conditions, anticipated future estimates of
free cash flow, and courses of action. Teranga cautions you not to place undue reliance upon any such forward-looking statements
The risks and uncertainties that may affect forward-looking statements include, among others: the inherent risks involved in exploration and development of mineral
properties, including government approvals and permitting, changes in economic conditions, changes in the worldwide price of gold and other key inputs, changes in mine
plans and other factors, such as project execution delays, many of which are beyond the control of Teranga, as well as other risks and uncertainties which are more fully
described in the Company’s Revised Annual Information Form dated September 1, 2015, and in other company filings with securities and regulatory authorities which are
available at www.sedar.com. Teranga does not undertake any obligation to update forward-looking statements should assumptions related to these plans, estimates,
projections, beliefs and opinions change. Nothing in this report should be construed as either an offer to sell or a solicitation to buy or sell Teranga securities.
This presentation is dated as of the date on the front cover. All references to the Company include its subsidiaries unless the context requires otherwise.
This presentation contains references to Teranga using the words “we”, “us”, “our” and similar words and the reader is referred to using the words “you”, “your” and similar
words.
All dollar amounts stated are denominated in U.S. dollars unless specified otherwise.
FORWARD-LOOKING STATEMENTS
3. 3
Data Source: Thomson Reuters as at May 10, 2016
YTD SHARE PRICE STRENGTHENS ON POSITIVE NEWS AND THE GOLD PRICE
February 25:
Released full life of mine
opex and capex detail
Hosted analyst
workshop
March 23:
Filed new life of mine plan
(43-101 Technical Report)
January 29:
Issued Q4 operating
results
Released Life of Mine
production schedule
April 11:
Pre-released Q1
production results
April 28:
Released Q1 financial and
operating results
4. 4
Data Source: BMO GoldPages published May 2, 2016
RELATIVE UNDERVALUATION PROVIDES ATTRACTIVE INVESTMENT OPPORTUNITY
Enterprise Value
($M)
EV/Production (BMO based on gold sold)
($/oz)
EV/2P Reserves
($/oz)
EV/2016E EBITDA
*Project Developers
5. 5
SIGNIFICANT POTENTIAL UPSIDE REMAINS DESPITE SHARE PRICE APPRECIATION
Based on Teranga’s updated NI 43-101 and the 1.3x average NPV multiple for its peer group, Teranga’s share price should be C$1.95(1)
35%
65%
Revalued
Share Price
NPV Multiple 0.7x 0.9x 1.1x 1.3x
Teranga’s Share Price vs.
Teranga Net Present Value (NPV)(1)
per Share
(C$)
Share
Price
95%
Revalued
Share Price
Share
Price
NPV per
Share
Share
Price
Refer to endnote (1) on slide 30
Average NPV
Multiple(1)
for Medium
Producers*
Revalued
Share Price
Share
Price
TGZ
Trading at
0.7x NPV*(1)
Data Source: BMO GoldPages published May 2, 2016
6. 6
EMERGING
World-Class Gold Belt
in a Safe & Stable
Jurisdiction
SOLID
Balance Sheet &
Significant Insider
Ownership
LARGE LONG-LIFE
Reserve & Resource
Base(4)
LOW
All-in Sustaining
Costs per Ounce(2)
SIGNIFICANT
Organic Growth
Potential
STRONG
Life of Mine
Cash Flow(11)
Refer to endnotes (2) (4) and (11) on slide 30
STRONG VALUE PROPOSITION
Strong value proposition and undervalued relative to peer group = compelling investment opportunity
7. 7
Senegal
12M+ ounces Au
discovered
in past 10 years
Mali
40M+ ounces Au
discovered over
last 25 years
Africa
Emerging
Gold Belt
Potential for Major Discoveries
Emerging gold belt straddles border between
Senegal and Mali where +50 million ounces have
been discovered(6)
Only Commercial Gold Mill in Senegal
Ability to process regional discoveries and enter
into strategic combinations to process
neighbouring deposits
Safe, Stable, Mining-Friendly Jurisdiction
Democratic government strongly supports mining
and views it as a key pillar for Senegal’s
economic growth
EARLY DAYS ON EMERGING WORLD-CLASS GOLD BELT
Mine License
Regional Land PackageRefer to endnote (6) on slide 30
8. 8
Board of Directors
(as of May 7, 2016)
Alan Hill Chairman
Richard Young President, CEO & Director
Jendayi Frazer Independent Director
Edward Goldenberg Independent Director
Chris Lattanzi Independent Director
David Mimran Director & Largest Shareholder
Alan Thomas Independent Director
Frank Wheatley Independent Director
INDEPENDENT AND INVESTED
New Strategic Cornerstone Investor
David Mimran (Tablo Corporation) completed strategic
private placement for 39.2M shares in Q4 2015
Strong Partner With In-Depth Local Knowledge
Mimran Group has a long history of operating
successfully and responsibly in Africa and is the largest
private sector employer in Senegal
Strong & Experienced Board
Extensive experience in mining, finance, legal,
governance, government relations as well as on the
ground working knowledge of Africa
Insiders own ~15% of the Company
9. 9
Refer to Endnote (2) on slide 30
Lower All-in Sustaining Costs(2)
(per ounce sold)
2%
Administration expenses, regional admin costs,
capitalized deferred stripping, capitalized
reserve development, and sustaining capital
Development capex Total cash costs(2)
$841
$824
OFF TO A STRONG START IN 2016
Record Q1 Gold Production
(oz)
45%
10. 10
Pro Forma Cash Balance
($M)
IMPROVED CASH FLOW DRIVES STRONGER PROVIDES LIQUIDITY AND FLEXIBILITY
45% increase in cash flow from operations to $24.1 million in Q1 2016
$57.6
$70.0
Free Cash Flow(3)
$131
/oz
$144
/oz
33%
10%
Refer to endnotes (3) on slide 30
11. 11
TRACKING 2016 OUTLOOK
Refer to endnotes (2) (6) (7) (8) (9) and (10) on slide 30
Assumptions for 2016(6)
$1,100 average gold price per ounce
Brent oil: $40/barrel
Euro/USD exchange rate of 1.1:1
Franco-Nevada Streaming
All-in sustaining costs exclude stream impact of ~$100/oz as
stream is treated as deferred revenue under IFRS
2016 Guidance
Operating Results
Ore mined (‘000t) 2,000 - 2,500
Waste mined (‘000t) 34,500 - 36,000
Total mined (‘000t) 36,500 - 38,500
Grade mined (g/t) 2.75 - 3.25
Strip ratio waste/ore 13.00 - 15.00
Ore milled (‘000t) 3,700 - 3,900
Head grade (g/t) 1.80 - 2.00
Recovery rate % 90 - 91
Gold produced (9)(10)
(oz) 200,000 - 215,000
Total cash cost (incl. royalties) (2)
$/oz sold 600 - 650
Total all-in sustaining cash cost (2)
$/oz sold 900 - 975
Mining $/t mined 2.20 - 2.40
Mining long haul $/t hauled 4.00 - 4.50
Milling $/t milled 11.00 - 12.00
G&A $/t milled 4.25 - 4.50
Mine Production Costs $ millions 145 - 155
Regional Administration Costs (7)
(included in Cost of Sales)
$ millions 2
Capital Expenditures
Mine site sustaining $ millions 8 - 10
Capitalized reserve development $ millions 7
Project development costs $ millions 17 - 20
Total Capital Expenditures (8)
$ millions 30 - 35
Exploration (expensed) $ millions 5
Corporate Administration Expense (7)
$ millions 8 - 9
CSR Expense (7)
$ millions 3 - 3.5
12. 12
TRANSFORMATIONAL ACQUISITION FINANCED BY FRANCO-NEVADA
In connection with Teranga’s transformational acquisition
of OJVG in 2014, Franco-Nevada (FNV) invested $135
million in exchange for a fixed and floating stream on
Teranga’s future production
Fixed gold deliveries of 22,500 ounces per year from
2014 to 2019 with trailing 6% gold stream once fixed
deliveries completed in 2019
Franco-Nevada to pay 20% of spot gold price per ounce
delivered (6% stream is equivalent to a 4.8% NSR royalty)
Streaming agreement covers Teranga’s current mine
license and land package
Effective Cost of Franco-Nevada Stream on
All-in Sustaining Costs per Ounce
(based on $1,200/oz gold price)
13. Lower costs
Increased mill throughput
Increasing long-term sustainable cash flow(11)
LARGE, LONG-LIFE, LOW-COST RESERVE BASE
UNDERPINS STRONG CASH FLOWS OVER LIFE OF MINE
Refer to endnote (11) on slide 30
14. 14
SOLID BASE CASE PRODUCTION PROFILE(10)
000’sozAu
Opportunity to grow production by
increasing material movement
Opportunity to increase production through
resource conversion and new discoveries(5)
+200Koz average annual production from 2012- 2024(10)
Significant potential upside to life of mine base case production profile
Refer to endnotes (5) and (10) on slide 30
2016 Outlook
200K-215Koz
15. 15
ORGANIC GROWTH: SIGNIFICANT INCREASE IN THROUGHPUT DUE TO MILL OPTIMIZATION
2016 LOM Mill Rate vs 2014 LOM Mill Rate
Leveraging existing mill and related infrastructure to increase organic growth
Up to 15% increase in throughput*
5% reduction in costs
+50% IRR
*15% increase in throughput compared to throughput levels prior to launch of mill optimization in mid 2015
16. 16
DECLINING COSTS & ATTRACTIVE CASH FLOW PROFILE
Life of Mine
Cash Flow(11)
$240/oz
23% decrease in mining costs since 2014
40% decrease in milling costs since 2014
Benefitting from lower fuel prices, favourable FX rates
and mill optimization
40%-50% of costs are Euro-denominated
Cost saving initiatives are ongoing
LOM 2016 - 2020
Gold Price $ 1,200 $ 1,200
All-in Sustaining Cost(2) $ 887 $ 914
$ 313 $ 286
Franco-Nevada Stream* $ 73 $ 92
Cash flow/oz(11) $ 240 $ 194
*Fixed portion of Franco-Nevada gold stream ends in 2019 and will be
replaced by variable stream, estimated to be $58/oz life of mine
Refer to endnotes (2) and (11) on slide 30
17. 17
SIGNIFICANT CUMULATIVE CASH FLOW BUILD
One year of negative cash flow due to
large capex associated with
underground mine development
Low Annual Sustaining Capex
Less than $10M sustaining capital required on an annual
basis
Generating Ample Cash Flow to Fund Growth
Cash flow expected to total $549 million(7) over life of mine
based on current reserves as per
NI 43-101 Technical Report – March 2016
High quality infrastructure requires moderate capex, allowing Teranga to build cash flow over LOM
Refer to endnote (11) on slide 30
Cumulative Cash Flow(11)
18. 18
(8)
90
180
330
390
350
730
2.6M Proven & Probable Reserves(4) at $1,100 gold.
Average mined grade of 1.59 grams per tonne*
(As at December 31, 2015)
Proven & Probable Reserves(4)
(in Moz)
Refer to endnote (4) on slide 30
LARGE RESERVE BASE WITH 13.5-YEAR MINE LIFE
310
220
30
Increased reserve base by 80%, net of 5-years’ production, through acquisition and exploration
80% increase in reserves since IPO
*Not including stockpile of 0.39Moz
19. 19
GROWING RESERVES ON MINE LICENSE
Mine License of 291km2
Focus on increasing reserves on mine license, which
are within close proximity to mill
Reserves of 2.6Moz at $1,100 Gold(4)
Average mined grade of 1.59 grams per tonne (not
including stockpile of 0.39Moz)
Multi-year Development Program
Focused on adding higher grade mill material and
lower grade material for potential heap leach
Refer to endnotes (4) on slide 30
Masato
Au 730 (Koz)
Niakafiri Main
Au 260 (Koz)
Niakafiri SW
Au 10 (Koz)
Maki Medina
Au 30 (Koz)
Niakafiri SE
Au 40 (Koz)
Kerekounda
Au 90 (Koz)
Golouma West
Au 200 (Koz)
Golouma South
Au 130 (Koz)
Golouma South
Au 60 (Koz)
Golouma West
1 - Au 120 (Koz)
2- Au 60 (Koz)
Sabodala
Au 180 (Koz)
Kerekounda
Au 100 (Koz)
Reserves – Open Pit
Reserves – U/G
20. 20
FOCUSED ON BIG TARGETS ON LARGE REGIONAL LAND PACKAGE
Soreto-Soreto North
DDH Drilling
Program &
Trenching
Cinnamon North
Prospect
Trenching & DDH
Drilling Program
Leoba-Lerinde Granite
DDH Program &
Trenching
Leocounda Prospect
DDH Drilling Program
& Trenching
Marougou
Prospect
DDH Drilling
Program
Nienienko Main
RC Drilling Program
Marougou West
Prospect
Trenching & DDH
Drilling Program
Bransan
Trenching &
Drilling Program
KA Prospect
DDH Drilling
Program
~1,000km² Regional Land Package
Exploration permits encompassing large of land
surrounding Teranga’s mine license
First Discovery: High-Grade Gora
~5 grams per tonne deposit developed in 2015
Increasing Exploration Spend & Bench Strength
Focused on large discoveries – Increased focus in the
last six months has advanced a number of prospects
that are currently in drilling phase
21. 21
FUTURE ORGANIC GROWTH: HEAP LEACHING
Heap Leach Flow SheetTechnically Viable For Processing Low-grade Ore
Confirmed by pre-feasibility study,
which was completed in Q4 2015
High Ore Recovery Range
Oxide 78% - 83%
Transition 61% - 66%
Current Economic Estimates
Capital cost: $40M + $10M contingency
Processing costs: $7 - $8 per tonne
Valuable Stockpile
~150,000 ounces of low-grade inventory
available for heap leaching
Heap leaching has potential to increase Teranga’s annual production by 10% - 20%
22. 22
SIGNIFICANT POTENTIAL UPSIDE REMAINS DESPITE SHARE PRICE APPRECIATION
Based on Teranga’s updated NI 43-101 and the 1.3x average NPV multiple for its peer group, Teranga’s share price should be C$1.95(1)
35%
65%
Revalued
Share Price
NPV Multiple 0.7x 0.9x 1.1x 1.3x
Teranga’s Share Price vs.
Teranga Net Present Value (NPV)(1)
per Share
(C$)
Share
Price
95%
Revalued
Share Price
Share
Price
NPV per
Share
Share
Price
Refer to endnote (1) on slide 30
Average NPV
Multiple(1)
for Medium
Producers*
Revalued
Share Price
Share
Price
TGZ
Trading at
0.7x NPV*(1)
Data Source: BMO GoldPages published May 2, 2016
25. 25
OPEN PIT AND UNDERGROUND MINERAL RESOURCES SUMMARY(12)
As at December 31, 2015
Notes for Mineral Resources Summary
1.CIM definitions were followed for Mineral Resources.
2.Open pit oxide Mineral Resources are estimated at a cut-off
grade of 0.35 g/t Au, except for Gora at 0.48 g/t Au.
3.Open pit transition and fresh rock Mineral Resources are
estimated at a cut-off grade of 0.40 g/t Au, except for Gora at
0.55 g/t Au.
4.Underground Mineral Resources are estimated at a cut-off
grade of 2.00 g/t Au.
5.Measured Resources at Sabodala include stockpiles which
total 9.2 Mt at 0.77 g/t Au for 229,000 oz...
6.Measured Resources at Gora include stockpiles which total
0.1 Mt at 1.30 g/t Au for 6,000 oz...
7.Measured Resources at Masato include stockpiles which
total 5.9 Mt at 0.79 g/t Au for 150,000 oz...
8.High grade assays were capped at grades ranging from 1.5
g/t Au to 110 g/t Au.
9.The figures above are “Total” Mineral Resources and include
Mineral Reserves.
10.Open pit shells were used to constrain open pit resources.
11.Mineral Resources are estimated using a gold price of
US$1,450 per ounce.
12.Sum of individual amounts may not equal due to rounding.
Deposit Domain
Measured Indicated Measured and Indicated Inferred
Tonnes Grade Au Tonnes Grade Au Tonnes Grade Au Tonnes Grade Au
('000s) (g/t Au) ('000s) ('000s) (g/t Au) ('000s) ('000s) (g/t Au) ('000s) ('000s) (g/t Au) ('000s)
Sabodala
Open Pit 13,742 1.13 497 6,488 1.59 332 20,230 1.28 829 2,525 1.23 100
Underground 1,631 3.65 191 1,631 3.65 191 460 3.60 53
Combined 13,742 1.13 497 8,119 2.01 524 21,861 1.45 1,021 2,985 1.60 153
Gora
Open Pit 466 4.55 68 1,083 6.11 213 1,549 5.64 281 53 4.95 8
Underground 315 5.14 52 315 5.14 52 59 4.83 9
Combined 466 4.55 68 1,398 5.89 265 1,864 5.56 333 113 4.88 18
Niakafiri
Open Pit 4,909 1.33 210 7,222 0.98 228 12,131 1.12 438 2,472 1.09 87
Underground 184 2.51 15
Combined 4,909 1.33 210 7,222 0.98 228 12,131 1.12 438 2,656 1.19 102
Masato
Open Pit 5,894 0.79 150 22,617 1.16 844 28,511 1.08 994
Underground 1,163 2.75 103 1,163 2.75 103 1,984 2.85 182
Combined 5,894 0.79 150 23,780 1.24 947 29,674 1.15 1,097 1,984 2.85 182
Golouma
Open Pit 6,800 2.98 653 6,800 2.98 653 88 2.46 7
Underground 2,134 4.09 280 2,134 4.09 280 854 3.66 100
Combined 8,934 3.25 933 8,934 3.25 933 942 3.55 107
Kerekounda
Open Pit 1,255 4.28 173 1,255 4.28 173
Underground 499 4.88 78 499 4.88 78 235 5.70 43
Combined 1,755 4.45 251 1,755 4.45 251 235 5.70 43
Maki Medina
Open Pit 2,112 1.22 83 2,112 1.22 83 114 0.81 3
Underground 109 2.71 10 109 2.71 10 85 2.54 7
Combined 2,221 1.30 93 2,221 1.30 93 199 1.55 10
Niakafiri SW
Open Pit 770 0.81 20 770 0.81 20 30 0.67 1
Underground
Combined 770 0.81 20 770 0.81 20 30 0.67 1
Niakafiri SE
Open Pit 4,439 0.98 140 4,439 0.98 140 162 0.96 5
Underground 73 2.60 6 73 2.60 6 16 2.64 1
Combined 4,512 1.01 146 4,512 1.01 146 177 1.11 6
Others
Open Pit 1,590 1.80 92 1,590 1.80 92 4,890 1.26 198
Underground 59 9.15 18 59 9.15 18 1,045 3.68 124
Combined 1,649 2.07 110 1,649 2.07 110 5,935 1.69 322
Total
Open Pit 25,011 1.15 926 54,377 1.59 2,777 79,388 1.45 3,703 10,333 1.23 409
Underground 5,985 3.84 738 5,985 3.84 738 4,921 3.38 534
Combined 25,011 1.15 926 60,362 1.81 3,516 85,373 1.62 4,441 15,254 1.92 944
Refer to endnote (12) on slide 30
26. 26
OPEN PIT AND UNDERGROUND MINERAL RESERVES SUMMARY
As at December 31, 2015
Notes for Mineral Reserves Summary
1.CIM definitions were followed for Mineral Reserves.
2.Mineral Reserve cut off grades for range from are 0.35 g/t to 0.63 g/t Au for
oxide and 0.42 g/t to 0.73 g/t Au for fresh based on a $1,100/oz gold price
3.Mineral Reserve cut off grades for Sabodala 0.45 g/t for oxide and 0.55 g/t
for fresh based on a $1,100/oz gold price
4.Underground reserves cut-off grades ranged from 2.3-2.6 g/t based on
$1,200/oz gold price
5.Sum of individual amounts may not equal due to rounding.
6.The Niakafiri Main deposit is adjacent to the Sabodala village and relocation
of at least some portion of the village will be required which will necessitate a
negotiated resettlement program with the affected community members..
Deposits
Proven Probable Proven and Probable
Tonnes
(Mt)
Grade
(g/t)
Au
(Moz)
Tonnes
(Mt)
Grade
(g/t)
Au
(Moz)
Tonnes
(Mt)
Grade
(g/t)
Au
(Moz)
Sabodala 1.57 1.57 0.08 2.33 1.36 0.10 3.90 1.44 0.18
Gora 0.31 4.94 0.05 1.15 4.74 0.17 1.46 4.78 0.22
Niakafiri Main 4.06 1.23 0.16 3.41 0.94 0.10 7.47 1.10 0.26
Subtotal ML 5.95 1.52 0.29 6.88 1.71 0.38 12.83 1.62 0.67
Masato 21.41 1.06 0.73 21.41 1.06 0.73
Golouma West 3.23 1.96 0.20 3.23 1.96 0.20
Golouma South 1.27 3.09 0.13 1.27 3.09 0.13
Kerekounda 0.79 3.44 0.09 0.79 3.44 0.09
Maki Medina 0.90 1.17 0.03 0.90 1.17 0.03
Niakafiri SE 1.12 1.09 0.04 1.12 1.09 0.04
Niakafiri SW 0.37 0.92 0.01 0.37 0.92 0.01
Subtotal SOMIGOL - - - 29.08 1.32 1.23 29.08 1.32 1.23
Subtotal Open Pit 5.95 1.52 0.29 35.96 1.39 1.61 41.92 1.41 1.90
Golouma West 1 0.62 6.07 0.12 0.62 6.07 0.12
Golouma West 2 0.45 4.39 0.06 0.45 4.39 0.06
Golouma South 0.47 4.28 0.06 0.47 4.28 0.06
Kerekounda 0.61 4.95 0.10 0.61 4.95 0.10
Subtotal Underground 0.00 0.00 - 2.15 5.01 0.35 2.15 5.01 0.35
Total 5.95 1.52 0.29 38.11 1.60 1.96 44.07 1.59 2.25
Stockpiles 15.27 0.79 0.39 0.00 0.00 0.00 15.27 0.79 0.39
Total Including Stockpile 21.23 0.99 0.68 38.11 1.60 1.96 59.34 1.38 2.63
27. 27
UPDATED LIFE OF MINE SCHEDULE
Notes:
The estimated ore reserves underpinning the
production targets set out in the following table,
have been prepared by Mr. Paul Chawrun, who is
a Competent Person, in accordance with the
requirements of the 2012 JORC Code.
This production guidance is based on existing
proven and probable ore reserves from the
Sabodala mining license as at December 31,
2015
Stockpile balances at January 1, 2016 included
15.3 Mt at 0.79 g/t for 0.39 million contained
ounces
*The schedule summarizes Niakafiri from
“Niakafiri Main” and “Niakafiri SE”. The portion of
Niakafiri SE to be mined lies outside of the
Sabodala Village area and assumes relocation is
not required.
LOM
2016 -
2020
Average
2016 2017 2018 2019 2020 2021 2022 2023 2024 2025 2026 2027 2028 2029
Sabodala
Ore Mined Mt 3.9 0.3 1.5 2.0
Ore Grade 1.44 1.11 1.33 1.58
Contained Oz Moz 0.18 0.01 0.07 0.10
Waste Mt 31.0 11.1 15.0 5.0
Masato
Ore Mined Mt 21.4 0.5 0.7 0.4 1.1 2.8 5.0 4.3 6.7
Ore Grade g/t 1.06 1.10 0.74 0.70 0.86 0.93 1.00 1.02 1.27
Contained Oz Moz 0.73 0.02 0.02 0.01 0.03 0.09 0.16 0.14 0.27
Waste Mt 110.2 0.2 16.2 5.8 19.4 27.2 21.5 11.6 8.2
Gora
Ore Mined Mt 1.5 0.7 0.7 0.1
Ore Grade g/t 4.78 4.00 5.15 7.90
Contained Oz Moz 0.22 0.08 0.12 0.02
Waste Mt 32.2 17.9 14.1 0.2
Kerekounda
Ore Mined Mt 0.8 0.0 0.5 0.3
Ore Grade g/t 3.44 0.99 3.39 3.74
Contained Oz Moz 0.09 0.00 0.06 0.03
Waste Mt 18.2 3.6 13.0 1.6
Golouma
Ore Mined Mt 4.5 1.2 0.9 2.4 0.1
Ore Grade g/t 2.28 3.08 1.98 1.99 2.24
Contained Oz Moz 0.33 0.12 0.06 0.15 0.00
Waste Mt 49.6 14.8 18.4 16.4 0.0
Niakafiri*
Ore Mined Mt 9.0 1.5 4.0 3.5
Ore Grade g/t 1.09 1.05 1.10 1.10
Contained Oz Moz 0.31 0.05 0.14 0.12
Waste Mt 26.6 6.2 12.5 7.9
Maki Medina
Ore Mined Mt 0.9 0.9
Ore Grade g/t 1.17 1.17
Contained Oz Moz 0.03 0.03
Waste Mt 2.9 2.9
Underground
Ore Mined Mt 2.1 0.1 0.3 0.3 0.3 0.1 0.2 0.4 0.4 0.2
Ore Grade g/t 5.01 5.00 4.95 4.63 4.33 4.39 5.55 5.36 5.52 4.76
Contained Oz Moz 0.35 0.02 0.05 0.05 0.04 0.01 0.03 0.06 0.07 0.02
Summary
Ore Mined Mt 44.1 3.1 2.3 1.6 3.4 4.7 3.5 3.0 5.3 8.6 10.4 0.1 0.2 0.4 0.4 0.2
Ore Grade g/t 1.59 1.94 2.91 3.74 1.51 1.42 1.63 1.09 1.22 1.20 1.29 4.39 5.55 5.36 5.52 4.76
Contained Oz Moz 2.25 0.20 0.22 0.19 0.17 0.22 0.19 0.10 0.21 0.33 0.43 0.01 0.03 0.06 0.07 0.02
Waste Mt 270.7 36.3 36.4 38.2 35.9 35.4 35.8 27.2 21.5 24.2 16.1
Movement Mt 314.7 39.5 38.7 39.8 39.3 40.1 39.4 30.2 26.8 32.8 26.5 0.1 0.2 0.4 0.4 0.2
Stockpile Ore
Balance
Mt
13.7 11.1 10.1 10.4 9.4 7.9 8.7 12.9 18.9 14.5 10.2 6.2 2.1
Stockpile Grade g/t 0.82 0.84 0.76 0.73 0.70 0.68 0.67 0.66 0.68 0.66 0.66 0.66 0.66
Contained Oz Moz 0.36 0.30 0.25 0.24 0.21 0.17 0.19 0.27 0.41 0.31 0.22 0.13 0.04
Ore Milled Mt 59.3 4.3 3.9 4.2 4.5 4.5 4.5 4.5 4.4 4.5 4.4 4.4 4.4 4.4 4.4 2.3
Head Grade g/t 1.38 1.66 1.93 1.85 1.56 1.54 1.46 0.99 1.35 1.73 2.06 0.82 0.85 1.06 1.09 0.94
Oxide % 21% 27% 37% 25% 26% 31% 19% 28% 16% 29% 0% 17% 19% 18% 18% 18%
Produced Oz Moz 2.376 0.207 0.215 0.229 0.202 0.200 0.190 0.128 0.173 0.225 0.263 0.104 0.109 0.135 0.139 0.063
30. 30
ENDNOTES
1. Net Present Value (“NPV”) per share is a Non-IFRS financial measure. NPV per share, average NPV multiple of medium producers, and Teranga’s share price is as per BMO GoldPages published May 2, 2016. According
to BMO GoldPages, NPV per share is calculated using the net present value of the life of mine cash flows based on the NI 43-101 plan, less cash flow of corporate costs, less net debt per share, using the model at SPOT
commodity prices and exchange rates. The “Revalued Share Price” is calculated using the NPV per share at SPOT times the NPV multiples as listed. The NPV calculation assumes a US$1,296 SPOT gold price per ounce,
5% discount, 0.80 USD/CAD exchange rate. For more information regarding Non-IFRS financial measures, please refer to Non-IFRS Performance Measures in the Company’s Management’s Discussion and Analysis for
the three months ended March 31, 2016 accessible on the Company’s website at www.terangagold.com.
2. Total cash costs per ounce and all-in sustaining costs per ounce are non-IFRS financial measures and do not have standard meanings under IFRS. All-in sustaining costs per ounce sold include total cash costs per ounce,
administration expenses (excluding Corporate depreciation expense), Regional Administration Costs, capitalized deferred stripping, capitalized reserve development and mine site & development capital expenditures as
defined by the World Gold Council. For more information regarding these measures, please refer to Non-IFRS Performance Measures in the Company’s Management’s Discussion and Analysis for the three months ended
March 31, 2016 accessible on the Company’s website at www.terangagold.com.
3. Free cash flow and free cash flow per ounce are defined as operating cash flow less capital expenditures.
4. Mineral Reserves and Mineral Resources estimates as at December 31, 2015 as per Company disclosure. For more information regarding Teranga Gold’s Mineral Reserves and Resources, please refer to Teranga Gold’s
December Quarter and Year-end 2015 Report accessible on the Company's website at www.terangagold.com.
5. Over the past several years more than twelve million ounces of measured and indicated resources have been identified within the south eastern Senegal region, including the Massawa, Golouma, Makabingui and Mako
projects, along with the Company’s own Sabodala gold mine. With exploration work completed to date and the prior exploration success seen in the area Management believes there is a reasonable basis to anticipate
future resource to reserve conversion.
6. Key assumptions: This forecast financial information is based on the following material assumptions for 2016: gold price: $1,100 per ounce; Brent oil:$40/barrel; Euro:USD exchange rate of 1.1:1; USD:CAD exchange rate
of 0.7:1. Other important assumptions include: any political events are not expected to impact operations, including movement of people, supplies and gold shipments; grades and recoveries will remain consistent with the
life-of-mine plan to achieve the forecast gold production; and no unplanned delays in or interruption of scheduled production.
7. To better align costs with industry peers, during the first quarter 2016 the Company began to present CSR Expense and Regional Administration Costs separately from Corporate Administration Expense. The Company's
2016 guidance has been updated to reflect this change in accounting presentation.
8. Excludes capitalized deferred stripping costs, included in mine production costs.
9. 22,500 ounces of production are to be sold to Franco-Nevada at 20% of the spot gold price.
10. This production profile is based on existing proven and probable reserves only from the Sabodala mining license as disclosed in Teranga Gold’s December Quarter and Year-end 2015 Report accessible on the Company's
website at www.terangagold.com.
11. Cash flow is the Life of Mine net cash flow based on the Company’s most recent NI 43-101 Technical Report (“43-101 plan”) filed in March 2016, before income taxes, interest, debt repayments, closure costs, dividends
and working capital.
12. There have been no revisions to the resource models for 2015, except for adjustments due to mining depletion and minor revisions to Niakafiri Main, Niakafiri SW, Maki Medina and Diadiako. For estimating 2015 Mineral
Resources, Teranga has implemented a new reporting procedure, which includes the use of open pit shells to constrain open pit resources and reporting underground resources separately. For reporting of open pit Mineral
Resources, open pit shells were produced for each of the resource models using Whittle open pit optimization software. Only classified blocks greater than or equal to the open pit cut-off grades and within the open pit
shells were reported. This is in compliance with the CIM (2014) resource definition requirement of “reasonable prospects for eventual economic extraction”. For reporting of underground Mineral Resources, only classified
blocks greater than or equal to the underground cut-off grade outside of the open pit shells were reported. This is in compliance with CIM (2014) resource definition requirements. In addition, Deswik Stope Optimizer
software was used to generate wireframe models to constrain blocks satisfying minimum size and continuity criteria, which were used for reporting Sabodala underground Mineral Resources. The significant change
between the Mineral Resources reported for 2014 and 2015 is due to this new reporting procedure, where the 2015 year end Mineral Resources have been constrained using open pit shells along with revised gold cut-off
grades for both open pit and underground resources. Previously classified Mineral Resources that do not satisfy the revised reporting criteria for 2015 have been excluded, however, remain in the block models as
mineralized material.
31. Trish Moran, Head of Investor Relations
Telephone: +1.416.607.4507
Email: investor@terangagold.com
TSX:TGZ / ASX:TGZ
121 King Street West, Suite 2600
Toronto, ON M5H 3T9
www.terangagold.com