Download to read offline


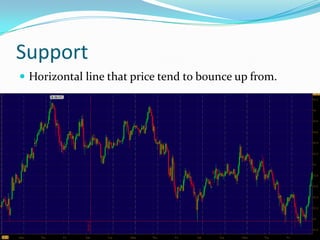
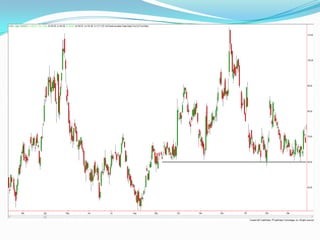
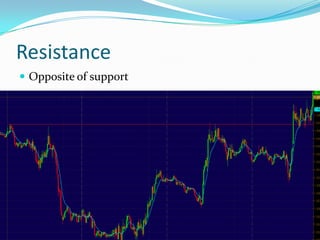
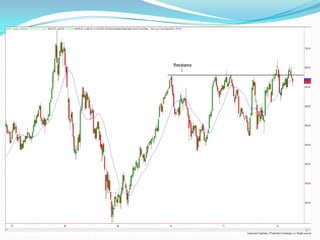
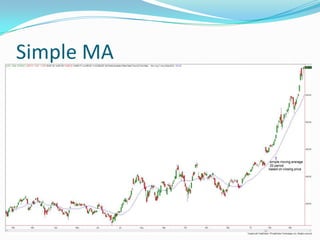
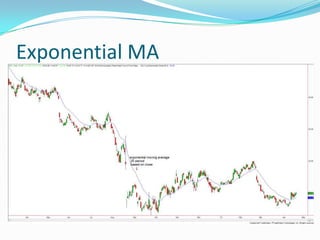
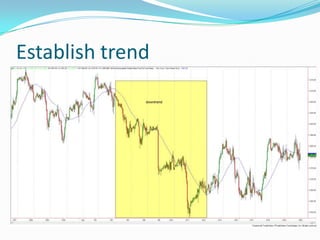
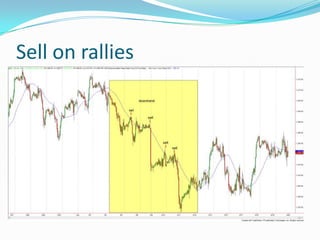

This document discusses technical analysis concepts like support and resistance levels, which are horizontal price levels that prices tend to bounce off of within a few cents. Support levels are prices that tend to bounce up from, while resistance levels are prices that are difficult to break above. Moving averages are popular indicators that are calculated based on past closing prices and can help establish trends to identify buy and sell opportunities when prices reach support or resistance levels.


