Download to read offline


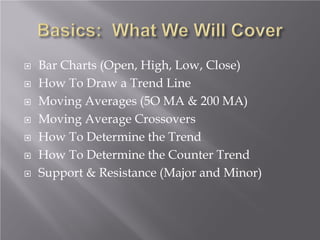
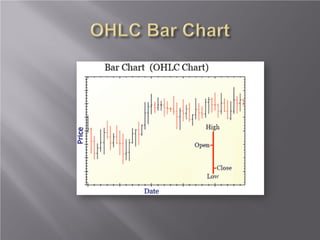
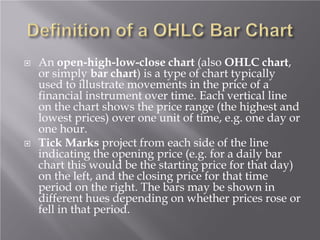

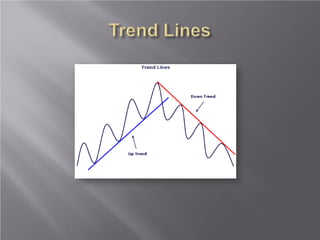
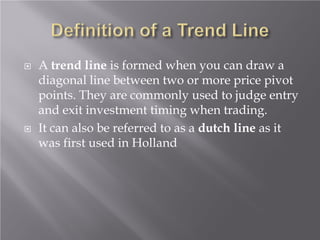

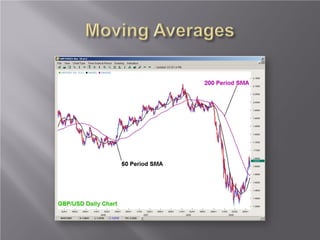


This document provides an overview of technical analysis concepts for trading eMini futures, including: 1) Bar charts that show the daily open, high, low, and close prices visually; 2) Trend lines drawn between pivot points to judge entry and exit times; 3) Moving averages, especially the 50-day and 200-day averages, that smooth price data and their crossovers can signal trend changes; 4) How to determine the overall trend and counter-trend using techniques like trend lines and moving averages.


