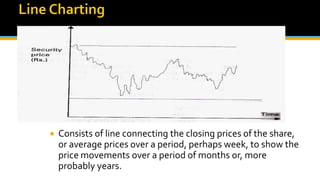
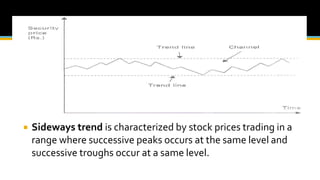
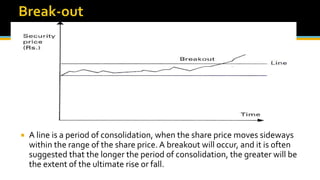
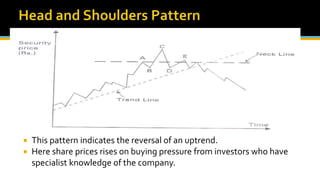
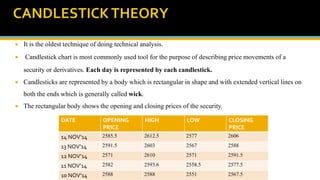
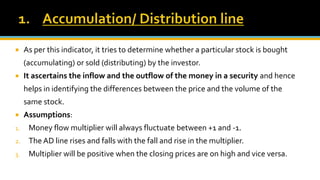
The document discusses various technical analysis methods used to analyze securities including fundamental analysis and technical analysis. Technical analysis uses historical market data like prices and volumes rather than a company's financials. Specific technical analysis techniques covered include chart patterns, trends, resistance and support levels, candlestick charts, moving averages, indicators like relative strength index and on-balance volume. Advantages and limitations of technical analysis are also presented.


![Formula for doing the same is
Money flow multiplier = [(close-low)-(high-close)]/(high-low)
Taking first data we have,
(821.00-814.50)-(834.00-821.00)/(834.00-814.50)
= - 0.34
MF volume = MF multiplier*volume
= 346600 * -0.34= 117844
Accumulation-distribution line = prev. ADL * current period’s MF volume
= 1* 117844
= 117844
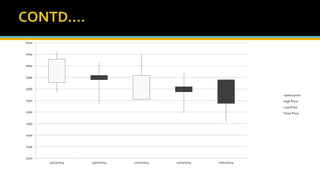
Date High Low close MF multiplier volume MF volume Accu-dist line
10nov 2014 834.00 814.50 821.00 - 0.34 346600 -117844 117844
11nov 2014 826.50 795.82 796.50 -0.95 471400 -447830 -329986
12nov 2014 806.00 785.50 796.50 0.073 406000 29638 -300348
13nov 2014 807.50 775.00 785.50 -0.35 592200 -207270 -807966
14nov 2014 797.50 783.50 791.50 0.14 438500 61390 -746576](https://image.slidesharecdn.com/technicalanalysis-191003100941/85/Technical-analysis-23-320.jpg)