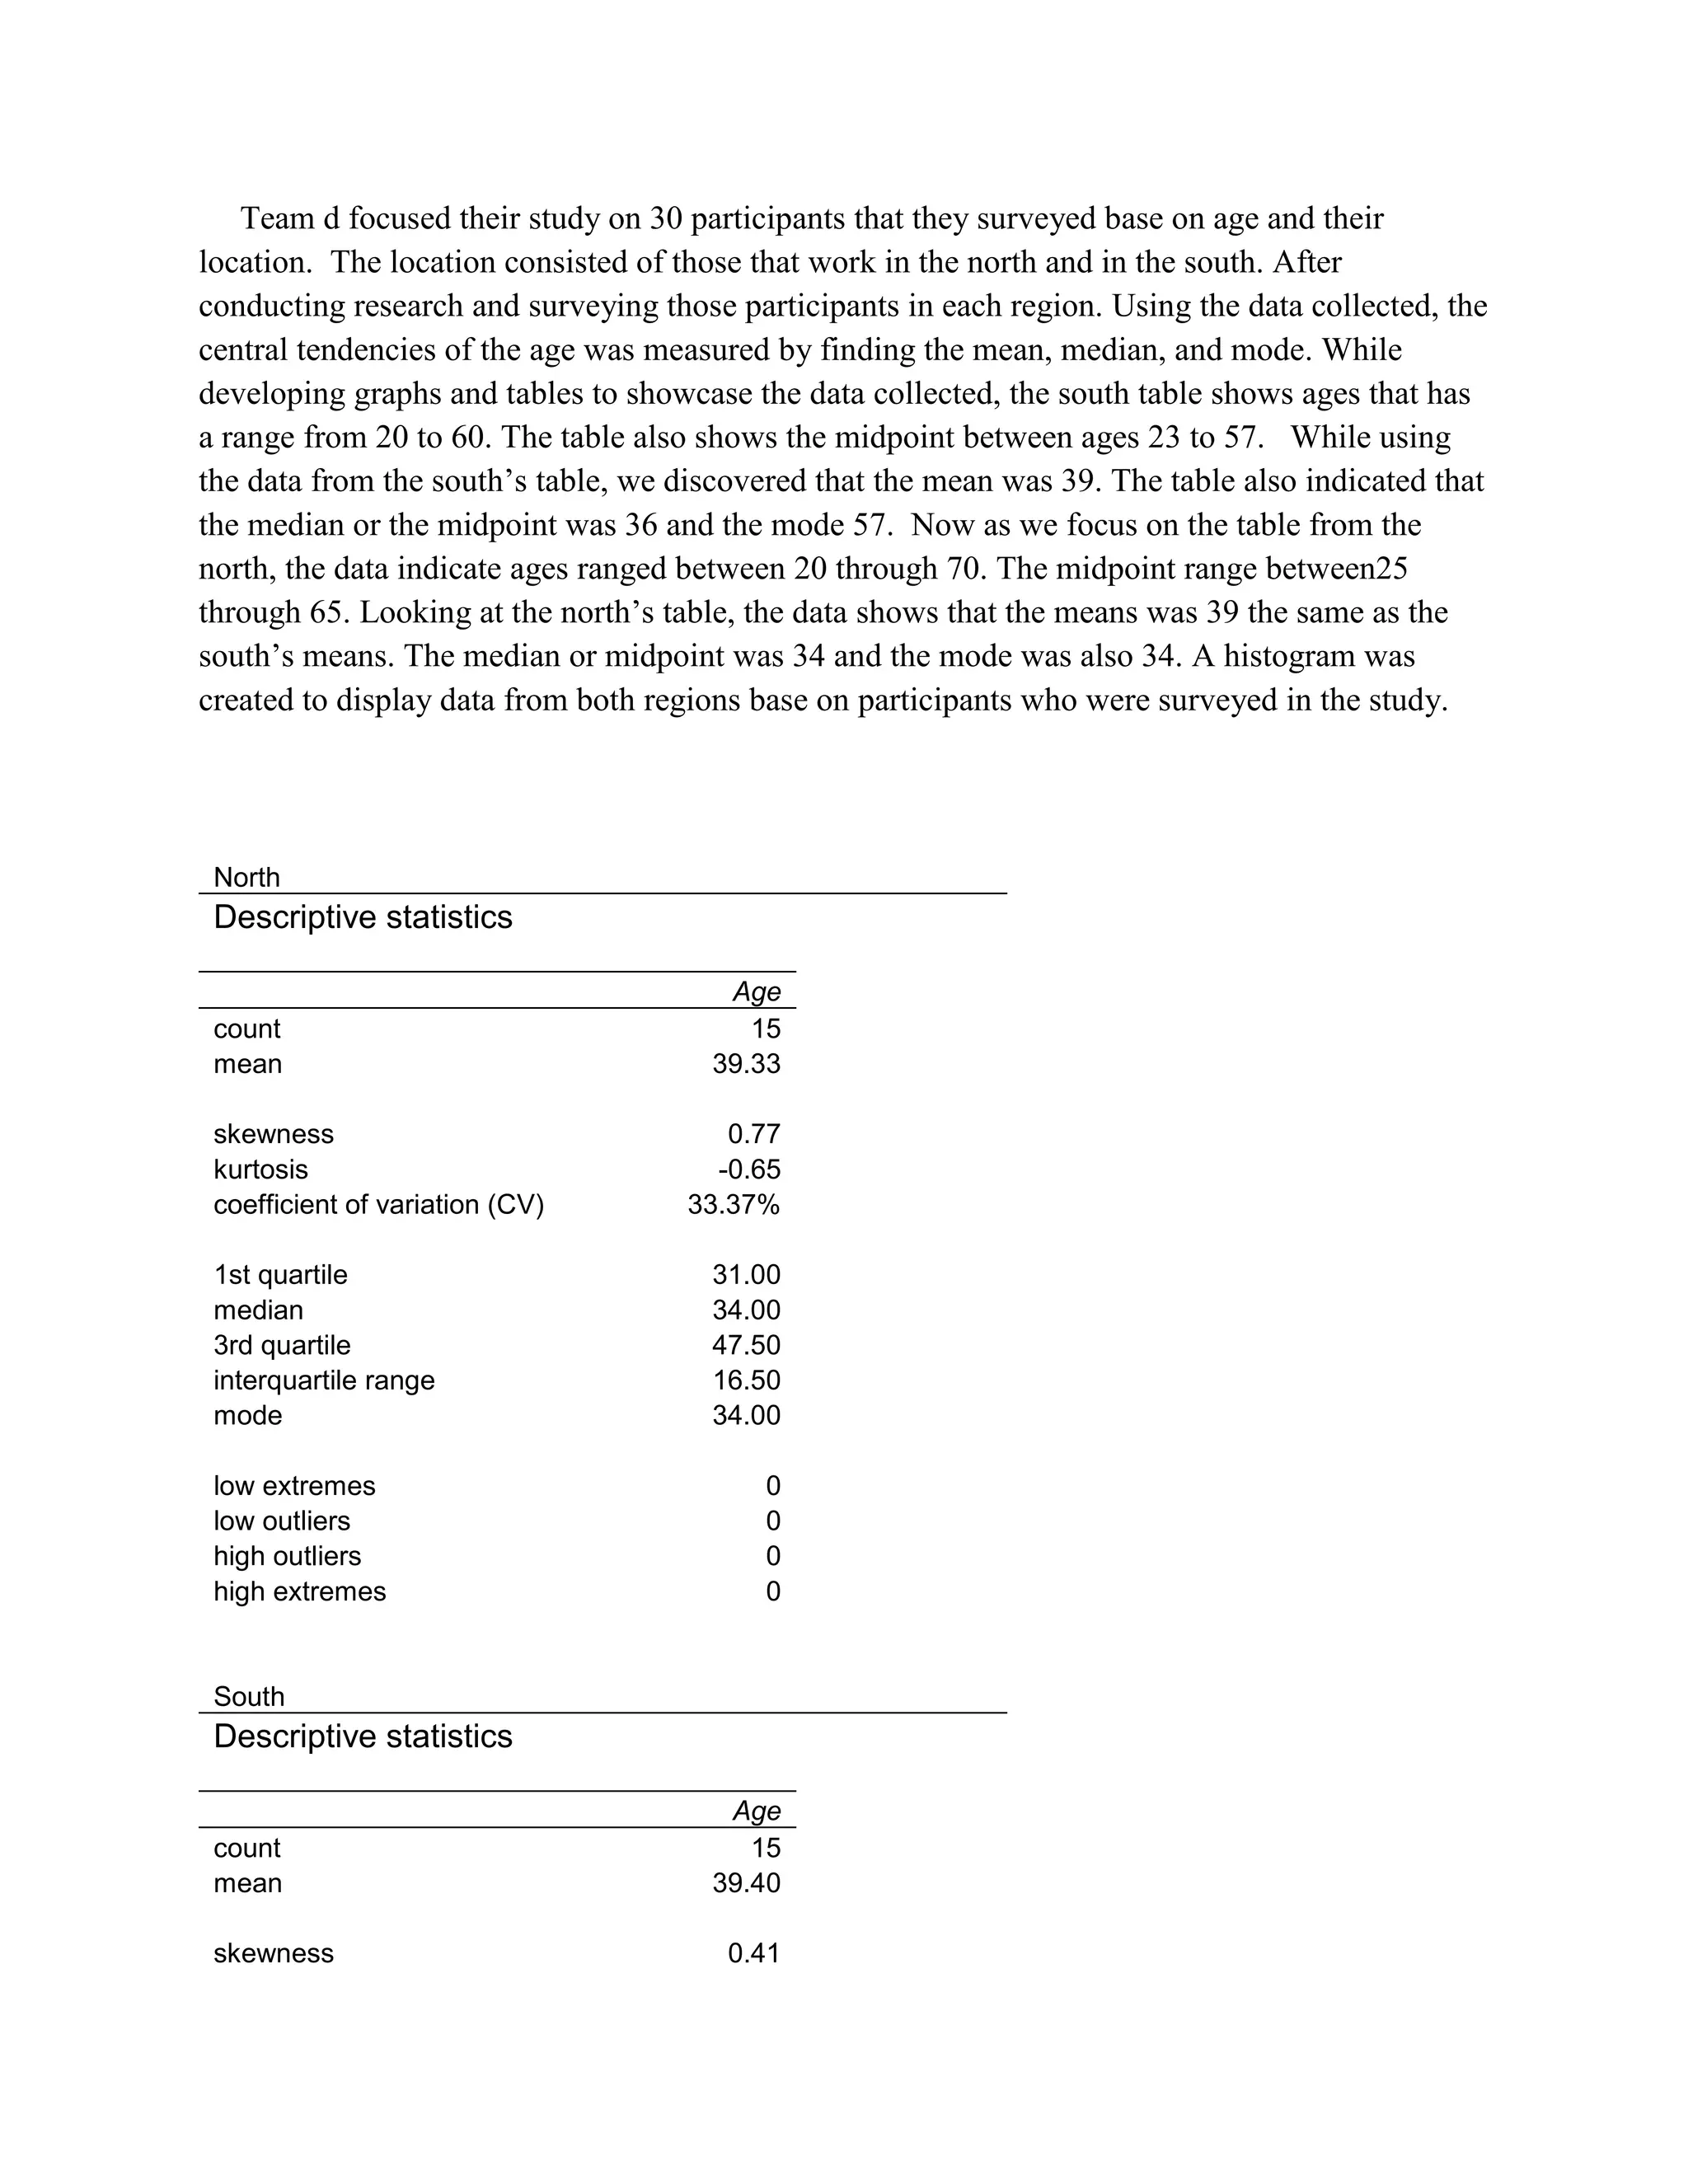
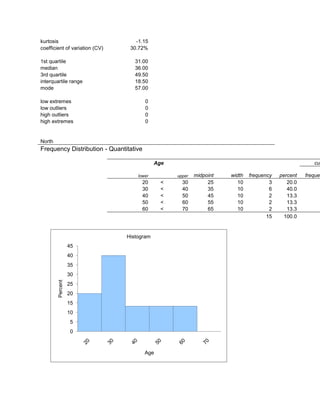
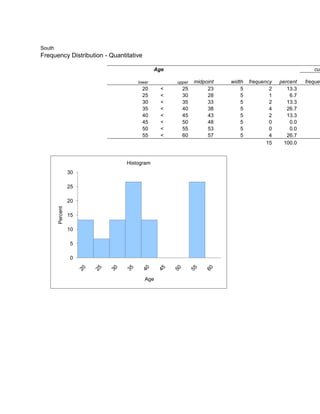
Team d focused their study on 30 participants that they surveyed base on age and their
location. The location consisted of those that work in the north and in the south. After
conducting research and surveying those participants in each region. Using the data collected, the
central tendencies of the age was measured by finding the mean, median, and mode. While
developing graphs and tables to showcase the data collected, the south table shows ages that has
a range from 20 to 60. The table also shows the midpoint between ages 23 to 57. While using
the data from the south’s table, we discovered that the mean was 39. The table also indicated that
the median or the midpoint was 36 and the mode 57. Now as we focus on the table from the
north, the data indicate ages ranged between 20 through 70. The midpoint range between25
through 65. Looking at the north’s table, the data shows that the means was 39 the same as the
south’s means. The median or midpoint was 34 and the mode was also 34. A histogram was
created to display data from both regions base on participants who were surveyed in the study.


 North
 Descriptive statistics

                                        Age
 count                                    15
 mean                                  39.33

 skewness                               0.77
 kurtosis                              -0.65
 coefficient of variation (CV)       33.37%

 1st quartile                          31.00
 median                                34.00
 3rd quartile                          47.50
 interquartile range                   16.50
 mode                                  34.00

 low extremes                              0
 low outliers                              0
 high outliers                             0
 high extremes                             0


 South
 Descriptive statistics

                                        Age
 count                                    15
 mean                                  39.40

 skewness                               0.41
kurtosis                           -1.15
coefficient of variation (CV)    30.72%

1st quartile                       31.00
median                             36.00
3rd quartile                       49.50
interquartile range                18.50
mode                               57.00

low extremes                            0
low outliers                            0
high outliers                           0
high extremes                           0


North
Frequency Distribution - Quantitative

                                            Age                                                       cum

                                    lower         upper   midpoint   width   frequency   percent   frequen
                                      20      <     30         25       10           3      20.0
                                      30      <     40         35       10           6      40.0
                                      40      <     50         45       10           2      13.3
                                      50      <     60         55       10           2      13.3
                                      60      <     70         65       10           2      13.3
                                                                                    15    100.0


                                Histogram
                  45
                  40
                  35
                  30
        Percent


                  25
                  20
                  15
                  10
                   5
                   0


                                        Age
South
Frequency Distribution - Quantitative

                                           Age                                                        cum

                                   lower          upper   midpoint   width   frequency   percent   frequen
                                     20       <     25         23        5           2      13.3
                                     25       <     30         28        5           1       6.7
                                     30       <     35         33        5           2      13.3
                                     35       <     40         38        5           4      26.7
                                     40       <     45         43        5           2      13.3
                                     45       <     50         48        5           0       0.0
                                     50       <     55         53        5           0       0.0
                                     55       <     60         57        5           4      26.7
                                                                                    15    100.0


                               Histogram
                  30

                  25

                  20
        Percent


                  15

                  10

                   5

                   0


                                        Age

Team d revised

  • 1.
    Team d focusedtheir study on 30 participants that they surveyed base on age and their location. The location consisted of those that work in the north and in the south. After conducting research and surveying those participants in each region. Using the data collected, the central tendencies of the age was measured by finding the mean, median, and mode. While developing graphs and tables to showcase the data collected, the south table shows ages that has a range from 20 to 60. The table also shows the midpoint between ages 23 to 57. While using the data from the south’s table, we discovered that the mean was 39. The table also indicated that the median or the midpoint was 36 and the mode 57. Now as we focus on the table from the north, the data indicate ages ranged between 20 through 70. The midpoint range between25 through 65. Looking at the north’s table, the data shows that the means was 39 the same as the south’s means. The median or midpoint was 34 and the mode was also 34. A histogram was created to display data from both regions base on participants who were surveyed in the study. North Descriptive statistics Age count 15 mean 39.33 skewness 0.77 kurtosis -0.65 coefficient of variation (CV) 33.37% 1st quartile 31.00 median 34.00 3rd quartile 47.50 interquartile range 16.50 mode 34.00 low extremes 0 low outliers 0 high outliers 0 high extremes 0 South Descriptive statistics Age count 15 mean 39.40 skewness 0.41
  • 2.
    kurtosis -1.15 coefficient of variation (CV) 30.72% 1st quartile 31.00 median 36.00 3rd quartile 49.50 interquartile range 18.50 mode 57.00 low extremes 0 low outliers 0 high outliers 0 high extremes 0 North Frequency Distribution - Quantitative Age cum lower upper midpoint width frequency percent frequen 20 < 30 25 10 3 20.0 30 < 40 35 10 6 40.0 40 < 50 45 10 2 13.3 50 < 60 55 10 2 13.3 60 < 70 65 10 2 13.3 15 100.0 Histogram 45 40 35 30 Percent 25 20 15 10 5 0 Age
  • 3.
    South Frequency Distribution -Quantitative Age cum lower upper midpoint width frequency percent frequen 20 < 25 23 5 2 13.3 25 < 30 28 5 1 6.7 30 < 35 33 5 2 13.3 35 < 40 38 5 4 26.7 40 < 45 43 5 2 13.3 45 < 50 48 5 0 0.0 50 < 55 53 5 0 0.0 55 < 60 57 5 4 26.7 15 100.0 Histogram 30 25 20 Percent 15 10 5 0 Age