Download to read offline
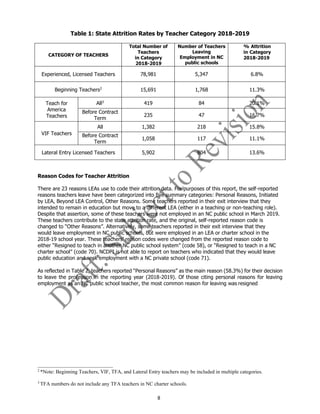
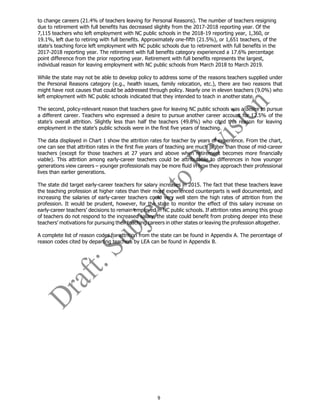
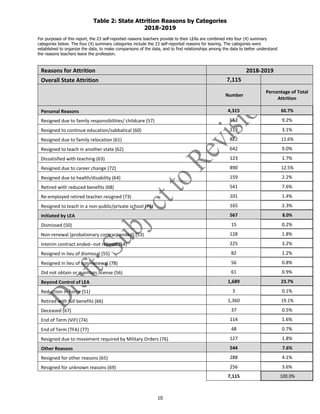
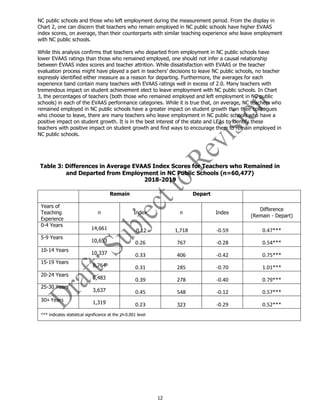
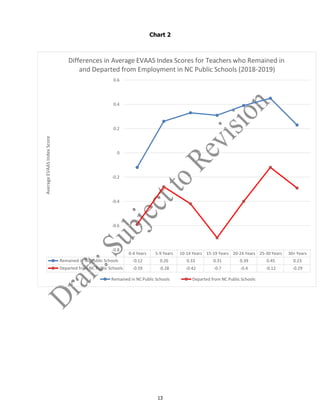
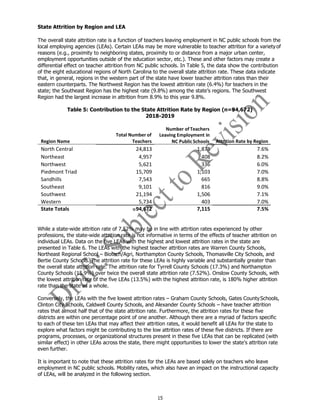
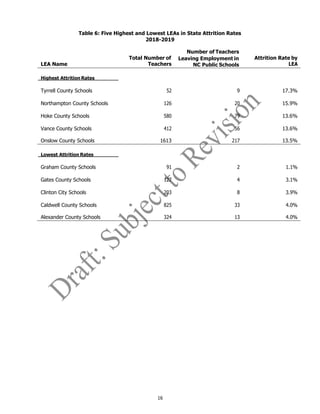
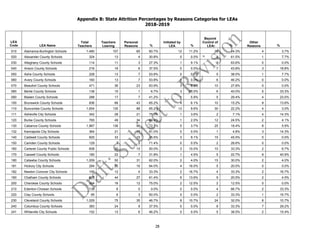
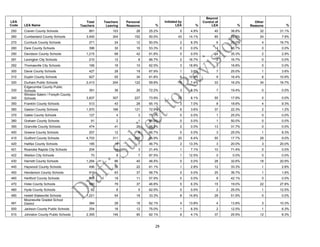
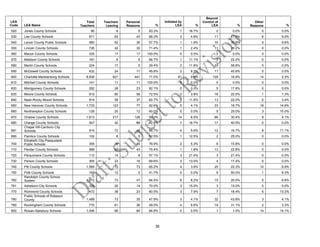
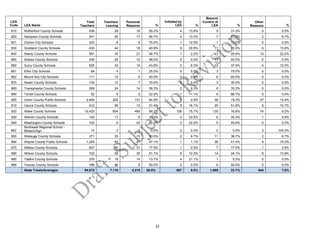
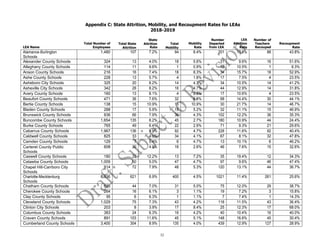
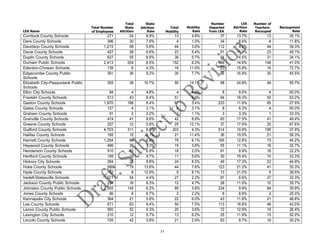
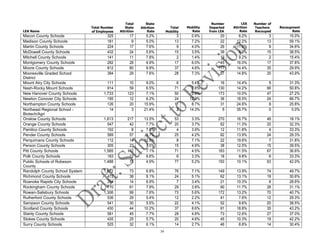
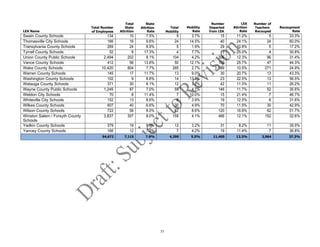
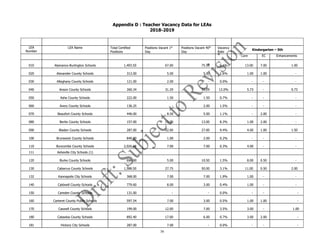
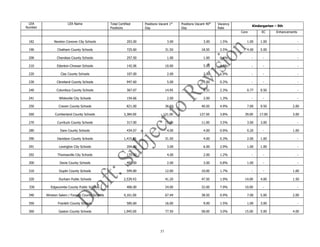
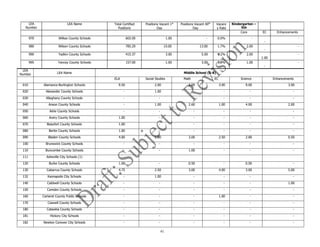
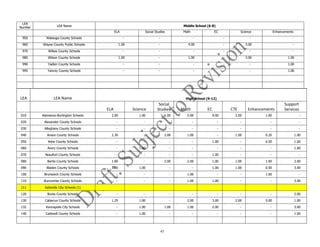

The report analyzes teacher attrition data in North Carolina between March 2018 and March 2019. It finds that the overall state teacher attrition rate was 7.5%, slightly lower than the previous year. However, attrition rates were higher for certain groups like beginning teachers (11.3%) and lateral entry teachers (13.6%). The majority (58.3%) of teachers who left cited personal reasons like retirement. On average, teachers who left had lower effectiveness ratings than teachers who stayed. Attrition rates varied significantly between different local education agencies across the state.


