TABLA DE RESULTADOS DE LA ENCUESTA PARA PADRES DE FAMILIA
•
0 likes•578 views

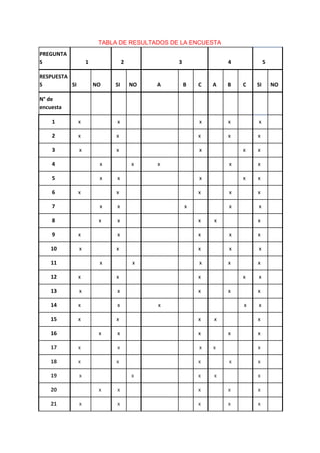
Resultados de la encuesta realizada a los padres de familia del grado 11-2 de la Institución Educativa liceo Departamental
Report
Share
Report
Share
Download to read offline

Recommended
Encuestas 11 - 3
The document contains the results of a survey with 40 responses. It includes a table with the responses to 5 questions - whether they answered Yes or No for the first 3 questions, and which of 3 options (A, B or C) they selected for questions 4 and 5. For all 40 surveys, across all 5 questions, the response was the same (all Yes for the first 3, and all A for the last 2).
Tabla de resultados de la encuesta
The document contains the results of a survey with 40 responses. It includes a table with the responses to 5 questions - yes or no for the first 3 questions and options A, B, or C for the last 2. All respondents answered yes to questions 1-3 and selected options A for question 4 and B for question 5, with no variation in the responses.
Tabla de resultados de la encuesta (1)
tabla de resultados de la encuesta realizada por estudiantes del grado 11-1 de la institución educativa liceo departamental en santiago de cali / colombia
Tabla de resultados de la encuesta
The document contains the results of a survey with 40 respondents. It includes a table showing the responses to 5 questions - whether they answered Yes or No for the first two questions, and their choice (A, B, or C) for the remaining three multiple choice questions. It also includes two charts, one showing the percentage of Yes/No answers for each question, and another showing the percentage breakdown of responses for the multiple choice questions.
Segura (1)
The document contains a table summarizing the results of a survey with 40 respondents. It shows their responses to 5 questions which could be answered with Yes/No, or selecting options A, B, C. For most respondents the answers were all Yes for questions 1-3 and options A for questions 4-5, but a few respondents chose other options for some questions.
Tabla de resultados
The document displays the results of a survey with 5 questions in Spanish with possible answers of Yes, No, A, B, C for questions 1-4 and Yes, No for question 5. The responses of 40 survey participants are shown with all answering Yes to questions 1-4 and half answering Yes and half No to question 5.
Tabla de resultados de la encuesta 11 5
The document contains the results of a survey with 40 responses. It shows the answers to 5 questions with options of Yes/No, A/B/C, and A/B/C/SI/NO. All 40 surveys had the same answers of Yes for questions 1 and 2, A for question 3, B for question 4, and No for question 5.
Tabla de resultados de la encuesta 11 5
The document contains the results of a survey with 40 responses. It shows that for each of the 5 questions, all 40 respondents answered Yes for questions 1, 3 and 5, and No for question 2. For question 4, 38 respondents chose options A and B, and 2 chose option C.
Tabla de resultados de la encuesta (1)
The document displays the results of a survey with 5 questions in table format. It shows the responses to each question as either yes or no and lists the number of the survey for 36 respondents, with totals provided at the bottom for each response across all questions and respondents.
Tabla de resultados de la encuesta
The document displays the results of a survey with 5 questions in Spanish. It includes responses from 40 survey participants, showing that for each question, most participants answered "Yes", "A", or "C", while some answered "No", "B", or "C". The totals at the bottom summarize that across all participants, most answered "Yes", "A", or "C" to each question.
Tabla de resultados de la encuesta (2)
The document shows the results of a survey with 5 questions and responses from 40 participants. For each question, the responses were either yes or no, or options A, B, C. All 40 participants answered si to every question.
Tabla de resultados de la encuesta (1)
The document contains the results of a survey with 5 questions. For question 1, 35 respondents answered Yes and 5 answered No. For question 2, 40 respondents answered A, 40 answered B, and 40 answered C. The majority of respondents for question 3 answered No. The table also includes a number for each of the 40 surveys conducted.
Tabla de resultados de la encuesta periodistas 11-6 (1)
The document displays the results of a survey with 40 respondents. It includes their responses to 5 questions which could be answered with Yes/No or options A, B, C. All respondents answered Yes to questions 1-3 and selected options A for questions 2 and 3.
Comparto 'encuesta' contigo
This document contains the results of a survey with 40 respondents. It shows their responses to 5 questions which could be answered with Yes/No, or with options A, B, or C. For all questions, all respondents answered the same way, with either Yes, No, A, B, or C. It also totals the number of responses for each answer option across all questions.
Tabla de resultados de la encuesta
The document displays the results of a survey with 40 responses. It shows the answers to 5 questions which could be yes/no, or multiple choice options A, B or C. All respondents answered the same for each question, with either yes for questions 1-3, or the multiple choice options for questions 4-5. The totals at the bottom summarize that for question 1 there were 21 yes responses, and for question 2 there were 19 yes responses, and so on.
Tabla de resultados de la encuesta
The document displays the results of a survey with 40 responses. It shows the answers to 5 questions which could be yes/no, or multiple choice options A, B or C. All respondents answered the same for each question, with either yes for questions 1-3, or the multiple choice options for questions 4-5. The totals at the bottom summarize the overall responses.
Resultados de la encuesta cts (1)
This document contains the results of a survey with 5 questions and responses from 40 participants. For each question, the responses were either Yes or No, or one of three options A, B, or C. All 40 participants answered Yes to questions 1, 3 and 4, and answered options A, B, and C for questions 2 and 5.
Encuesta
This document contains the results of a survey with 40 respondents. It shows their responses to 5 questions which could be answered with Yes/No, or with options A, B, C. For all questions, all respondents answered the same for each option.
Tabla de resultados de la encuesta convertido
The document shows the results of a survey with 5 questions and responses from 40 participants. For each question, the responses are categorized as yes/no, or options A B C. All participants answered yes to questions 1, 3 and 5, and selected options A and C for questions 2 and 4. The totals at the bottom summarize the response counts across all participants.
Tabla de resultados de la encuesta tecnologia
The document displays the results of a survey with 5 questions and multiple choice answers. All 40 respondents answered Yes to questions 1, 3 and 4, and No to question 5. For questions 2, the responses were evenly split between Yes and No. The table records the responses for each of the 40 survey participants.
Tabla de resultados de la encuesta
This document contains the results of a survey with 40 respondents. It shows their responses to 5 questions which could be answered with Yes/No, or with options A, B, or C. For all questions, every respondent answered the same way, with either Yes, A, or C as their response.
Tabla de resultados de la encuesta
The document displays the results of a survey with 40 responses. It shows the answers to 5 questions which could be yes/no, or multiple choice options A, B or C. All 40 respondents answered yes to questions 1, 3 and 5, and answered the multiple choice options as displayed in the totals row.
Derechos de autor en Colombia
Los derechos de autor protegen las obras literarias y artísticas de sus creadores, incluyendo libros, música, películas, programas informáticos y más. Los derechos de autor otorgan a los autores derechos morales y patrimoniales sobre sus obras. La infracción de los derechos de autor puede resultar en multas y penas de prisión.
Trabajo (distribución de frecuencias) 1
Este documento presenta los pasos para realizar un análisis de frecuencias de una muestra de datos numéricos. Define la cantidad de la muestra, calcula el número de clases o intervalos utilizando una fórmula, y determina el rango y ancho de clase para organizar los datos en tablas de frecuencias absolutas y acumuladas.
Taller distribucion de frecuencias
Este documento proporciona instrucciones paso a paso para crear una tabla de frecuencias e histogramas a partir de un conjunto de datos. Incluye instrucciones para contar datos, calcular el número de intervalos, determinar el ancho de cada intervalo, y generar una tabla con intervalos, frecuencias absolutas y relativas.
Respuesta si, no (A la encuesta realizada por los padres de familia)
Este documento contiene una tabla con 3 filas y 4 columnas que parecen contener números aleatorios. La tabla no proporciona contexto o explicación sobre su propósito o significado.
Encuesta para padres de familia sobre la contaminación ambiental
Este documento presenta un cuestionario de 5 preguntas que busca determinar el grado de conciencia ambiental de las personas en la ciudad de Cali. El cuestionario incluye preguntas sobre la gestión de desechos sólidos por parte de las empresas de aseo, el significado de desechos sólidos, quién es responsable de la contaminación ambiental, el enfoque CTS y si la contaminación es nociva para la salud.
More Related Content
What's hot
Tabla de resultados de la encuesta (1)
The document displays the results of a survey with 5 questions in table format. It shows the responses to each question as either yes or no and lists the number of the survey for 36 respondents, with totals provided at the bottom for each response across all questions and respondents.
Tabla de resultados de la encuesta
The document displays the results of a survey with 5 questions in Spanish. It includes responses from 40 survey participants, showing that for each question, most participants answered "Yes", "A", or "C", while some answered "No", "B", or "C". The totals at the bottom summarize that across all participants, most answered "Yes", "A", or "C" to each question.
Tabla de resultados de la encuesta (2)
The document shows the results of a survey with 5 questions and responses from 40 participants. For each question, the responses were either yes or no, or options A, B, C. All 40 participants answered si to every question.
Tabla de resultados de la encuesta (1)
The document contains the results of a survey with 5 questions. For question 1, 35 respondents answered Yes and 5 answered No. For question 2, 40 respondents answered A, 40 answered B, and 40 answered C. The majority of respondents for question 3 answered No. The table also includes a number for each of the 40 surveys conducted.
Tabla de resultados de la encuesta periodistas 11-6 (1)
The document displays the results of a survey with 40 respondents. It includes their responses to 5 questions which could be answered with Yes/No or options A, B, C. All respondents answered Yes to questions 1-3 and selected options A for questions 2 and 3.
Comparto 'encuesta' contigo
This document contains the results of a survey with 40 respondents. It shows their responses to 5 questions which could be answered with Yes/No, or with options A, B, or C. For all questions, all respondents answered the same way, with either Yes, No, A, B, or C. It also totals the number of responses for each answer option across all questions.
Tabla de resultados de la encuesta
The document displays the results of a survey with 40 responses. It shows the answers to 5 questions which could be yes/no, or multiple choice options A, B or C. All respondents answered the same for each question, with either yes for questions 1-3, or the multiple choice options for questions 4-5. The totals at the bottom summarize that for question 1 there were 21 yes responses, and for question 2 there were 19 yes responses, and so on.
Tabla de resultados de la encuesta
The document displays the results of a survey with 40 responses. It shows the answers to 5 questions which could be yes/no, or multiple choice options A, B or C. All respondents answered the same for each question, with either yes for questions 1-3, or the multiple choice options for questions 4-5. The totals at the bottom summarize the overall responses.
Resultados de la encuesta cts (1)
This document contains the results of a survey with 5 questions and responses from 40 participants. For each question, the responses were either Yes or No, or one of three options A, B, or C. All 40 participants answered Yes to questions 1, 3 and 4, and answered options A, B, and C for questions 2 and 5.
Encuesta
This document contains the results of a survey with 40 respondents. It shows their responses to 5 questions which could be answered with Yes/No, or with options A, B, C. For all questions, all respondents answered the same for each option.
Tabla de resultados de la encuesta convertido
The document shows the results of a survey with 5 questions and responses from 40 participants. For each question, the responses are categorized as yes/no, or options A B C. All participants answered yes to questions 1, 3 and 5, and selected options A and C for questions 2 and 4. The totals at the bottom summarize the response counts across all participants.
Tabla de resultados de la encuesta tecnologia
The document displays the results of a survey with 5 questions and multiple choice answers. All 40 respondents answered Yes to questions 1, 3 and 4, and No to question 5. For questions 2, the responses were evenly split between Yes and No. The table records the responses for each of the 40 survey participants.
Tabla de resultados de la encuesta
This document contains the results of a survey with 40 respondents. It shows their responses to 5 questions which could be answered with Yes/No, or with options A, B, or C. For all questions, every respondent answered the same way, with either Yes, A, or C as their response.
Tabla de resultados de la encuesta
The document displays the results of a survey with 40 responses. It shows the answers to 5 questions which could be yes/no, or multiple choice options A, B or C. All 40 respondents answered yes to questions 1, 3 and 5, and answered the multiple choice options as displayed in the totals row.
What's hot (14)
Tabla de resultados de la encuesta periodistas 11-6 (1)
Tabla de resultados de la encuesta periodistas 11-6 (1)
More from JSebastianPinto
Derechos de autor en Colombia
Los derechos de autor protegen las obras literarias y artísticas de sus creadores, incluyendo libros, música, películas, programas informáticos y más. Los derechos de autor otorgan a los autores derechos morales y patrimoniales sobre sus obras. La infracción de los derechos de autor puede resultar en multas y penas de prisión.
Trabajo (distribución de frecuencias) 1
Este documento presenta los pasos para realizar un análisis de frecuencias de una muestra de datos numéricos. Define la cantidad de la muestra, calcula el número de clases o intervalos utilizando una fórmula, y determina el rango y ancho de clase para organizar los datos en tablas de frecuencias absolutas y acumuladas.
Taller distribucion de frecuencias
Este documento proporciona instrucciones paso a paso para crear una tabla de frecuencias e histogramas a partir de un conjunto de datos. Incluye instrucciones para contar datos, calcular el número de intervalos, determinar el ancho de cada intervalo, y generar una tabla con intervalos, frecuencias absolutas y relativas.
Respuesta si, no (A la encuesta realizada por los padres de familia)
Este documento contiene una tabla con 3 filas y 4 columnas que parecen contener números aleatorios. La tabla no proporciona contexto o explicación sobre su propósito o significado.
Encuesta para padres de familia sobre la contaminación ambiental
Este documento presenta un cuestionario de 5 preguntas que busca determinar el grado de conciencia ambiental de las personas en la ciudad de Cali. El cuestionario incluye preguntas sobre la gestión de desechos sólidos por parte de las empresas de aseo, el significado de desechos sólidos, quién es responsable de la contaminación ambiental, el enfoque CTS y si la contaminación es nociva para la salud.
Marco Teorico Circuito Mixto
Este documento describe los circuitos mixtos. Un circuito mixto es una combinación de elementos conectados en serie y en paralelo. Estos circuitos pueden reducirse resolviendo primero los elementos en serie y luego los en paralelo para calcular un circuito único. Un circuito mixto se compone de circuitos elementales en serie y paralelo acoplados entre sí, y ninguno de sus valores parciales de tensión, intensidad o potencia pueden ser mayores que los valores totales correspondientes.
TRABAJO DE TECNOLOGÍA 2 PERIODO -1
Este documento describe el mecanismo de biela-manivela, que convierte un movimiento circular en lineal o viceversa. Explica que se compone de una manivela unida a un punto fijo y una biela unida a la manivela y a un pistón que se mueve linealmente. Describe cómo funciona transformando el movimiento giratorio del eje en uno circular en la manivela y luego lineal alternativo en la biela. También cubre consideraciones de diseño como la longitud de la manivela y biela.
TRABAJO DE TECNOLOGÍA 2 PERIODO
El documento presenta información sobre levas. Resume que una leva es un elemento mecánico sujeto a un eje en un punto que no es su centro geométrico. Existen dos tipos de seguidores: de traslación y de rotación. Las levas se pueden clasificar por su naturaleza, como levas de revolución o de traslación. Finalmente, detalla aspectos del diseño de levas como el tipo de leva y seguidor, y consideraciones geométricas, dinámicas, ambientales y económicas.
More from JSebastianPinto (11)
Respuesta si, no (A la encuesta realizada por los padres de familia)
Respuesta si, no (A la encuesta realizada por los padres de familia)
Encuesta para padres de familia sobre la contaminación ambiental
Encuesta para padres de familia sobre la contaminación ambiental
Recently uploaded
How to Add Chatter in the odoo 17 ERP Module
In Odoo, the chatter is like a chat tool that helps you work together on records. You can leave notes and track things, making it easier to talk with your team and partners. Inside chatter, all communication history, activity, and changes will be displayed.
RPMS TEMPLATE FOR SCHOOL YEAR 2023-2024 FOR TEACHER 1 TO TEACHER 3
RPMS Template 2023-2024 by: Irene S. Rueco
Top five deadliest dog breeds in America
Thinking of getting a dog? Be aware that breeds like Pit Bulls, Rottweilers, and German Shepherds can be loyal and dangerous. Proper training and socialization are crucial to preventing aggressive behaviors. Ensure safety by understanding their needs and always supervising interactions. Stay safe, and enjoy your furry friends!
Exploiting Artificial Intelligence for Empowering Researchers and Faculty, In...
Exploiting Artificial Intelligence for Empowering Researchers and Faculty, In...Dr. Vinod Kumar Kanvaria
Exploiting Artificial Intelligence for Empowering Researchers and Faculty,
International FDP on Fundamentals of Research in Social Sciences
at Integral University, Lucknow, 06.06.2024
By Dr. Vinod Kumar KanvariaANATOMY AND BIOMECHANICS OF HIP JOINT.pdf
it describes the bony anatomy including the femoral head , acetabulum, labrum . also discusses the capsule , ligaments . muscle that act on the hip joint and the range of motion are outlined. factors affecting hip joint stability and weight transmission through the joint are summarized.
Digital Artifact 1 - 10VCD Environments Unit
Digital Artifact 1 - 10VCD Environments Unit - NGV Pavilion Concept Design
ISO/IEC 27001, ISO/IEC 42001, and GDPR: Best Practices for Implementation and...
Denis is a dynamic and results-driven Chief Information Officer (CIO) with a distinguished career spanning information systems analysis and technical project management. With a proven track record of spearheading the design and delivery of cutting-edge Information Management solutions, he has consistently elevated business operations, streamlined reporting functions, and maximized process efficiency.
Certified as an ISO/IEC 27001: Information Security Management Systems (ISMS) Lead Implementer, Data Protection Officer, and Cyber Risks Analyst, Denis brings a heightened focus on data security, privacy, and cyber resilience to every endeavor.
His expertise extends across a diverse spectrum of reporting, database, and web development applications, underpinned by an exceptional grasp of data storage and virtualization technologies. His proficiency in application testing, database administration, and data cleansing ensures seamless execution of complex projects.
What sets Denis apart is his comprehensive understanding of Business and Systems Analysis technologies, honed through involvement in all phases of the Software Development Lifecycle (SDLC). From meticulous requirements gathering to precise analysis, innovative design, rigorous development, thorough testing, and successful implementation, he has consistently delivered exceptional results.
Throughout his career, he has taken on multifaceted roles, from leading technical project management teams to owning solutions that drive operational excellence. His conscientious and proactive approach is unwavering, whether he is working independently or collaboratively within a team. His ability to connect with colleagues on a personal level underscores his commitment to fostering a harmonious and productive workplace environment.
Date: May 29, 2024
Tags: Information Security, ISO/IEC 27001, ISO/IEC 42001, Artificial Intelligence, GDPR
-------------------------------------------------------------------------------
Find out more about ISO training and certification services
Training: ISO/IEC 27001 Information Security Management System - EN | PECB
ISO/IEC 42001 Artificial Intelligence Management System - EN | PECB
General Data Protection Regulation (GDPR) - Training Courses - EN | PECB
Webinars: https://pecb.com/webinars
Article: https://pecb.com/article
-------------------------------------------------------------------------------
For more information about PECB:
Website: https://pecb.com/
LinkedIn: https://www.linkedin.com/company/pecb/
Facebook: https://www.facebook.com/PECBInternational/
Slideshare: http://www.slideshare.net/PECBCERTIFICATION
বাংলাদেশ অর্থনৈতিক সমীক্ষা (Economic Review) ২০২৪ UJS App.pdf
বাংলাদেশের অর্থনৈতিক সমীক্ষা ২০২৪ [Bangladesh Economic Review 2024 Bangla.pdf] কম্পিউটার , ট্যাব ও স্মার্ট ফোন ভার্সন সহ সম্পূর্ণ বাংলা ই-বুক বা pdf বই " সুচিপত্র ...বুকমার্ক মেনু 🔖 ও হাইপার লিংক মেনু 📝👆 যুক্ত ..
আমাদের সবার জন্য খুব খুব গুরুত্বপূর্ণ একটি বই ..বিসিএস, ব্যাংক, ইউনিভার্সিটি ভর্তি ও যে কোন প্রতিযোগিতা মূলক পরীক্ষার জন্য এর খুব ইম্পরট্যান্ট একটি বিষয় ...তাছাড়া বাংলাদেশের সাম্প্রতিক যে কোন ডাটা বা তথ্য এই বইতে পাবেন ...
তাই একজন নাগরিক হিসাবে এই তথ্য গুলো আপনার জানা প্রয়োজন ...।
বিসিএস ও ব্যাংক এর লিখিত পরীক্ষা ...+এছাড়া মাধ্যমিক ও উচ্চমাধ্যমিকের স্টুডেন্টদের জন্য অনেক কাজে আসবে ...
How to Build a Module in Odoo 17 Using the Scaffold Method
Odoo provides an option for creating a module by using a single line command. By using this command the user can make a whole structure of a module. It is very easy for a beginner to make a module. There is no need to make each file manually. This slide will show how to create a module using the scaffold method.
PCOS corelations and management through Ayurveda.
This presentation includes basic of PCOS their pathology and treatment and also Ayurveda correlation of PCOS and Ayurvedic line of treatment mentioned in classics.
How to Fix the Import Error in the Odoo 17
An import error occurs when a program fails to import a module or library, disrupting its execution. In languages like Python, this issue arises when the specified module cannot be found or accessed, hindering the program's functionality. Resolving import errors is crucial for maintaining smooth software operation and uninterrupted development processes.
Assessment and Planning in Educational technology.pptx
In an education system, it is understood that assessment is only for the students, but on the other hand, the Assessment of teachers is also an important aspect of the education system that ensures teachers are providing high-quality instruction to students. The assessment process can be used to provide feedback and support for professional development, to inform decisions about teacher retention or promotion, or to evaluate teacher effectiveness for accountability purposes.
Recently uploaded (20)
RPMS TEMPLATE FOR SCHOOL YEAR 2023-2024 FOR TEACHER 1 TO TEACHER 3
RPMS TEMPLATE FOR SCHOOL YEAR 2023-2024 FOR TEACHER 1 TO TEACHER 3
Exploiting Artificial Intelligence for Empowering Researchers and Faculty, In...
Exploiting Artificial Intelligence for Empowering Researchers and Faculty, In...
Digital Artefact 1 - Tiny Home Environmental Design
Digital Artefact 1 - Tiny Home Environmental Design
ISO/IEC 27001, ISO/IEC 42001, and GDPR: Best Practices for Implementation and...
ISO/IEC 27001, ISO/IEC 42001, and GDPR: Best Practices for Implementation and...
Liberal Approach to the Study of Indian Politics.pdf
Liberal Approach to the Study of Indian Politics.pdf
বাংলাদেশ অর্থনৈতিক সমীক্ষা (Economic Review) ২০২৪ UJS App.pdf
বাংলাদেশ অর্থনৈতিক সমীক্ষা (Economic Review) ২০২৪ UJS App.pdf
How to Build a Module in Odoo 17 Using the Scaffold Method
How to Build a Module in Odoo 17 Using the Scaffold Method
Pride Month Slides 2024 David Douglas School District
Pride Month Slides 2024 David Douglas School District
Assessment and Planning in Educational technology.pptx
Assessment and Planning in Educational technology.pptx
TABLA DE RESULTADOS DE LA ENCUESTA PARA PADRES DE FAMILIA
- 1. TABLA DE RESULTADOS DE LA ENCUESTA PREGUNTA S 1 2 3 4 5 RESPUESTA S SI NO SI NO A B C A B C SI NO N° de encuesta 1 x x x x x 2 x x x x x 3 x x x x x 4 x x x x x 5 x x x x x 6 x x x x x 7 x x x x x 8 x x x x x 9 x x x x x 10 x x x x x 11 x x x x x 12 x x x x x 13 x x x x x 14 x x x x x 15 x x x x x 16 x x x x x 17 x x x x x 18 x x x x x 19 x x x x x 20 x x x x x 21 x x x x x
- 2. 22 x x x x x 23 x x x x x 24 x x x x x 25 x x x x x 26 x x x x x 27 x x x x x 28 x x x x x 29 x x x x x 30 x x x x x 31 x x x x x 32 x x x x x 33 x x x x x 34 x x x x x 35 x x x x x 36 x x x x x 37 x x x x x 38 x x x x x 39 x x x x x 40 x x x x x TOTAL 24 16 34 6 5 4 31 10 22 8 40 0