Download to read offline
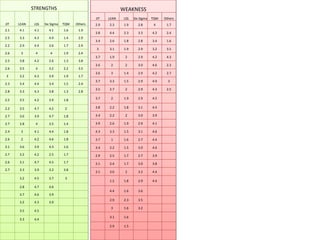

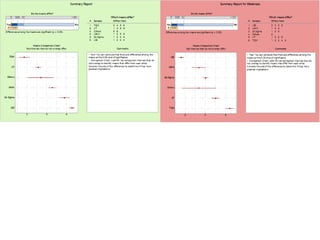
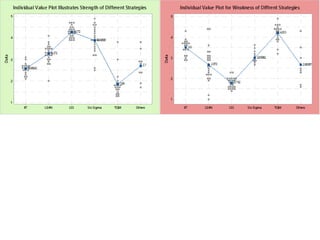

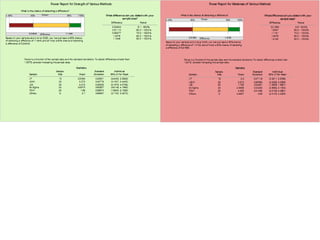
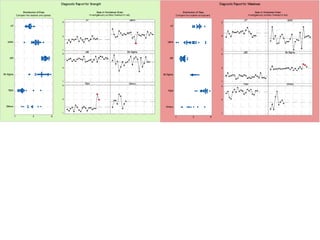


This document presents a SWOT analysis comparing the strengths and weaknesses of different quality strategies, including JIT, Lean, LSS, Six Sigma, TQM, and others. Tables of data on strengths and weaknesses are provided. Statistical analyses were conducted to determine if there are significant differences in the means for strengths and weaknesses among the different methods. Both analyses found significant differences, indicating at least one method has a mean strength or weakness that is different from the others.