Switzerland Exports & Imports
•
0 likes•82 views

Switzerland top Exports & Imports from & to India , and last 3 years export and import value, Analysis.

Recommended
More Related Content
Recently uploaded
Recently uploaded (20)
Featured
Featured (20)
Switzerland Exports & Imports
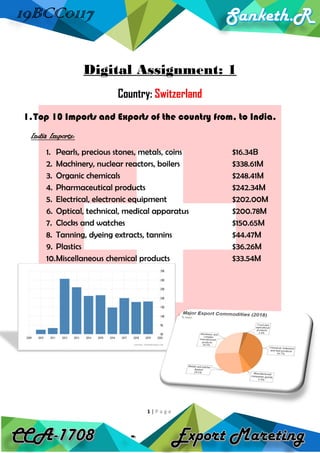
- 1. 1 | P a g e 19BCC0117 Digital Assignment: 1 Country: Switzerland 1.Top 10 Imports and Exports of the country from, to India. India Imports: 1. Pearls, precious stones, metals, coins $16.34B 2. Machinery, nuclear reactors, boilers $338.61M 3. Organic chemicals $248.41M 4. Pharmaceutical products $242.34M 5. Electrical, electronic equipment $202.00M 6. Optical, technical, medical apparatus $200.78M 7. Clocks and watches $150.65M 8. Tanning, dyeing extracts, tannins $44.47M 9. Plastics $36.26M 10.Miscellaneous chemical products $33.54M
- 2. 2 | P a g e 19BCC0117 India Exports 1. Organic chemicals $543.24M 2. Pearls, precious stones, metals, coins $272.28M 3. Machinery, nuclear reactors, boilers $45.83M 4. Inorganic chemicals, isotope $45.23M 5. Electrical, electronic equipment $35.76M 6. Articles of apparel, knit or crocheted $32.85M 7. Tanning, derivatives, pigments $30.43M 8. Clocks and watches $23.47M 9. Articles of leather, animal gut, travel good $23.10M 10.Optical, photo, technical, medical apparatus $21.36M
- 3. 3 | P a g e 19BCC0117 Analysis: 1. Switzerland had a total export of 310,524,275.09 in thousands of US$ and total imports of 278,665,555.58 in thousands of US$ leading to a positive trade balance of 31,858,719.51 in thousands of US$ The Effectively Applied Tariff Weighted Average for Switzerland is 1.70% and the Most Favored Nation (MFN) Weighted Average tariff is 3.42%. 2. The trade growth is 1.21% compared to a world growth of 3.50%. GDP of Switzerland is 705,140,354,170 in current US$. Switzerland services export is 126,842,177,850 in BoP, current US$ and services import is 106,038,945,540 in Bop, current US. 3. Switzerland exports of goods and services as percentage of GDP is 66.13% and imports of goods and services as percentage of GDP is 53.90%.
- 4. 4 | P a g e 19BCC0117 2.Major product category for the past 3 years. Import Product Group 2016 2017 2018 Intermediate goods $ 13,01,72,120 $ 11,84,07,884 $ 11,74,64,209 Stone and Glass $ 10,20,06,015 $ 9,12,88,108 $ 8,87,18,363 Consumer goods $ 8,56,89,728 $ 9,36,54,959 $ 10,26,20,472 Capital goods $ 4,37,86,801 $ 4,56,91,174 $ 4,90,14,938 Chemicals $ 4,27,09,047 $ 4,54,83,929 $ 4,91,65,031 Export Product Group 2016 2017 2018 Intermediate goods $ 15,05,50,366 $ 13,76,57,642 $ 13,68,92,845 Stone and Glass $ 9,96,30,768 $ 8,53,59,152 $ 8,22,34,784 Consumer goods $ 9,89,42,416 $ 10,25,85,008 $ 11,10,82,643 Chemicals $ 9,32,76,302 $ 9,73,26,973 $ 10,33,58,381 Capital goods $ 5,01,55,286 $ 5,36,29,523 $ 5,64,32,301
- 5. 5 | P a g e 19BCC0117 The Interpretation of data 1. The Swiss economy is extremely open to foreign trade, which represents 120% of the country’s GDP (World Bank - 2018). The European Union is Switzerland's largest trade partner, accounting for two-thirds of its total foreign trade. 2. Since 2002, the country has signed agreements with the EU regarding seven key trade sectors. Exports of goods and services account for nearly two-thirds of the country’s GDP. 3. Main exports are gems (20.6%), pharmaceuticals (14.4%), blood (9.4%), and clocks and watches (4.4%), while the main imports are gems and precious metals (22.7%), pharmaceuticals (7%), jewellery (5.8%), and vehicles (3.8%) (Comtrade data). 4. In 2018, Switzerland's main clients were Germany (15.3%), United States (13.2%), China (9.7%) and France (6.4%). Its main suppliers were Germany (20.7%), United Kingdom (9.5%), Italy (7.6%) and United States (7.6%) (Comtrade data). 5. Switzerland has a large trade surplus. Exports rely mostly on high-tech sectors, which are less dependent on the international economic situation than other industries.