Download to read offline
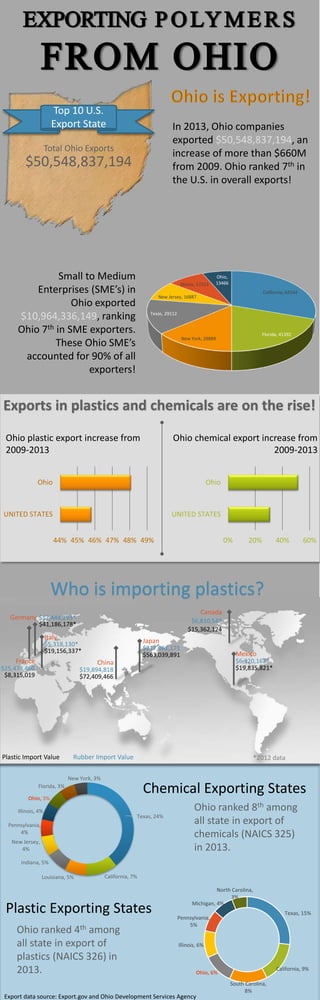

In 2013, Ohio exported over $50.5 billion, ranking 7th among U.S. states in total exports, with small to medium enterprises responsible for 90% of all exporters. The state ranked 4th in plastics and 8th in chemicals exports, experiencing significant growth since 2009. Notably, China and Germany were key importers of Ohio's plastic and rubber products.


