McKinsey Survey: Saudi consumer sentiment during the coronavirus crisis

Consumer optimism in Saudi Arabia has remained steady since mid-March, but spending patterns have changed to focus more on essential goods. In KSA, a smaller proportion of consumers saw a decline in income and savings, but more than half continue to report a decline. The effect is seen in spending patterns and new habits adopted by consumers. Category spending indicates that consumers are stocking up in anticipation of the country’s upcoming tax increase on July 1, 2020. Consumers are not yet fully comfortable going back to “regular” out-of-home activities and are waiting for milestones beyond government lifting restrictions to return to normal patterns. Thus, they have started adopting new digital and low-touch activities, including grocery delivery. These exhibits are based on survey data collected in KSA from June 16–18, 2020. Check back for regular updates on KSA consumer sentiments, behaviors, income, spending, and expectations.

Recommended
Recommended
More Related Content
What's hot
What's hot (20)
Similar to McKinsey Survey: Saudi consumer sentiment during the coronavirus crisis
Similar to McKinsey Survey: Saudi consumer sentiment during the coronavirus crisis (20)
More from McKinsey on Marketing & Sales
More from McKinsey on Marketing & Sales (20)
Recently uploaded
Recently uploaded (20)
McKinsey Survey: Saudi consumer sentiment during the coronavirus crisis
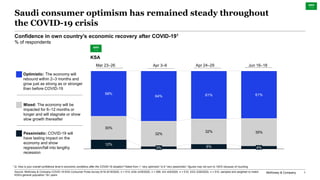
- 1. McKinsey & Company 1 Saudi consumer optimism has remained steady throughout the COVID-19 crisis Confidence in own country’s economic recovery after COVID-191 % of respondents 1 Q: How is your overall confidence level in economic conditions after the COVID-19 situation? Rated from 1 “very optimistic” to 6 “very pessimistic”; figures may not sum to 100% because of rounding. Source: McKinsey & Company COVID-19 KSA Consumer Pulse Survey 6/16–6/18/2020, n = 514; 4/24–4/29/2020, n = 508; 4/3–4/6/2020, n = 510; 3/23–3/26/2020, n = 510, sampled and weighted to match KSA's general population 18+ years 12% 6% 30% 32% 32% 35% 58% 64% 61% 61% 3% 4% Mixed: The economy will be impacted for 6–12 months or longer and will stagnate or show slow growth thereafter Pessimistic: COVID-19 will have lasting impact on the economy and show regression/fall into lengthy recession Optimistic: The economy will rebound within 2–3 months and grow just as strong as or stronger than before COVID-19 KSA Mar 23–26 Apr 3–6 Apr 24–29 Jun 16–18
- 2. McKinsey & Company 2 Reduce slightly / reduce a lot About the same Increase slightly / increase a lot Past 2 weeks 10% 32% 50% 6% Next 2 weeks 31% 63% Past 2 weeks 58% 12% 38% 1 Q: How has the COVID-19 situation affected your (family’s) overall available income, spending, and savings in the past two weeks? Figures may not sum to 100% because of rounding. 2 Q: How do you think your overall available income, spending, and savings may change in the next two weeks? Figures may not sum to 100% because of rounding. More than half of consumers have seen a decline in income and savings in the last two weeks 45% 18% 38% Past 2 weeks 20% 44% 36% Past 2 weeks 34% 39% 27% Next 2 weeks April 24–29 June 16–18 Household income1,2 % of respondents Household spending1,2 % of respondents Household savings1,2 % of respondents 12% Past 2 weeks 10% 40% 22% 68% 25% Past 2 weeks 63% 15% 45% Next 2 weeks Source: McKinsey & Company COVID-19 KSA Consumer Pulse Survey 6/16–6/18/2020, n = 514; 4/24–4/29/2020, n = 508, sampled and weighted to match KSA's general population 18+ years April 24–29 June 16–18 April 24–29 June 16–18
- 3. McKinsey & Company 3 KSA consumers increasingly believe that adjustment to their routines due to COVID-19 will last well beyond another two months 42% 0–1 month 14% 31% 10% 4%More than one year 7–12 months 2–3 months 4–6 months 10% 7% 28% 29% 17% 9% No impact More than one year 2–3 months 0–1 month 4–6 months 7–12 months Adjustments to routines1 % of respondents Impact on personal/household finances2 % of respondents ~87% believe it will take another 2+ months before routines can return to normal, up from 84% in the last pulse survey ~83% believe their finances will be impacted for 2+ months by the COVID-19 situation, down from 91% in the last pulse survey 1 Q: How long do you believe you need to adjust your routines, given the current COVID-19 situation, before things return back to normal in KSA (e.g., government lifts restrictions on events/travel)? Figures may not sum to 100% because of rounding. 2 Q: How long do you believe your personal/household finances will be impacted by the COVID-19 situation? Figures may not sum to 100% because of rounding. Source: McKinsey & Company COVID-19 KSA Consumer Pulse Survey 6/16–6/18/2020, n = 514, sampled and weighted to match KSA's general population 18+ years
- 4. McKinsey & Company 4 Which best describes how often you are doing each of the following items1 % of respondents 1 Q: Which best describes how often you are doing each of the following items? Possible answers: “doing less since coronavirus started”; “doing about the same since coronavirus started”; “doing more since coronavirus started.” KSA consumers are becoming more mindful of how they spend their money and adopting habits like making lists and researching 9% 8% 10% 11% 19% 39% 42% 43% 50% 46% 52% 50% 48% 39% 35% Becoming more mindful of where I spend my money Looking for ways to save money when shopping Changing to less expensive products to save money 100% Researching brand and product choices before buying Spending time planning/making shopping lists Doing less Doing about the same Doing more Source: McKinsey & Company COVID-19 KSA Consumer Pulse Survey 6/16–6/18/2020, n = 514, sampled and weighted to match KSA's general population 18+ years
- 5. McKinsey & Company 5 Consumers show increased shopping intent for essential categories, possibly in anticipation of an expected tax increase in July 13 26 31 34 45 57 48 46 64 56 15 15 20 30 54 35 28 17 24 23 14 9 15 8 9 19 38 22 17 9 Tobacco products Groceries Snacks Alcohol Household supplies Food takeout & delivery Quick-service restaurant Restaurant Footwear Apparel Accessories Jewelry Non-food child products Personal-care products Furnishings & appliances Skin care & makeup Expected spending per category over the next two weeks compared to usual1 % of respondents Decrease Stay the same Increase 24 41 49 68 38 49 58 26 45 46 46 60 56 63 71 66 31 13 9 12 10 16 12 17 13 9 15 15 13 16 9 13 Personal-care services Fitness & wellness Entertainment at home Consumer electronics Books/magazines/newspapers Pet-care services Out-of-home entertainment Gasoline Vehicle purchases Short-term home rentals Travel by car Cruises Adventures & tours International flights Hotel/resort stays Domestic flights 1 Q: Over the next two weeks, do you expect that you will spend more, about the same, or less money on these categories than usual? Figures may not sum to 100% because of rounding. 2 Net intent is calculated by subtracting the % of respondents stating they expect to decrease spending from the % of respondents stating they expect to increase spending. 3 Data not available Net intent2 +7 -28 -40 -56 -28 -33 -46 -9 -32 -37 -31 -45 -43 -47 -62 -53 Net intent2 +22 +4 +23 -45 +2 -14 -10 +0 -22 -43 -39 -31 -56 -47 +2 -13 Source: McKinsey & Company COVID-19 KSA Consumer Pulse Survey 6/16–6/18/2020, n = 514, sampled and weighted to match KSA's general population 18+ years N/A3
- 6. McKinsey & Company 6 Consumers expect to shop more online across all categories, except jewelry 1 Q: Over the next two weeks, where do you expect you’ll buy these categories? Tell us if you will shop in the following places more, about the same, or less in the next two weeks; please note, if you don’t buy in one of these places today and won’t in next two weeks, please select “N/A.” 2 Net intent is calculated by subtracting the % of respondents stating they expect to decrease shopping frequency from the % of respondents stating they expect to increase shopping frequency. Expected change in shopping channel per category over the next two weeks1 Axes show net intent,2 bubble size relative to share of respondents that have purchased category in last six months 18 30-3 -33 0 3 -45 -6 6 9 12 15 3 -30 21 24 -24 3627 -39 33 -21 -42 39 42 -48 -36 -27 -18 -15 -12 -9 -3 0 6 Jewelry Entertainment at home (e.g., Netflix) Snacks Fitness & wellness Accessories Tobacco Groceries Food takeout & delivery Household supplies (e.g., cleaning, laundry) Personal-care products (e.g., soap, shampoo) Furnishing & appliances Skincare & makeup Non-food child products (e.g., diapers) ApparelFootwear Consumer electronics Books, magazines, newspapers Household essentials Discretionary Entertainment at home In-store Online Source: McKinsey & Company COVID-19 KSA Consumer Pulse Survey 6/16–6/18/2020, n = 514, sampled and weighted to match KSA's general population 18+ years
- 7. McKinsey & Company 7 More people expect to make a portion of their purchases online post-COVID-19 than before Consumers’ use of online channel before and after COVID-191,2 % of respondents purchasing online3 1 Q: Before the coronavirus (COVID-19) situation started, what proportion of your purchases in this category were online vs from a physical store/in person? 2 Q: Once the coronavirus (COVID-19) situation has subsided, tell us what proportion of your purchases in this category you think will be online vs from a physical store/in person? 3 Respondents who indicated that they have not bought the category online and do not intend to do so in the next two weeks are classified as not purchasing online. 37 59 39 32 45 42 61 47 64 56 62 37 62 79 57 34 Household supplies +10 +22 +13 Jewelry Snacks +8 Non-food child products Groceries Food takeout & delivery Consumer electronics +14 +20Furnishing & appliances +12Personal-care products +6Skin care & makeup Fitness & wellness Books, magazines, newspapers +13 Apparel +16Footwear +16 Entertainment at home Accessories Tobacco +12 +14 +19 +5 +16 Pre-COVID-19 Growth in consumers buying online % growth in customers purchasing category online 22% 22% 56% 10% 44% 44% 29% 38% 26% 33% 28% 16% 29% 6% 31% 28% 35% Source: McKinsey & Company COVID-19 KSA Consumer Pulse Survey 6/16–6/18/2020, n = 514, sampled and weighted to match KSA's general population 18+ years
- 8. McKinsey & Company 8 Have you used any of the following since COVID-19 started1 % of respondents Many consumers have discovered new shopping behaviors, including new stores and brands 1 Q: Since the coronavirus (COVID-19) situation started (i.e., in the past ~3 months), which of the following have you done? 25% consumers selected “none of these.” 2 “New shopping method” includes curbside pickup and delivery apps. 55% 41% 37% 35% 31% Different brand New digital shopping method Private label/store brand Different retailer/store/website New shopping method2 Source: McKinsey & Company COVID-19 KSA Consumer Pulse Survey 6/16–6/18/2020, n = 514, sampled and weighted to match KSA's general population 18+ years 75% Consumers have tried a new shopping behavior
- 9. McKinsey & Company 9 Value and convenience are key drivers for consumers trying new places to shop Reason for shopping at a new retailer/store/website in the past three months1 % of respondents selecting reason as top three 39% 30% 25% 28% 25% 23% 18% 26% 27% 7% 13% 8% 7%Company treats employees well Better prices/promotions Better shipping/delivery costs Offers good delivery/pickup options Can get all the items I need from one place Better value More easily accessible from my home Less crowded/shorter lines Products are in stock Better quality Offers natural/organic options Cleaner/has better hygiene measures Supporting local businesses 1 Q: You mentioned you shopped from a new retailer/store/website since the coronavirus (COVID-19) situation started. What was the main reason you decided to try this new retailer/store/website? Select up to 3. Source: McKinsey & Company COVID-19 KSA Consumer Pulse Survey 6/16–6/18/2020, n = 514, sampled and weighted to match KSA's general population 18+ years Value Health/Hygiene Quality/Organic Purpose-driven Convenience Availability
- 10. McKinsey & Company 10 Many consumers have tried a new brand based on price and availability Reason for trying a new brand in the past three months1 % of respondents selecting reason as top three 45% 32% 26% 10% 34% 31% 13% 25% 21% 14% 8% Better value Cleaner/has better hygiene measures Better prices/promotions Better shipping/delivery costs Larger package sizes Products are in stock Is natural/organic Better quality Is available where I’m shopping Supporting local businesses The company treats its employees well 1 Q: You mentioned you tried a new/different brand than what you normally buy. What was the main reason that drove this decision? Select up to 3. “Brand” includes different brand, new private label/ store brand. Source: McKinsey & Company COVID-19 KSA Consumer Pulse Survey 6/16–6/18/2020, n = 514, sampled and weighted to match KSA's general population 18+ years Value Availability Purpose-driven Quality/Organic Convenience Health/Hygiene
- 11. McKinsey & Company 11 Source of uncovering new retailer/store/website1 % of respondents Online activity including display ads and word of mouth are powerful tools for consumers discovering new places to shop 1 Q: You mentioned you shopped from a different retailer/store/website since the coronavirus (COVID-19) situation started. How did you initially come across this new retailer/store/website? Select one. 26 13 27 277 Heard from a friend/family member Proactively researched Advertisement on TV/Print/Radio Someone talking about it on social media Advertisement online Source: McKinsey & Company COVID-19 KSA Consumer Pulse Survey 6/16–6/18/2020, n = 514, sampled and weighted to match KSA's general population 18+ years
- 12. McKinsey & Company 12 Have you used or done any of the following since COVID-19 started,1 % of respondents 1 Q: Have you used or done any of the following since the COVID-19 situation started? If yes, Q: Which best describes when you have done or used each of these items? Possible answers: “just started using since COVID-19 started”; “using more since COVID-19 started”; “using about the same since COVID-19 started”; “using less since COVID-19 started.” Saudi consumers have picked up new digital and low-touch activities, including new remote learning and app usage 31% 32% 17% 19% 23% 10% 12% 22% 15% 23% 6% 9% 13% 8% 6% 5% 4% 4% 4% Digital exercise machine 4% Telemedicine: physical 3% 5% Video chat: personal Playing online games 2% Online streaming 5% Videoconferencing: professional Remote learning: my children Remote learning: myself 0%Spending time outdoors TikTok Online fitness Wellness app 5% 1%Telemedicine: mental 3%Watching e-sports 25% 29% 10% 18% 17% 31% 30% 12% 42% 23% 6% 12% 5% 5% 9% 15% 9% 8% Used a new store/restaurant app Used deal-finding plug-ins 3% 2% 3%Meal-kit delivery Restaurant delivery 7% 2% Purchased pre-owned products Purchased directly from social media Grocery delivery Personal care/grooming at home 2% Store curbside pickup Restaurant curbside pickup In-store self-checkout 3% Buy online for in-store pickup 4% 6% Quick-serve restaurant drive-thru 5% Cooked regularly for myself/my family Not using Just started usingUsing less / the same Using more Source: McKinsey & Company COVID-19 KSA Consumer Pulse Survey 6/16–6/18/2020, n = 514, sampled and weighted to match KSA's general population 18+ years
- 13. McKinsey & Company 13 Consumer changes to digital and low-touch activities fall into three primary buckets 1 Q: Compared to now, will you do or use the following more, less or not at all, once the coronavirus (COVID-19) situation has subsided? Possible answers: “will stop this”; “will reduce this”; “will keep doing what I am doing now”, “will increase this.” 2 User growth is calculated as % of respondents who replied that they are new users over % of respondents who replied that they were either: increased usage users, same usage users, or reduced usage users. UsergrowthsinceCOVID-192 High(>23%)Low(<23%) Intent to use after COVID-191 Percent of new or increased users who intend to keep doing activity after COVID-19 Low (<69%) Medium-high (>69%) Works for now Activities necessitated by COVID-19 that are poor substitutes for in-person counterparts and consequently have lower intent to continue Accelerated shifts Satisfactory digital replacements for in-person activities and connectivity, with growing adoption Potentially here to stay New and familiar forms of entertainment and interaction with medium-high intent to continue User growth is defined as the percent of respondents who replied that they are new users over the percent of respondents who replied that they were using this service pre-COVID-19 Intent to continue is defined as the percent of respondents who replied that, after COVID-19, they will keep their usage at the same level or will increase usage Source: McKinsey & Company COVID-19 KSA Consumer Pulse Survey 6/16–6/18/2020, n = 514, sampled and weighted to match KSA's general population 18+ years
- 14. McKinsey & Company 14 UsergrowthsinceCOVID-192 Intent to use after COVID-191 Percent of new or increased users who intend to keep doing activity after COVID-19 Post-COVID-19 usage intent is higher for new fitness and telemedicine; lower for workarounds mandated by COVID-19 1 Q: Compared to now, will you do or use the following more, less, or not at all, once the coronavirus (COVID-19) situation has subsided? Possible answers: “will stop this”; ”will reduce this”; “will keep doing what I am doing now”; “will increase this.” 2 User growth is calculated as % of respondents who replied that they are new users over % of respondents who replied that they were using the product/service pre-COVID-19 (using more, using the same or using less). High(>23%)Low(<23%) Low (<69%) Medium-high (>69%) Works for now Accelerated shifts Potentially here to stay User growth Intent to continue Meal-kit delivery Videoconferencing: professional Restaurant curbside pickup Online fitness 38% 70%Changed primary grocery store Store curbside pickup 21% 65% User growth Intent to continue 43% 54% 42% 58% 85% 62% Grocery delivery 33% 70%Telemedicine: physical 83% 63% Wellness app 27% 82%Remote learning: my children 48% 67% 24% 44% Spending time outdoors Watching e-sports Online streaming Telemedicine: mental Quick-serve restaurant drive-thru Digital exercise machine 6% 11% 9% 22% 16% 23% User growth 76% 70% 69% 71% 72% 69% Intent to continue Remote learning: myself 27% 77% Buy online for in-store pickup 25% 73% In-store self-checkout 23% 88% Restaurant delivery 18% 64% TikTok 17% 64% Video chat: personal 14% 65% Playing online games 14% 59% Source: McKinsey & Company COVID-19 KSA Consumer Pulse Survey 6/16–6/18/2020, n = 514 sampled and weighted to match KSA's general population 18+ years
- 15. McKinsey & Company 15 Saudis are planning to increase out-of-home activities in the next two weeks Consumers’ engagement with activities outside home1 % of respondents 1 Q: Did you leave your house for the following activities over the past two weeks? Chart represents the percentage of respondents who indicated that they left home at least once during the past week to do this activity. Q: For which of the following activities do you intend to leave your home to do in the next two weeks? Chart represents % of respondents who intend to leave their home to do this activity during the next two weeks. 78% 46% 38% 19% 17% 16% 13% 13% 12% 11% 10% 10% 9% 7% 6% Drive more than 2 hours from home Get together with friends Shop for groceries/necessities Go to a hair or nail salon Get together with family Dine-in at a restaurant or bar Work outside my home Shop for non-necessities Use ride-sharing service Visit a crowded outdoor public place Use public transportation Go out for family entertainment Travel by airplane Go to the gym or fitness studio Attend a large event Past 2 weeks Next 2 weeks 72% 50% 41% 26% 17% 21% 19% 17% 17% 12% 17% 14% 16% 14% 11% Source: McKinsey & Company COVID-19 KSA Consumer Pulse Survey 6/16–6/18/2020, n = 514, sampled and weighted to match KSA's general population 18+ years
- 16. McKinsey & Company 16 Most Saudis are concerned about out-of-home activities, particularly going to crowded events and using shared services Consumers’ worries about out-of-home activities in the next two weeks1 % of respondents 1 Q: How worried would you be if you were to do the following activities in the next two weeks? Possible answers: “not worried at all”; “not very worried”; “somewhat worried”; “very worried”; “extremely worried.” Figures may not sum to 100% of rounding. 3 Level of concern is calculated by subtracting the % of respondents stating they are “not worried at all” and “not very worried” from “very worried” and “extremely worried.” Level of concern2 28% 25% 22% 21% 18% 17% 17% 11% 12% 13% 11% 12% 13% 12% 12% 11% 11% 9% 9% 39% 32% 34% 35% 35% 31% 26% 27% 25% 25% 26% 25% 23% 24% 22% 22% 22% 22% 17% 32% 43% 44% 45% 48% 52% 57% 62% 62% 63% 63% 63% 64% 64% 66% 67% 68% 68% 74% Get together with family Drive more than 2 hours from home Shop for groceries/necessities Go to a hair or nail salon Dine-in at a restaurant or bar Work outside my home Shop for non-necessities Go to a shopping mall Use public transportation Rent a short-term home Get together with friends Go out for family entertainment Travel by airplane Use ride-sharing service Stay in a hotel Visit a crowded outdoor public place Use a clothing rental service Go to the gym or fitness studio Attend a large event Not worried Somewhat worried Worried Source: McKinsey & Company COVID-19 KSA Consumer Pulse Survey 6/16–6/18/2020, n = 514, sampled and weighted to match KSA's general population 18+ years +4 +18 +22 +24 +35 +30 +40 +51 +50 +51 +52 +50 +52 +51 +54 +56 +59 +57 +65
- 17. McKinsey & Company 17 Milestones for the KSA population not yet engaging with out-of-home activities1 % of respondents awaiting each milestone before engaging Of consumers waiting to restart out-of-home activities, 77 percent are waiting for milestones beyond the lifting of restrictions 1 Q: Which best describes when you will regularly return to stores, restaurants, and other out-of-home activities? Chart rebased to exclude those already participating in these activities and those who do not deem any of these items important. Figures may not sum to 100% because of rounding. 6215 23 Only once there’s a vaccine or treatment Government lifts restriction + other requirement Government lifts restrictions Medical authorities deem safe 30% Stores, restaurants, and other indoor places start taking safety measures 21% I see other people returning 11% Government lifts restrictions and… 94% of people are not currently engaging in regular out-of-home activities Source: McKinsey & Company COVID-19 KSA Consumer Pulse Survey 6/16–6/18/2020, n = 514, sampled and weighted to match KSA's general population 18+ years
- 18. McKinsey & Company 18 Protective equipment and sanitization are most important to consumers as they decide where to shop in-store Top priorities when deciding where to shop in-store1 % of respondents for whom this criterion is the most important2 1 Q: Once restrictions lift, which of the following factors will be most important to you as you decide which of these places to visit in person? Respondents were asked to select the most important. 2 The following categories are included in each bucket: Cleaning and sanitization—increased cleaning, improved air filtration, availability of sanitizing supplies throughout the store; Health checks—customer wellness check (e.g., temperature) on entry, employees' wellness check (e.g., temperature) on entry; Masks and barriers—customers and employees wear masks, customers and employees provided masks and gloves, plastic barrier with cashier; No-contact purchasing—curbside pick-up, cashier-less checkout, no contact delivery, buy online for pickup in store; Physical distancing—customer number limit, distancing in customer line, reduced employee activity during shopping hours; Store regulations—no customer product testing, one-way store aisles, special hours for high-risk shoppers. 25% 19% 19% 15% 14% 8% Masks and barriers No-contact purchasing Cleaning and sanitization Health checks Physical distancing Store regulations Source: McKinsey & Company COVID-19 KSA Consumer Pulse Survey 6/16–6/18/2020, n = 514, sampled and weighted to match KSA's general population 18+ years
- 19. McKinsey & Company 19 Which best describes how often you are doing each of the following items1 % of respondents 1 Q: Which best describes how often you are doing each of the following items? Possible answers: “doing less since coronavirus started”; “doing about the same since coronavirus started”; “doing more since coronavirus started.” Figures may not sum to 100% because of rounding. Saudis have started focusing more on healthy packaging and how companies treat their employees when deciding on brands to buy Source: McKinsey & Company COVID-19 KSA Consumer Pulse Survey 6/16–6/18/2020, n = 514, sampled and weighted to match KSA's general population 18+ years 8% 10% 10% 11% 13% 40% 45% 52% 54% 55% 52% 45% 37% 35% 32% Retailers promotion of sustainable solutions Healthy and hygienic packaging How companies take care of the safety of their employees 100% Sustainable/eco-friendly products Company’s purpose/values Doing less Doing about the same Doing more Buying based on…
- 20. McKinsey & Company 20 Disclaimer McKinsey does not provide legal, medical, or other regulated advice or guarantee results. These materials reflect general insight and best practice based on information currently available and do not contain all of the information needed to determine a future course of action. Such information has not been generated or independently verified by McKinsey and is inherently uncertain and subject to change. McKinsey has no obligation to update these materials and makes no representation or warranty and expressly disclaims any liability with respect thereto.
Editor's Notes
- Removed the following: 1/ Meal kit: very low general adoption, trend mirrored those of restaurant & grocerys 2/ Fitness: Wellness App & Digital exercise machines – mirrored online personal training & fitness; in addition, had limited adoption 3/ Telemedicine – removed both physical health & mental health as total adoption low 4/ Watching online gaming – very similar to trend in "playing online gaming”
- Removed the following: 1/ Meal kit: very low general adoption, trend mirrored those of restaurant & grocerys 2/ Fitness: Wellness App & Digital exercise machines – mirrored online personal training & fitness; in addition, had limited adoption 3/ Telemedicine – removed both physical health & mental health as total adoption low 4/ Watching online gaming – very similar to trend in "playing online gaming”
- Removed the following: 1/ Meal kit: very low general adoption, trend mirrored those of restaurant & grocerys 2/ Fitness: Wellness App & Digital exercise machines – mirrored online personal training & fitness; in addition, had limited adoption 3/ Telemedicine – removed both physical health & mental health as total adoption low 4/ Watching online gaming – very similar to trend in "playing online gaming”