Download to read offline


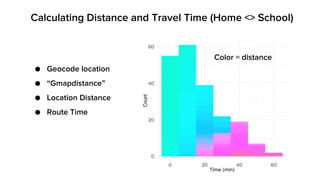
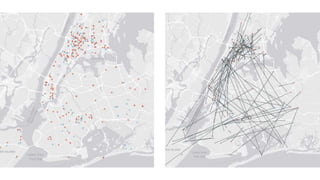
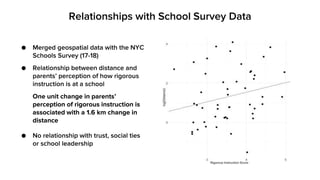
The document discusses services provided to 210 students ages 3-20, including special education access and transportation assistance between home and school. Geospatial data was merged with a 2017-2018 NYC Schools Survey to analyze relationships between distance from home to school and parents' perceptions of how rigorous instruction is at their child's school, finding that a 1.6 km increase in distance is associated with a 1 unit change in perceived rigor. No relationships were found for other survey measures like trust or leadership.


